Calculation and selection of anti-roll bars, under-steer budget, and tire stiffness plots for a light weight sports car with vehicle level targets
Aim: Development of chassis for given targets and constraints of a Light-weight sports vehicle for optimum handling and feel.
Objective: To select anti-roll bars, and prepare Under-steer budget sheet by determining the contribution of each of the target components, for given vehicle level targets and making sure they cope with system level constraints.
To Calculate and finalize:
- Anti-roll bar Diameter (Front and rear) in (mm)
- Primary and secondary (auxiliary) roll stiffness at the wheel centre in ft-lb/deg
- Auxiliary roll stiffness in front and rear in %
- Tire stiffness plots (load v/s stiffness)
- Under-steer Budget sheet and
- Percentage contribution bar chart.
Assumptions:
- Anti-roll bar diameters are in increments of 0.25
- Solid roll bars (Dinner = 0)
- 5% higher load transfer in the front (to get under-steer, add it to the calculated value)
- 5% error in the results is acceptable.
- Only ARB diameter can be tuned to meet the targets, spring rates, masses, dimensions are non-tuneable parameters.
Methodology:
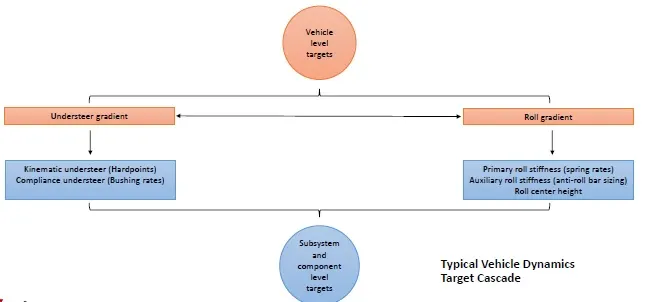
Initially using the given input parameters, the ride rates, wheel rates and the respective roll stiffness figures were calculated. Using the target roll gradient, a set of required parameters were calculated for the given vehicle inputs. The actual figures for roll stiffness and lateral load transfer were cross checked for a selected ARB to make sure the target conditions are fulfilled. After going back and forth, a set of ARBs finalised.
Next the tire responses and target parameters were used to calculate cornering compliance due to each parameter. To maximise the under-steer gradient – which is the resultant of front and rear compliance contribution, the maximum constraint figures were selected. A bar chart was prepared finally, which indicated the percentage contribution of each of the parameters towards total under-steer gradient.
Targets and Inputs:
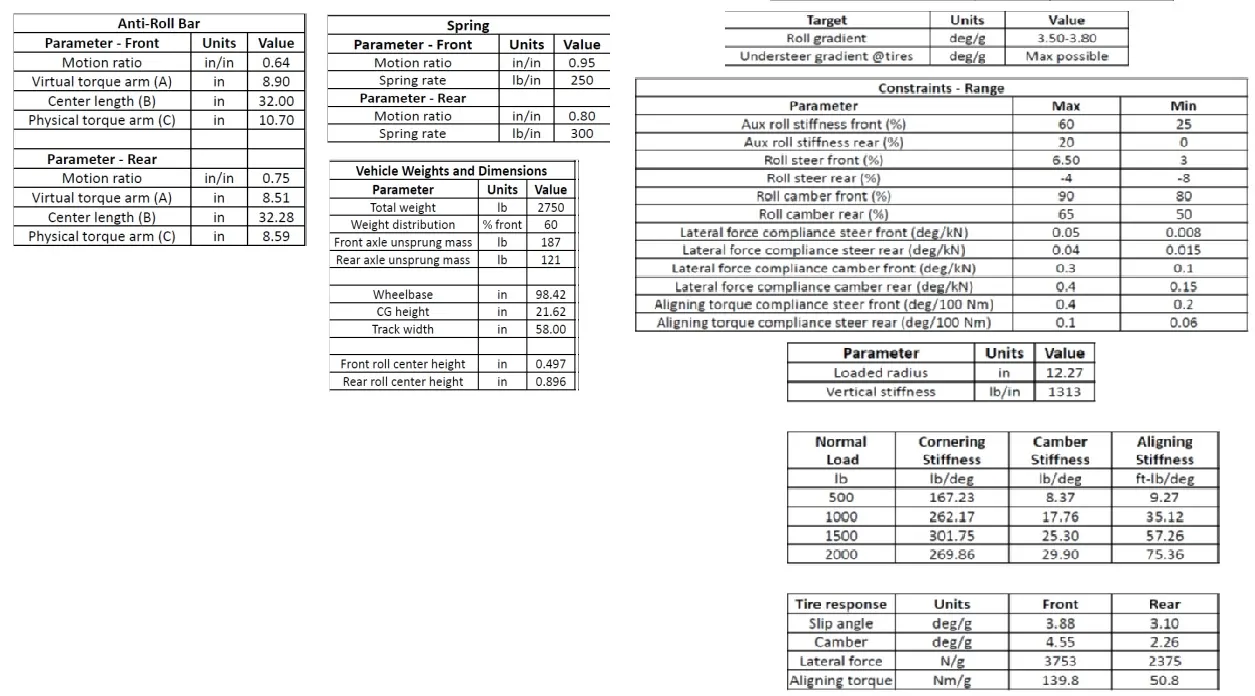 1. Selection of ARBs for target roll gradient:
Roll Gradient (φ/g):
The biggest contributing factor in the lateral load transfer is the elastic load transfer or load transfer due to rolling moment. The roll gradient is how many degrees the vehicle rolls when subjected to a lateral acceleration in g’s (Number of times the acceleration due to gravity).
It depends on the roll stiffness of the vehicle (KφTotal), roll centre position and its distance from C.G. (h_arm), and the lateral load transfer due to rolling (W).
The roll centre was located by joining the front (FRC) and rear (RRC) axle roll centres and the distance between the sprung mass C.G. and roll centre - hs_arm - about which the body rolls was calculated too.
Front Roll Centre Height = 0.497 inches, Rear Roll Centre Height = 0.896 inches
h_arm = hs_C.G - (FRC_H+(0.60*l)*((RRC_H - FRC_H)/l)) = 22.14231982 inches from the C.G.
where, wheelbase = l, FRC_H = Front roll centre height, RRC_H = Rear roll centre height.
But, we know the sprung mass distribution, which we can use to locate the sprung mass C.G.
The total roll stiffness (KφTotal) can be calculated from the rolling moment (Mφtotal ) created by the shifting of C.G. under lateral acceleration. Using the roll gradient as the actual value of rolling displacement for a lateral acceleration of 1g,
Mφtotal = Mφg + Mφl , and KφTotal = (Mφtotal) / roll gradient.
here,
Mφg – gravitational component of the moment,
Mφl – Lateral component of the moment
Mφg = Wsprung*h_arm*ay* cos φ = 294.765 lbs-ft,
the lateral acceleration (ay) is considered 1g, the roll angle (φ) is equal to the gradient and small enough to consider its cosine to be 1.
Mφl = Wsprung*h_arm*ay* sin φ = 4505.962 lbs-ft,
Similar as Mφg, with the sine of small angle (φ) being taken as the angle itself being the difference.
Mφtotal = 4800.727 lbs-ft. Hence,
KφTotal = 4624.825 /3.75 lbs-ft/degree = 1280.194 lbs-ft/degree
a) Rolling in the front:
The total roll stiffness is the sum of the roll stiffness at the axles. The front roll gradient is same as that of the rear but due to the biased weight distribution, the load transfer will differ and so will the stiffness parameters.
As required, the front has to have a 5% higher load transfer in lateral acceleration (with the already biased weight distribution) than the rear to have an under-steer setup- which is safer and is utilised in passenger cars. Similar to the total roll stiffness, the front roll stiffness is calculated from the roll gradient and lateral load transfer in front.
Kφfront = (Total lateral load transfer by roll (dWroll) * weight bias in front + 5%) *track-width (t) / roll gradient
dWf = Wsf*ay*h_C.G./t = 615.05172 lbs, dWrollf = dWf-(dWsf+dWusf),
dWsf = Wsf*ay* FRC_H /t = 7.5105439 lbs, dWusf = Wusf*ay*S.L.R/t = 39.560172 lbs.
S.L.R. –Static Loaded radius, assumed to be the C.G. of un-sprung mass in front.
the weight bias – 60% front, 40% rear.
Kφfront = (615.05172 lbs*(0.60 +0.05)*(58 inches/12)) / 3.75 degree/g = 798.1255212 lb-ft/degree
Roll stiffness for an axle is the sum of 3 components: RS due to tires (Kφtire), RS due to springs and their motion ratios (Kφwheel), RS due to ARB (KφARB).
Out of the 3, one is given and the other is determined in the first step and hence the 3rd - RS due to ARB is calculated.
1) Converting vertical stiffness Ktire into roll stiffness using the Kφ = Kt2/2 lbs/rad and then into lbs/degrees,
Kφtire_f = (Ktire_f*(t^2)) / (2)*12*(180/3.14) = (1313 lbs/in *(58 inches)2) / (2*180/3.14)*12 = 3211.847004 lb-ft/degree
2) Now, as the tire and other two stiffening components are in parallel fashion, while the Kφfront is the resultant of the three, we can break it further into 2 major components - 1.the tire and the 2.resultant of spring and ARB stiffness.
Isolating the tire form the system the resultant rolling stiffness Kφresultant_f ,
Kφresultant_f = Kφfront* Kφtire_f/( Kφtire_f - Kφfront) = 1062.035153 lb-ft/degree
3) The resultant stiffness is the sum of primary and auxiliary stiffness which is the sum of stiffness due to springs (wheel rate) and due to ARB respectively.
The wheel rate is altered using motion ratio which depends on the positioning of the spring and how far it is from the wheel. It is basically the ‘actual spring rate’ and is the primary stiffness component in the above mentioned equation and can be calculated similar to Kφtire_f.
Kφwheel_f = (Kw_f *(t^2))/2*12*(180/3.14) = 551.9215387 lb-ft/degree. = Kφprimary_f.
Hence, KφAuxiliary_f = KφARB_f = Kφresultant_f – Kφprimary_f = 510.1136143 lb-ft/degree.
By the standard formula of Roll Stiffness of an ARB, we can calculate the required diameter of the bar.
KφARB_f = (((500000*(Df^4))/q)*M.R.*t^2), q= (0.4422*(A^2)*(B))+(0.2264*(C^3))
Virtual torque arm (A) = 8.9, Centre Length (B) = 32 , Physical Torque arm (C) = 10.7 ,Motion ratio (M.R.) = 0.64
Df = ARB diameter. = 23.33084554 mm
Selected ARB diameter = 23 mm.
b) Rolling in the rear:
From the total roll stiffness and the front roll stiffness, the remaining rear roll stiffness is calculated, and the similar process is followed to get the diameter for the rear ARB.
Kφrear = KφTotal – Kφfront = 482.0683729 lb-ft/degree
Similar to the front axle, the rear ARB diameter is calculated by first isolating the tire stiffness from the system to get resultant stiffness and the subtracting the primary stiffness from it to get the auxiliary stiffness which is due to the ARB and equating it to the standard formula.
1) Kφtire_r = (Ktire_r*(t^2)) / (2)*12*(180/3.14) = (1313 lbs/in *(58 inches)2) / (2*180/3.14)*12 = 3211.847004 lb-ft/degree
2) Kφresultant_r = Kφrear * Kφtire_r/( Kφtire_r - Kφrear) = 567.1997874 lb-ft/degree
3)
Kφwheel_r= (Kw_r *(t^2))/2*12*(180/3.14) = 469.6684119 lb-ft/degree. = Kφprimary_r
hence,
KφAuxiliary_r = KφARB_r = Kφresultant_r – Kφprimary_r = 97.53137553 lb-ft/degree
by standard formula for ARB roll stiffness,
KφARB_r = (((500000*(Dr^4))/q)*M.R.*t^2), q= (0.4422*(A^2)*(B))+(0.2264*(C^3))
Virtual torque arm (A) = 8.51 , Centre Length (B) = 32.28 , Physical Torque arm (C) = 8.59 ,Motion ratio (M.R.) = 0.75
Dr = Rear ARB diameter = 13.65158351 mm
Selected ARB diameter = 13.75 mm
As mentioned in the targets, the percentage of auxiliary roll stiffness i.e. the RS due to roll bars have limitations- 60% in the front of the axial roll stiffness, and 30% in the rear. This implies that the majority resistance to rolling in the front is due to the ARB while in the rear by the springs.
Now,
Kφfront = 798.1255212 lb-ft/degree and, KφAuxiliary_f = 510.1136143 lb-ft/degree.
hence, KφAuxiliary_f is (KφAuxiliary_f / Kφfront)*100 = 60.36499184 % of Kφfront.
similarly,
KφAuxiliary_r is (KφAuxiliary_r / Kφrear)*100 = 20.82161357 % of Kφrear.
2. Tire stiffness plots:
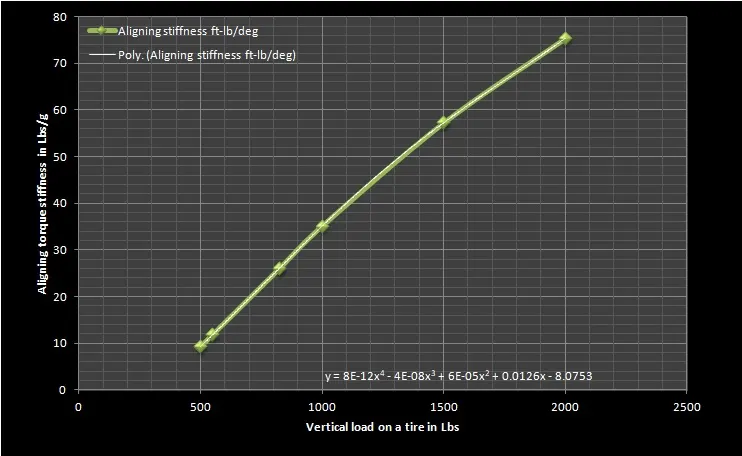
In this part, the tire characteristics such as cornering stiffness, camber stiffness and aligning torque stiffness were plotted against the normal-vertical load for a single tyre. As we know, all these parameters are sensitive to the vertical loading, it is essential to use the appropriate figures corresponding to the static load due to the weight distribution in under-steer budget calculations to get realistic results. For all the three parameters, using interpolation, corresponding figures for the static loads on each wheel were calculated and the end result was plotted in excel.
| Tire characteristics: | |||
| Load | Cornering stiffness | Camber stiffness | Aligning stiffness |
| in lbs | in lb/deg | lb/deg | ft-lb/deg |
| 500 | 167.23 | 8.37 | 9.27 |
| 550 | 176.724 | 9.309 | 11.855 |
| 825 | 228.941 | 14.4735 | 26.0725 |
| 1000 | 262.17 | 17.76 | 35.12 |
| 1500 | 301.75 | 25.3 | 57.26 |
| 2000 | 269.86 | 29.9 | 75.36 |
a) Normal Load vs Cornering Stiffness: Cornering stiffness is calculated as the slope of lateral force v/s slip angle plot. As mentioned, the cornering stiffness of a tire depends on the vertical load the tire is subjected to. In the initial portion of the plot,at low slip angles, a linear relationship exists between normal load and cornering stiffness. As the load increases the cornering stiffness which is a property of slip angle also increases and then it gradually goes through a translational zone. Beyond the translational zone, the frictional or sliding zone occurs where applying normal load would not produce any lateral force. The transition can be abrupt or gradual and this decides the break-way characteristics of the tire.
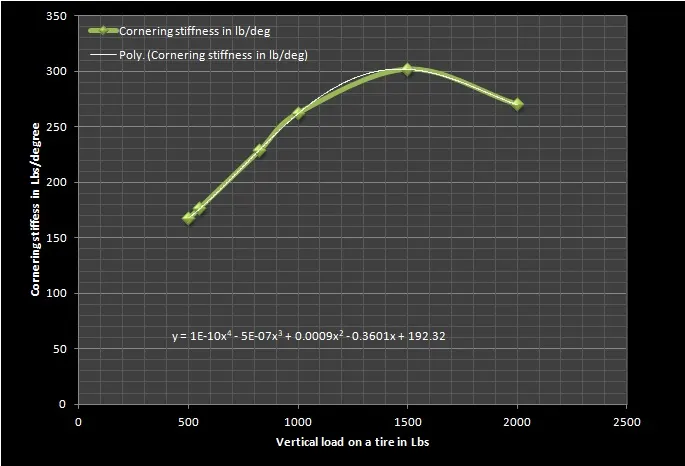
Linear Zone: Direct Proportionality with Normal Load
Intermediate/Translation Zone: From direct proportionality to peak cornering stiffness value
Frictional Zone: Beyond the peak cornering stiffness value
Assuming a completely dry road surface, tyre Load Sensitivity is a measure of the tire's ability to generate lateral force for a given normal load. A tyre is made up of rubber compounds which are not infinitely rigid and have a co-efficient of friction between the road surface and itself. As normal load is gradually increased, the tyre will produce a peak net lateral force till a certain load. Beyond this load the friction cannot hold the tyre and road surface any longer, as a result increasing normal load would only start to saturate the tyre which would result in a decrease in lateral force. This results in overheated tyre which struggles for grip. From the plot, the load limit can be found at around 900 lbs. Since the static load of the front and rear tyre is less than 850 lbs, the tyre stays in the elastic zone.
b) Normal Load vs Camber Stiffness: At zero slip angle, a cambered tire produces lateral force in the direction of tilt which is called as ‘camber thrust’. Similar to cornering stiffness, camber stiffness is the amount of lateral thrust produced per camber angle.
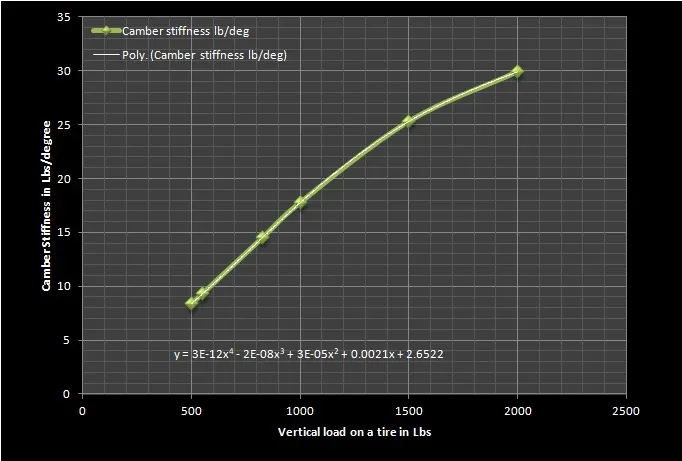
As the normal load on the tyre is increased, the tyre's camber stiffness gradually increases which suggest that the tyre has a greater camber angle and is producing additional lateral force. This lateral force as a result of camber thrust gives rise to an aligning moment that aids the turn. This effect is observed in very small amount and is usually given more emphasis in motorcycle dynamics.
c) Normal Load vs Aligning torque Stiffness: When the tyre patch distorts, it continuously loads and unloads during rolling. During loading the energy is higher, whereas when the tire print unloads it follows a different curve suggesting a hysteresis loss. This energy loss is what gives rise to a lag between and loading and unloading operation of the tyre tread/contact patch which is the rolling resistance in tyres. The loaded portion has a higher energy and thus produces higher force in relation to the unloaded portion. During cornering, due to the same inertial force, the lateral force produced acts at a certain distance away from the contact patch. This lateral force gives rise to a moment that acts about the centre of the contact patch and gives rise to 'aligning torque'. Aligning Stiffnessis the ability of the tyre to produce a moment for a given slip angle.
3. Under-steer Budget sheet preparation:
Under-Steer Budget Sheet is to tabulate and analyse the effects of different K&C parameters of the suspension system on the overall setup of the vehicle. Depending on which parameter contributes to under-steer by how much, various suspension geometry hard-points, bushing rates, structural members can be altered to get the target setup. Primarily tyre cornering stiffness is used to develop the relation between steer angle and load/cornering stiffness ratio in steady-state handling condition, however it isn't the only contributor to the overall cornering force. The front and rear compliances are simply the sum of various kinematic and compliance parameters which also contribute in cornering. The total 'Under-Steer Gradient' is simply the difference between front and rear cornering compliances.
1) Weight Distribution: It is the ratio of vertical load to cornering stiffness of the tyre and is known as the cornering compliance. As the cornering compliance varies with normal load, it is a dynamic property and a key contributor to the overall under-steer gradient. However, it is the hardest to control and has not much tuning potential and It contributes over 50% to the overall budget.
2) Rigid Body Aligning Torque: The lateral force acts at a point behind the contact patch of the tyre to produce a moment about the tyre centre that tends to straighten the tyre during a turning manoeuvre. This moment is the aligning torque and it always is a source of under-steer. Along with the caster/steering axis trail, this effect combined produces the self aligning torque.
Aligning Torque (deg/g) = total weight*(Pneumatic Trail/Wheel Base)*(Cαf+Cαr/Cαf*Cαr) in deg/g
3) Roll Steer: The tie rod length error or the tie rod angle error can lead to the suspension pulling/pushing on the wheel that leads to the pulling of car to one of the sides during hard acceleration called as ride steer. During cornering, the weight is transferred to the outer tyre having the same errors leads to change in toe angle of the outer wheel resulting under-steer or over-steer. The same effect at the rear produces opposite results t the front.
Roll Steer (deg/g): Roll Steer co-efficient (deg of steer/deg of roll)*Roll Gradient (deg of roll/g)
4) Roll Camber: When the vehicle rolls during cornering, it causes a gain of positive camber at the outer tyre. This positive camber further gives rise to camber thrust that results in the tyre aiding the turn. At the front, 90% roll camber is typically chosen which means that for every 10° degree of roll, the tyre would camber by +ve 1°. At the rear it is usually 50%.
Roll Camber (deg/g):
[Roll Camber co-efficient (deg of camber/deg of roll)*Roll Gradient(deg of roll/g)]*[(Tyre camber stiffness (N of lateral force/deg camber)/Tyre cornering stiffness(N of later force/deg slip))
5) Lateral Force Compliance Steer: The under-steer or over-steer effect produced due to this effect depends on the relative stiffness of the suspension and the steering assembly. When the steering is more compliant than suspension, the application of lateral force acts to deflect the steering which leads to under-steer. At the rear this effect is produced due to the relative stiffness of the bushings and links.
L.F.C.Steer (deg/g): LFCS co-efficient (deg/kN)*Tire Lateral Force (kN/g)
6) Lateral Force Compliance Camber: As the lateral force acts at a point below all the suspension and steering linkages(at the contact patch), the effect tends to pull the tyre to a positive camber which gives rise to under-steer. Thus LFCC is always a source of under-steer.
L.F. C. Camber (deg/g) =
LFCC co-efficient (deg/kN)*Tire Lateral force (kN/g)*(Camber thrust/Cornering Stiffness)
7) Aligning torque compliance steer: It is always an under-steer effect at the front and an over-steer effect at the rear. This is because the tire aligning torque always tries to straighten the wheels. Also, if the steering rack is flexibly mounted to the chassis, the under-steer effect can be pretty large.
Aligning Torque Compliance Steer (deg/g) =
ATCS co-efficient (deg/kN-m)*Tire Aligning torque (kN-m/g)
| Cornering Compliance calculations: | |||||||||||||||||
| Cornering compliance contributions | Cornering Compliance in [Degrees/g] | Understeer = (Front-Rear) in [Degrees/g] | Percentatge Contribution | ||||||||||||||
| Front | Rear | ||||||||||||||||
| Weight distribusion | (/100 of roll angle) | 7.207097 | 6.224395 | 0.982702 | 55.98703 | ||||||||||||
| Rigid body aligning torque | (/100 of roll angle) | 0.410859 | 0.23592 | 0.174939 | 9.966732 | ||||||||||||
| Roll steer | (/100 of roll angle) | 0.24375 | -0.15 | 0.39375 | 22.43294 | ||||||||||||
| Roll Camber | (/100 of roll angle) | 0.213365 | 0.128396 | 0.084969 | 4.840906 | ||||||||||||
| Lateral force compliance steer | (deg/kN*kN/deg) | 0.18765 | 0.095 | 0.09265 | 5.278507 | ||||||||||||
| Lateral force compliance camber | (deg/kN*kN/deg) | 0.071179 | 0.050042 | 0.021137 | 1.204233 | ||||||||||||
| Aligning torque compliance steer | (deg/kN-m*kN-m/deg) | 0.005592 | 0.000508 | 0.005084 | 0.289648 | ||||||||||||
| Total | 1.755231 | 100 | |||||||||||||||
Bar chart:
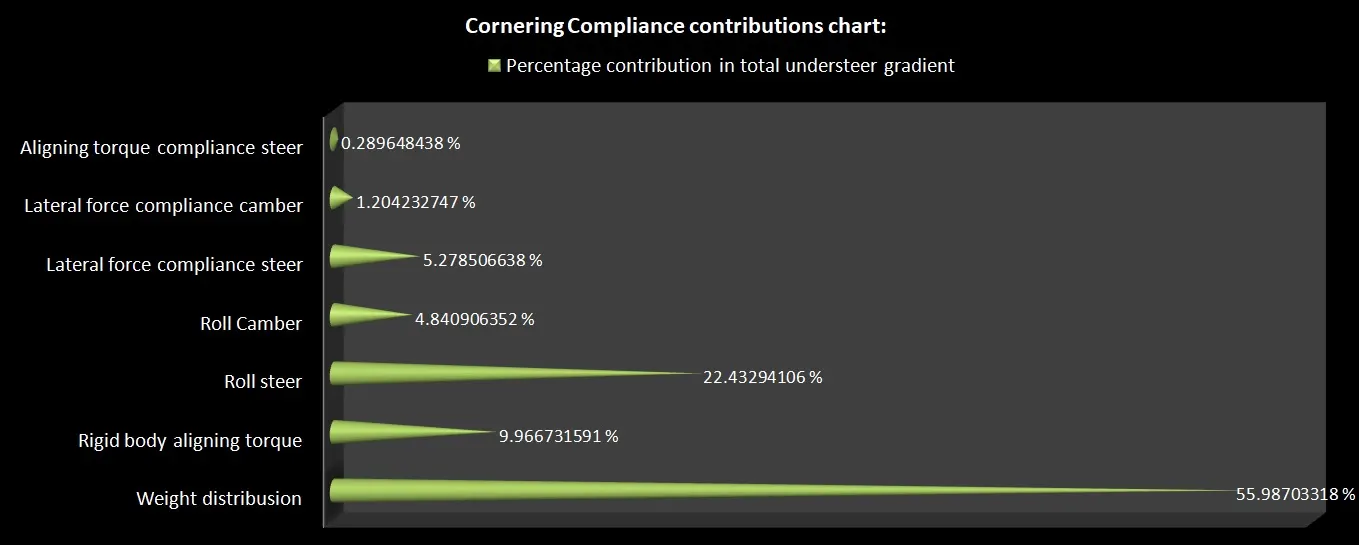
By analysing the above plot, the under-steer gradient of a vehicle can be altered and respective changes to the suspension geometry hard-points and bushing rates can be made to increase or decrease it further.
- The weight distribution component is the largest contributor of the total under-steer gradient (55.98%) and changing the weight distribution would greatly affect a lot of parameters which makes this property hard to tune for target setup.
- The roll steer effect that arises due to the toe out of the outer front wheel during cornering is the second largest contributor. Increasing the roll gradient would consequently increase the contribution of roll camber as it dependents on it too. So, if one needs to increase the under-steer gradient effectively, either the roll gradient or the roll steer co-efficient can be increased. It can be concluded that roll steer/roll camber compliance component are the most effective tuning parameters for handling setup.
- Rigid body aligning torque is a dynamic property which changes during cornering, and hence has less control. However, it is much easier to change lateral force compliance steer co-efficient. So if one wants to induce under-steer, the steering system is to be made more compliant than the suspension assembly.
- The contribution of aligning torque compliance steer is negligibly small (0.28%) and can be considered ineffective for tuning.