COMPARISON OF CRASH BEAM IN RIGID WALL BASE SIMULATION WITH IMPROVED ELEMENT SHELL PROPERTIES
AIM:
To compare the results with base simulation(study-1) and improved shell element properties(study-2) by using crash beam file as per given run time, animation steps, recommended properties of shell element, and finally to run the simulation of these two studies individually. Check the energy error and mass error and plot the results of different energy.
OBJECTIVE:
1. Using the crash beam file from the previous assignment, change the run time to 55 ms.
2. To change the number of animation steps during simulation to a minimum of 25 and a maximum of 60.
3. To run the base simulation without any modification to element properties.
4. At the end of the simulation, do the energy error and mass error checks and determine whether results would be acceptable. If acceptable, Plot rigid wall forces, internal energy, hourglass energy, contact energy, the total energy of the simulations.
5. To change all the shell elements properties to recommended properties, save this as separate, rad files, and run the simulation. Follow step 4 for study-2 also.
6. To create a brief report comparing all the results from the study-1 and study-2 for both simulations.
7. To comment on whether there is any change in the results and why there is any change in the result.
SOFTWARE USED: HYPERMESH (Radioss).
Recommended properties to improve shell element:
| Parameters | Comment | |
|
Ishell =24 |
QEPH 4 nodes shells are the best combination of cost and accuracy. | |
|
Ismstr=2 |
Full geometric nonlinearities (default)with possible small strain formulation activation in RADIOSS Engine. | |
|
Ish3n=2 |
Standard 3 noded shell (C0)with modification for large rotation(default) |
|
| N=5 | Number of integration points set to 5 for accuracy bending. | |
|
Ithick=1 |
Thickness change is taken into account for accuracy. |
|
|
Iplas=1 |
Iterative plasticity for good accuracy. |
THEORY:
TWO DIFFERENT ERROR:
Energy Error:
Energy Error must be negative and decreasing (except for the first cycles or in spring backstage). The error must be less than 15% at the end of the computation(5% for a good model). If the error increases a little and then decreases may be normal. If the error increases, this means that problem has occurred. Then the error may grow to 99.9% with a computation failure message. So ideally the error should be at most -15% and better to have -5%. The mass error must be very low, error value from (0-1) is better. Mass of the beam will not change.
Mass Error:
The difference between the accurate measured mass and the expected or calculated exact mass. The term “mass errors” refers to the set of errors arising from individual mass measurements.
TYPES OF ENERGY:
INTERNAL ENERGY:
An energy form inherent in every system is the internal energy, which arises from the molecular state of motion of matter. The symbol U is used for the internal energy and the unit of measurement is the joules (J).
Internal energy U of a system or a body with well-defined boundaries is the total of the kinetic energy due to the motion of molecules and the potential energy associated with the vibrational motion and electric energy of atoms within molecules. Internal energy also includes the energy in all the chemical bonds. From a microscopic point of view, the internal energy may be found in many different forms. For any material or repulsion between the individual molecules.
KINETIC ENERGY:
The kinetic energy of an object is the energy that it possesses due to its motion. It is defined as the work needed to accelerate a body of a given mass from rest to its stated velocity. Having gained this energy during its acceleration, the body maintains this kinetic energy unless its speed changes.
HOURGLASS DEFORMATION:
When the elements in a model deform but the strain energy is not computed for that deformation then it results in the Hourglass deformation. Usually, this can be clearly seen in the post-processing stage where the elements will have a zig-zag formation.
Normal Elements:
Elements with Hourglass Effect:
These integration points are the points that are placed on the element to calculate the results from the nodes. Here the results in the elements are integrated using Gaussian Quadrature from the node through the integration points.
There are two types of integrated elements, reduced and fully integrated elements.
In the case of a fully integrated element, the results from nodes 1,2,4 and 5 will be calculated at the integration points respectively. Since there are four integration points the result computed at the element is going to be very accurate but on the other hand, the solver has to solve the result for four points because of this the computational cost is going to be very high.
In the reduced integration element, the solver will calculate the nodal result only at one point, and thus it is computationally inexpensive. In this case, there are two disadvantages first being the inaccuracy and the second, being the Hourglass Deformation. The reason for the hourglass deformation to take place only in the reduced element is because of the less integration point.
CONTACT ENERGY:
When friction is included in a contact definition, positive contact is to be expected. Friction should result in positive contact energy. In the absence of friction, you would hope to see small net contact energy (net = sum of slave side energy and master side energy).
VON MISES STRESS:
Von Mises stress is a value used to determine if a given material will yield or fracture. It is mostly used for ductile materials, such as metals. The von Mises yield criterion states that if the von Mises stress of a material under load is equal or greater than the yield limit of the same material under simple tension then the material will yield.
When a body, in an initial state of equilibrium or undeformed state, is subjected to a body force or a surface force, the body deforms correspondingly until it reaches a new state of mechanical equilibrium or deformed state. The inner body forces are the result of a force field such as gravity, while the surface forces are forces applied on the body through contact with other bodies.
The relations between external forces — which characterize what is called the stress — and the deformation of the body, which characterizes strain, are called Stress-Strain relations. These relations represent properties of the material that compose the body and are also known as constitutive equations.
PROCEDURE:
STUDY-1: (WITH BASE SIMULATION)
Step-1
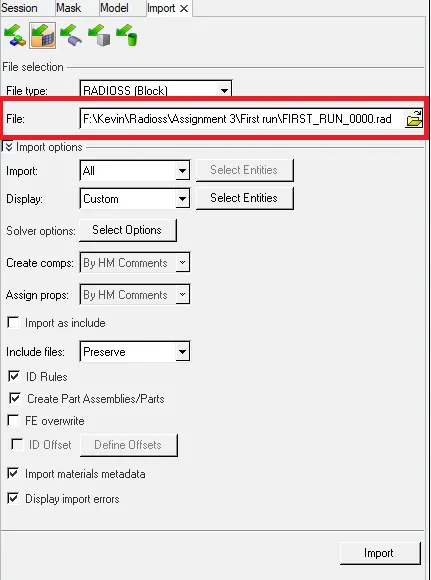
First, we want to import the crash beam file by using the import option and select the file that we want to import the data of file name as FIRST_RUN_0000.rad that is referred to as an input file of the simulation and click import. Now the file is imported and the import selection process and import file dialog box is shown below,
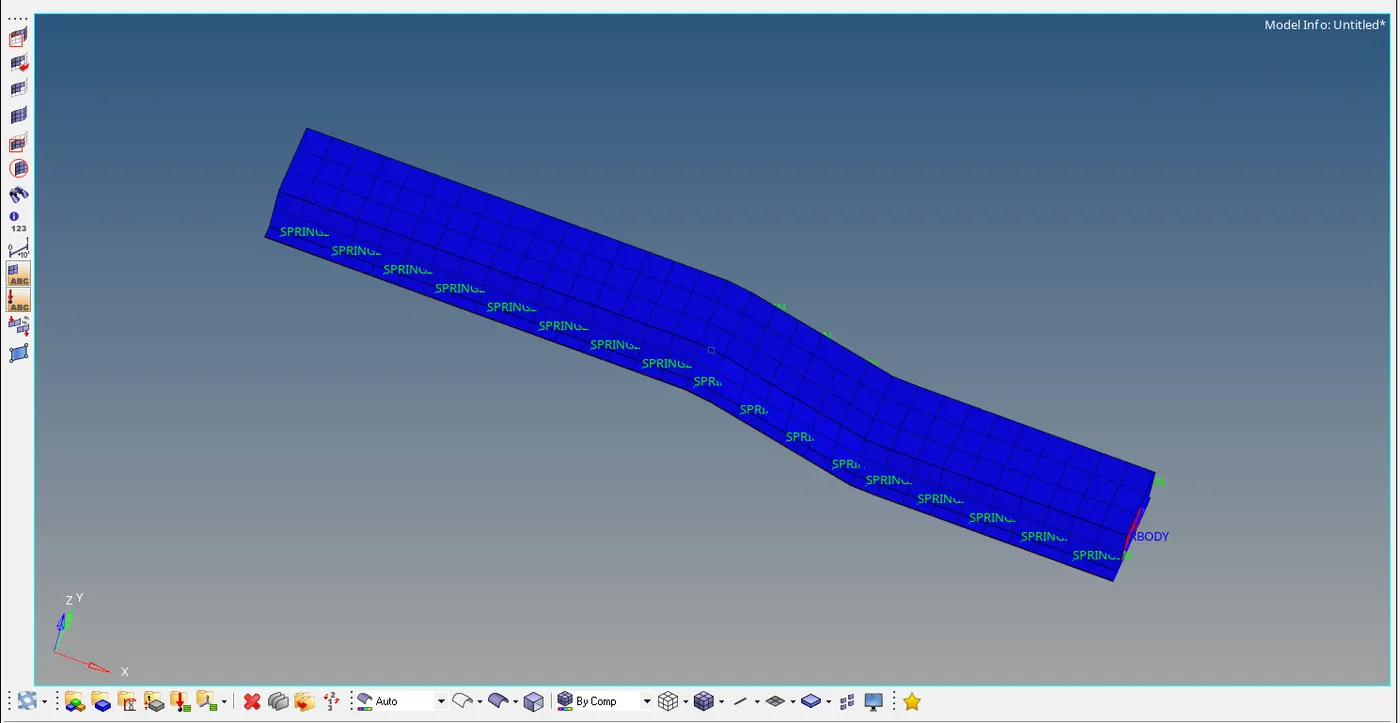
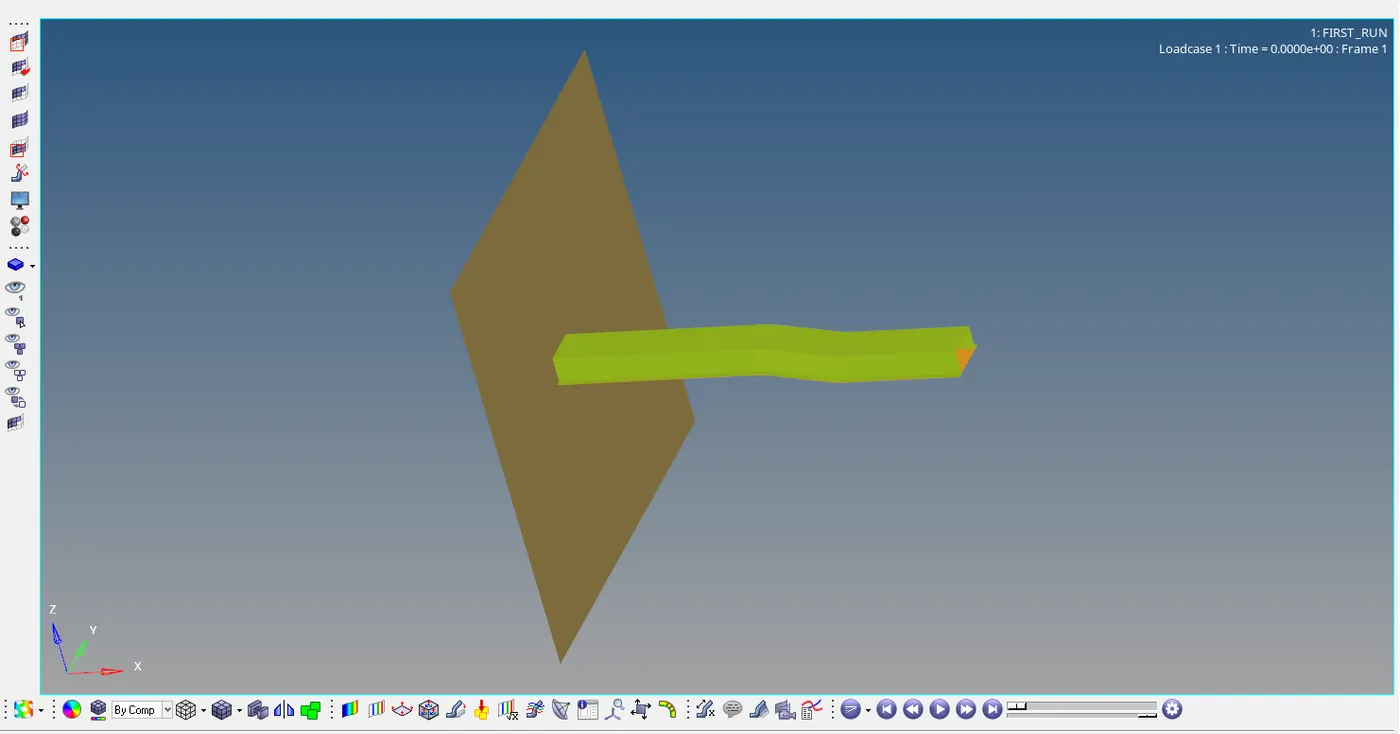
After importing that crash beam file a model will open and that model is shown below,
Step-2
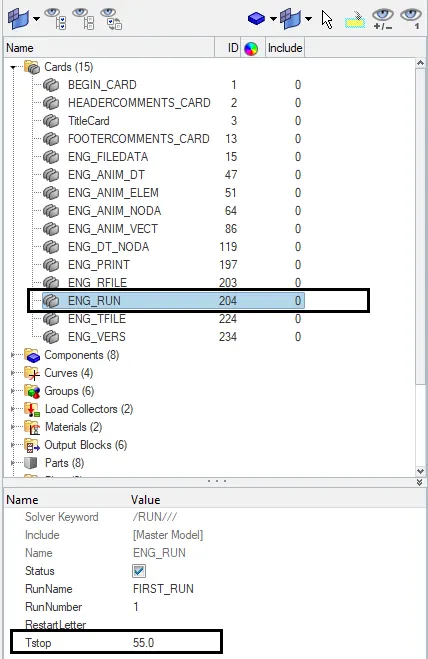
Now we want to change the total runtime value to 55 by selecting the model>cards>and click ENG_RUN card> and change the Tstop value as 55 that selection process image is shown below,
Step-3
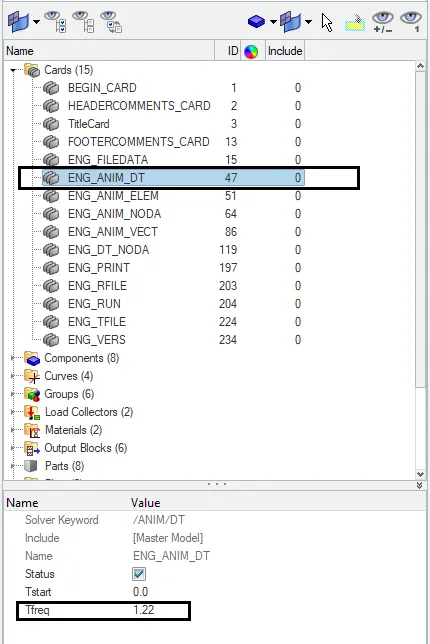
Then we want to initiate the animation steps during the simulation. Assume the animation step value as 45 it may be any number from the range of a minimum of 25 and maximum of 60. To find the animation step value for each time divide the total time by the no. of animation steps we will obtain the time for 1 step animation. No. of animation step files = runtime / time-frequency
Therefore no. of time value for single step animation = Total time /Animation steps = 55/45 = 1.22
Hence that value is entered in the ENG_ANIM_DT card>Tfreq = 1.22 that image is shown below,
Step-4
After completing the run time and the no. of animation steps run the simulation by selecting the Tool>radioss>select the input file>and click radioss option to run the simulation that dialog box is shown as below,
To increase the speed of simulation we can type with a command ie, -nt 4
Here “nt” means the number of threads (ie, means 4 CPU for solving the problem)

Step-5
Now the result is obtained in the respective given folder, open the folder, and analysis the errors like energy error and mass error. These errors are shown in the Engine Out file that is shown below,

Fig: Energy error and Mass error
Here the result shows the two errors energy error as -10.3.% because Hourglass Energy is artificially created and mass error as 0.1659E_03%. An energy error should be in -5% is considered as better for simulation.
Note: After the simulation, if we look at the folder in which we saved the solved file, there we can see the following files
In Engine Part
- There will be a .out file (ASCII format) - It is an Engine listing file
- Here runnameA01 file (Binary format) & .H3D File (Binary file) - It is an Animation file at a certain set or a specific region of simulation but whereas the .H3D will give you the entire simulation of the problem in a single file.
- Here runnameT01 file (Binary format) - It's a Time History file.
- At last, we get an .rst file (Binary format) - This is a restarting file.
In Stater Part
- There will be a .out file (ASCII format) - It is a Stater listing file
- At last, we get an .rst file (Binary format) - This is a restarting file.
Step-6
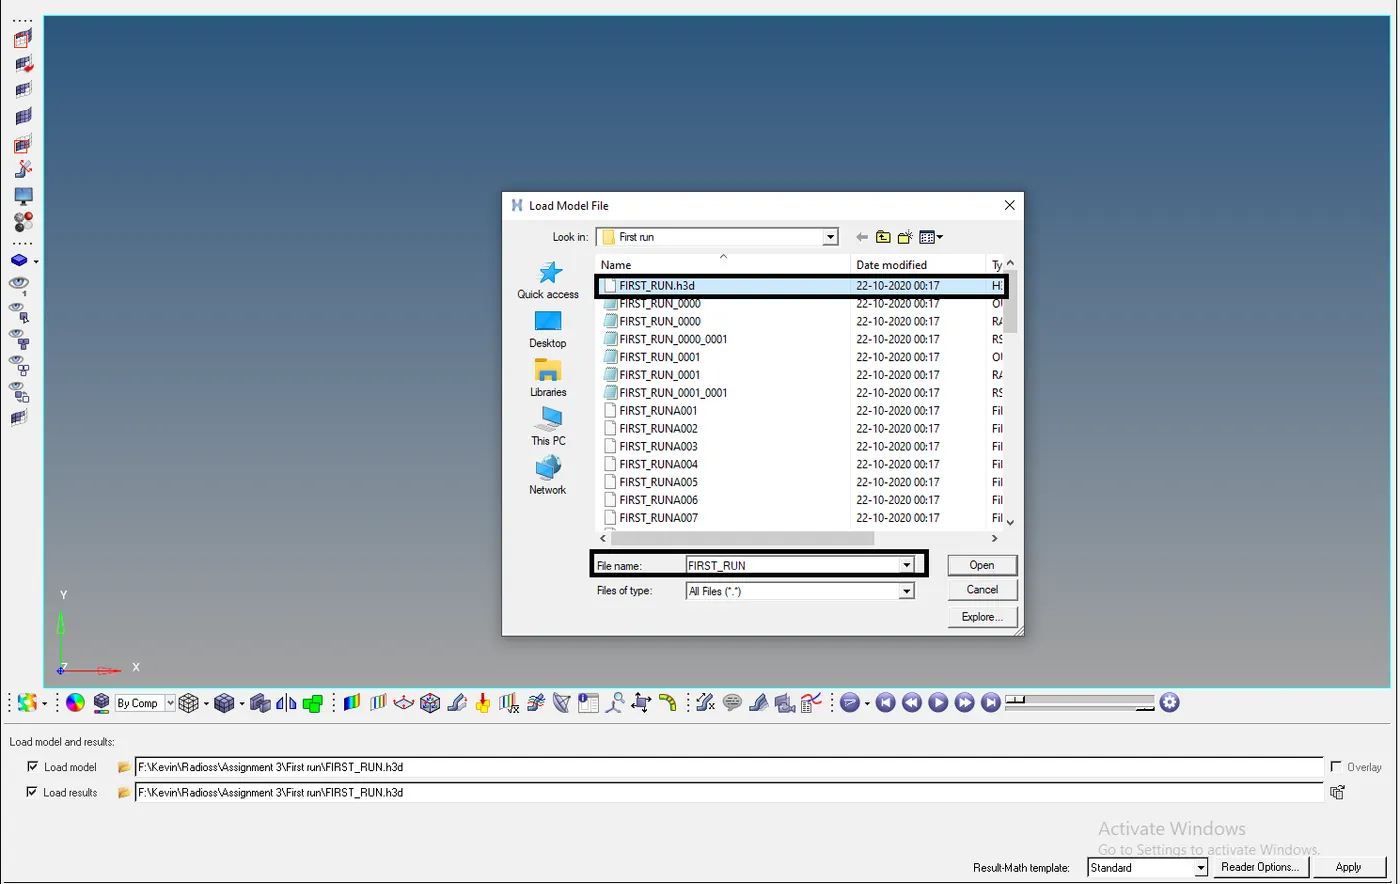
Now open the hyper view and load FIRST_RUN.h3d model file and select the apply option to open that model in hyper view that dialog box is shown below,
Therefore the model is opened and now to change the result type as Von Mises(s) to get the Von Mises Stress Contour Plot select the components and edit the averaging method as simple and click apply to get the animation of the crashed beam on a rigid wall. That is shown below,

Step-7
Von Mises Stress Contour Plot :
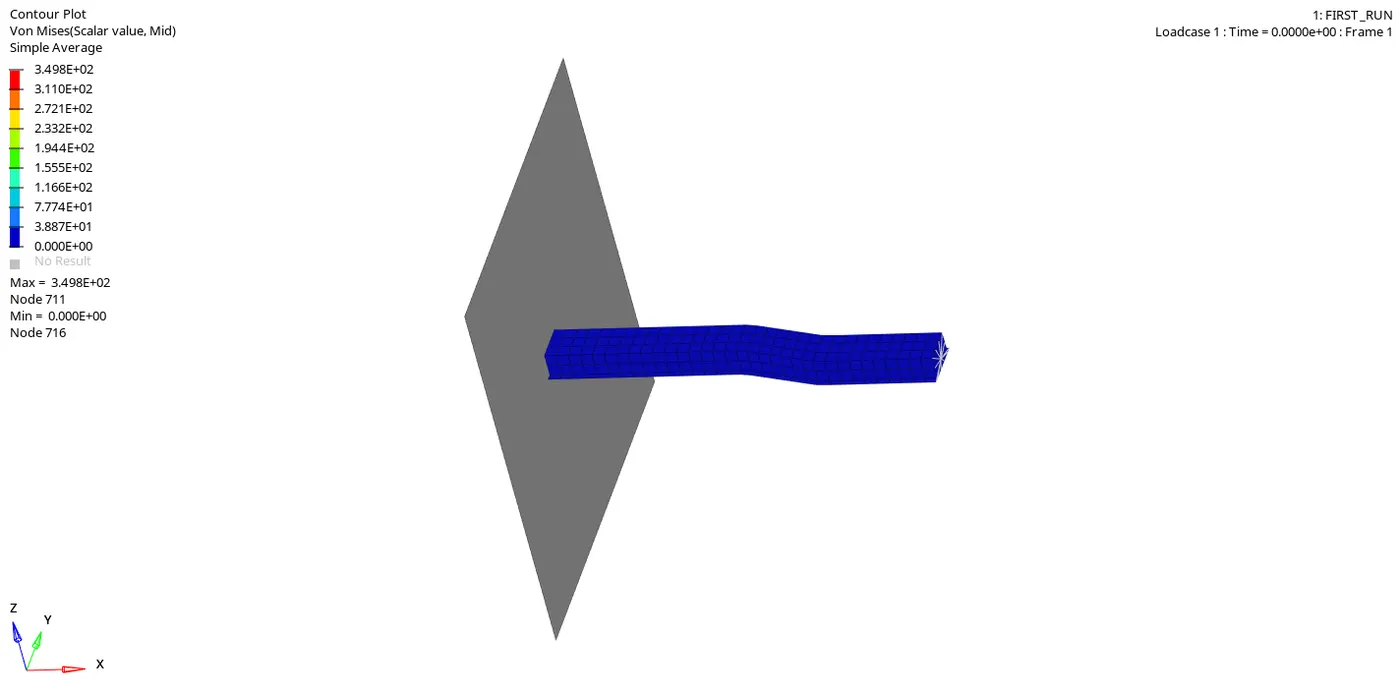
Fig: Vonmises stress Contour Plot
Now the contour plot is generated click the mesh icon to visualize the deformation of elements in each node. Here if you see in the plot contour above is Von Mises stress, here the component going to crash with time as we run our simulation. It shows a different range of colors as stress increases on the component. Von Mises stress is a value used to determine if a given material will yield or fracture. It is mostly used for ductile materials, such as metals. Von Mises stress is computed and compared to the yield stress material. If the von mises is smaller than the yield stress the computed stress is the one used in order to compute the internal force of the element
Step-8
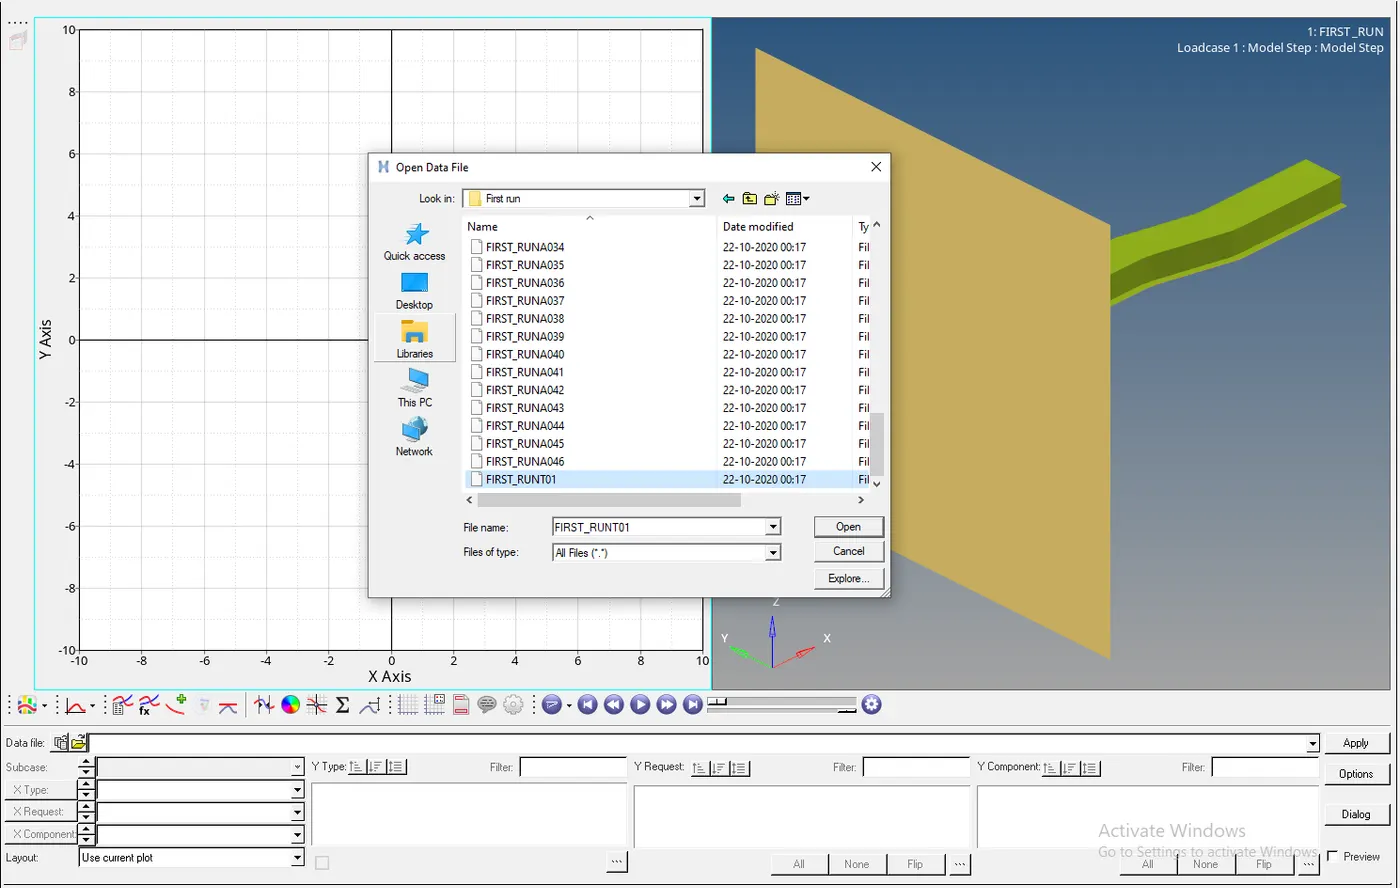
To create the plot for each energy and absorbs that what was happening during the crash and how could the element gets deforming while applying some force. Now select hyperchart option that will give the empty graph as a display. Import the file FIRST_RUNT01 and click the apply option. That dialog box is shown below,
Then we want to plot the graph for the energy that is mentioned in the question they are Plot rigid wall forces, internal energy, hourglass energy, contact energy, and total energy. That plot is proceeding for each energy by select the options and click apply to obtain the energy plot for each condition. Selection of the plot for each energy dialog box is given below,

Step-9:
Total Plot:
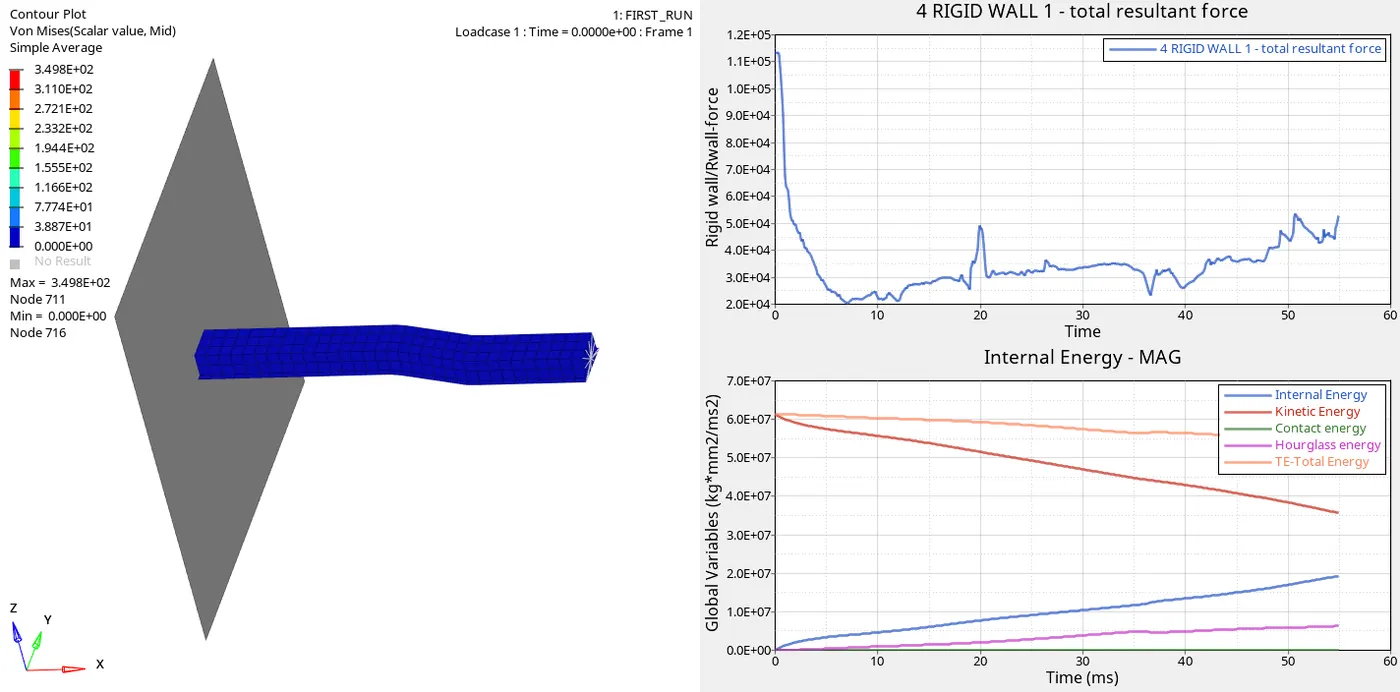
Here below plot shows that all the energy graph is obtained. The resultant plots show the rigid wall force is getting raised in the starting stage because when the beam is crashed on the wall on that stage force acting on the body is high and the value shows that increase in the force of (1.1E+05 kN) and then the force is decreased. This is because stress acting on the element that will vary either it will increase or decrease.
In plot 3 shows that the internal energy is raised because of the drop-down in kinetic energy. When the beam is crashed in that rigid wall that case kinetic energy will decrease due to a reduction in displacement whereas internal energy is created in that case. Therefore a decrease in kinetic energy will give the result in a rise in internal energy.
In plot 4 shows that hourglass energy is produced and it getting raised because of the deformation in the elements.
The total energy = sum of all energy by equating the kinetic energy and internal energy should give the plot a straight line but here the total energy is varied because of the presence of hourglass energy.
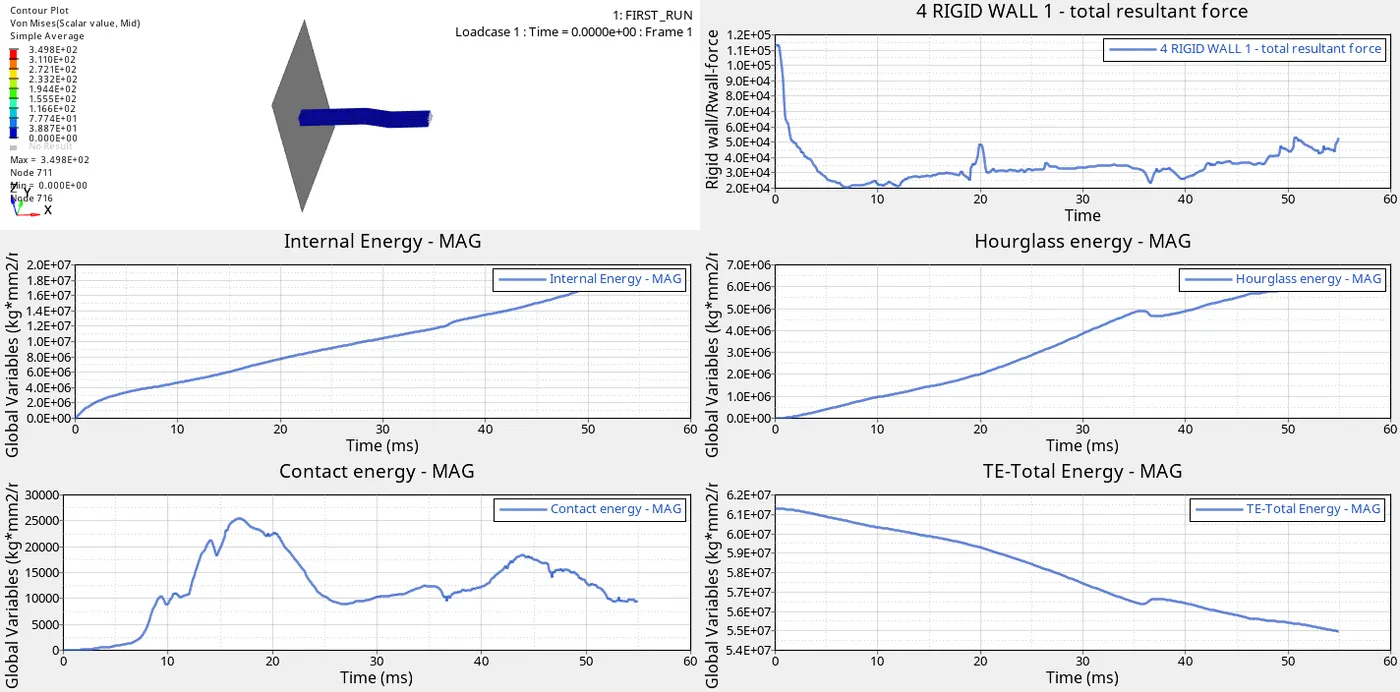
Fig: Plot for Study 1 (Internal energy, Hourglass energy, contact energy, total energy vs time)
When the Kinetic Energy decrease, Internal Energy starts to increases through the system (from 6.0E+07 to 3.5E+07kg⋅mm2ms2">kg⋅mm2ms2kg⋅mm2ms2). due to changes in its internal state.
We Know that Total Energy is the sum of all energy. Whenever Kinetic energy decrease will lead to an Internal Energy increase therefore total energy should be stable. But in this case, the total Energy Plot shows decreasing(below 6.0E+07 kg⋅mm2ms2">kg⋅mm2ms2kg⋅mm2ms2) due to the reduced integration element method is used. In the reduced integration element, the solver will calculate the nodal result only at one point, and thus it is computationally inexpensive. In this case, there are two disadvantages first being the inaccuracy and the second, being the Hourglass Deformation.
The reason for the hourglass deformation to take place only in the reduced element is because of the less integration point. When the elements in a model deform but the strain energy is not computed for that deformation then it results in the Hourglass deformation. Due to Hourglass Deformation, Hourglass Energy is artificially created(from 0.0E+00 to 0.6E+07 kg⋅mm2ms2">kg⋅mm2ms2kg⋅mm2ms2). So that Total Energy is not Stable.
Fix for the Hourglass deformation:
There are a few fixes for this hourglass deformation,
- Stiffness can be added to the reduced integration element at the material level where this hourglass is occurring. In most of the solvers, this is done automatically provided you have activated the card.
- A damping force can be added at the deformation, depending upon the deformation the force will be computed. This can be done for the problem with high velocity eg, blast simulations. This can also be done by activating the respective card form the solver.
- By using the fully integrated elements this Hourglass deformation can be avoided.
- Mesh refinement will also help in avoiding this Hourglass deformation. Coarse mesh along with less integration point is more prone to Hourglass deformation.
The total energy plot is given below,
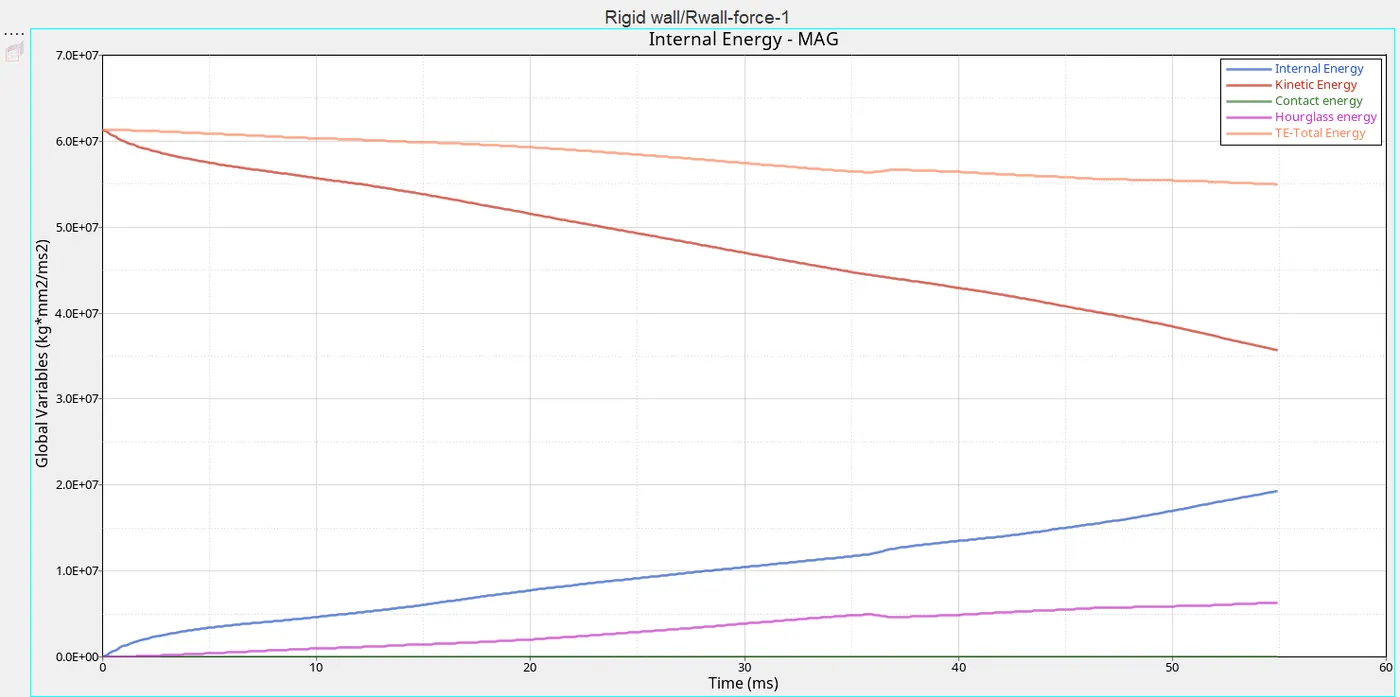
Fig: Total Energy Plot
The graphical observation of study-1 result is shown as below,
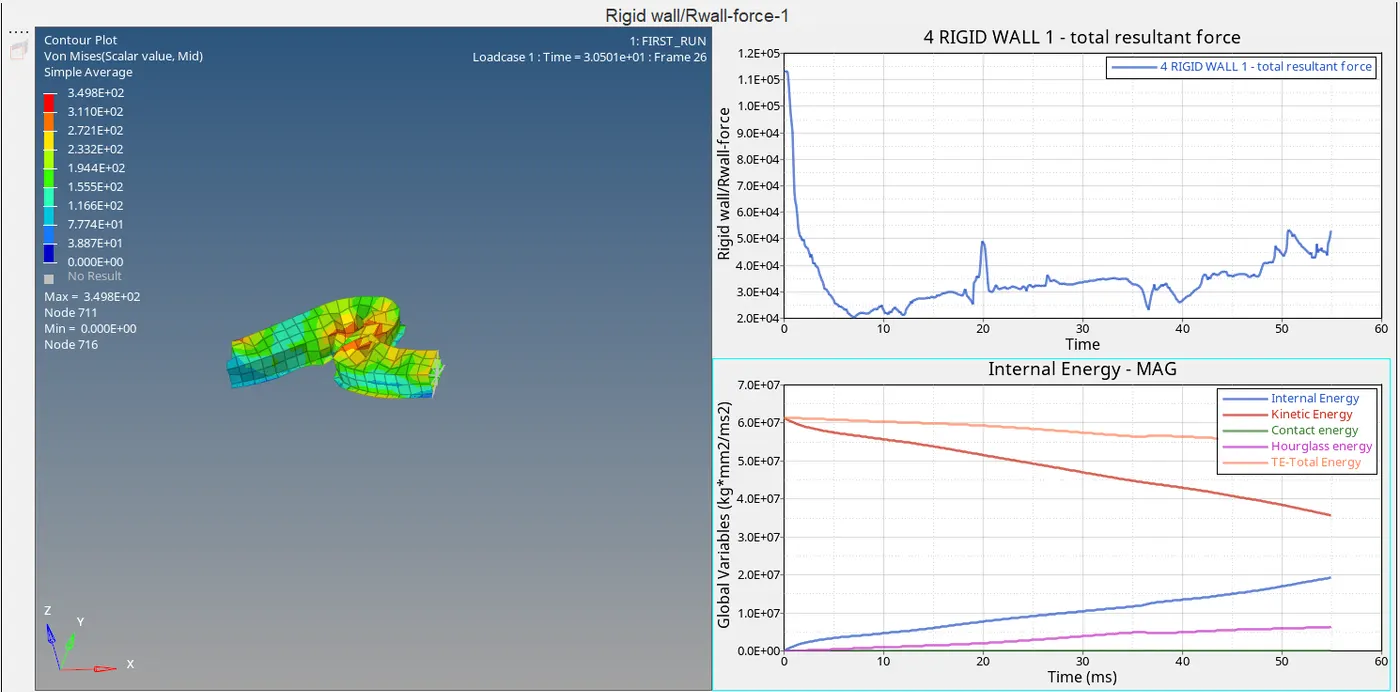
Fig: Study-1 Result
STUDY-2: (IMPROVED SHELL ELEMENT PROPERTIES)
Steps Followed
1. We want to import the crash beam file by using the import option and select the file that we want to import the data of file name as FIRST_RUN_0000.rad that is referred to as an input file of the simulation and click import option. A file will be imported and will be displayed in as same as study-1.
2. After imported the beam file Now we want to change the total runtime value to 55 by selecting the model>cards>and click ENG_RUN card> and change the Tstop value to 55. And Tfreq value as 1.22 that calculations are mentioned in the study-1 itself the same procedure will be followed here.
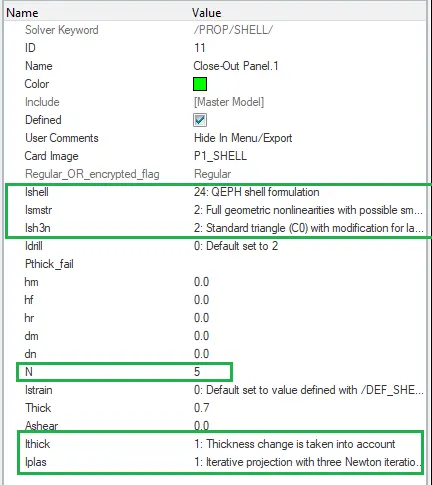
3. In study-2 change the shell element properties as per the given recommended properties. By selecting the properties>Hat section>and change the properties and solver configuration that are shown below,
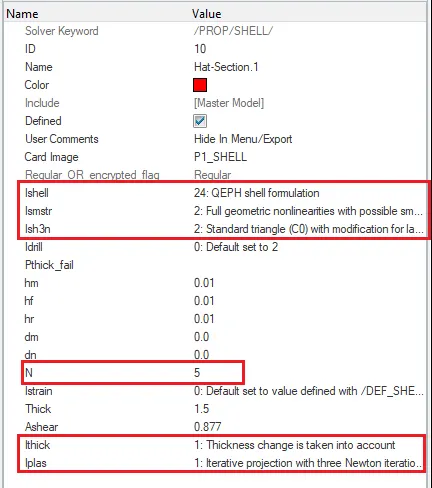
4. After changing the properties and edited the run time and the no. of animation steps run the simulation by selecting the Tool>radioss>select the input file>and click radioss option to run the simulation that dialog box is shown as below,
To increase the speed of simulation we can type with a command ie, -nt 4
Here “nt” means the number of threads (ie, means 4 CPU for solving the problem)
5. Therefore the simulation is completed now open the Engine Out file from the saved folder, and check the energy error and mass error. That Engine out file is shown as below,

6. Here the result shows the two errors, energy error as -0.1.% since there is no hourglass energy and the computation is much more accurate. and mass error as 0.1659E_03%. An energy error should be in -5% is considered as better for simulation.
7. Now open the hyper view and load FIRST_RUN.h3d model file and select the apply option to open that model in hyper view.
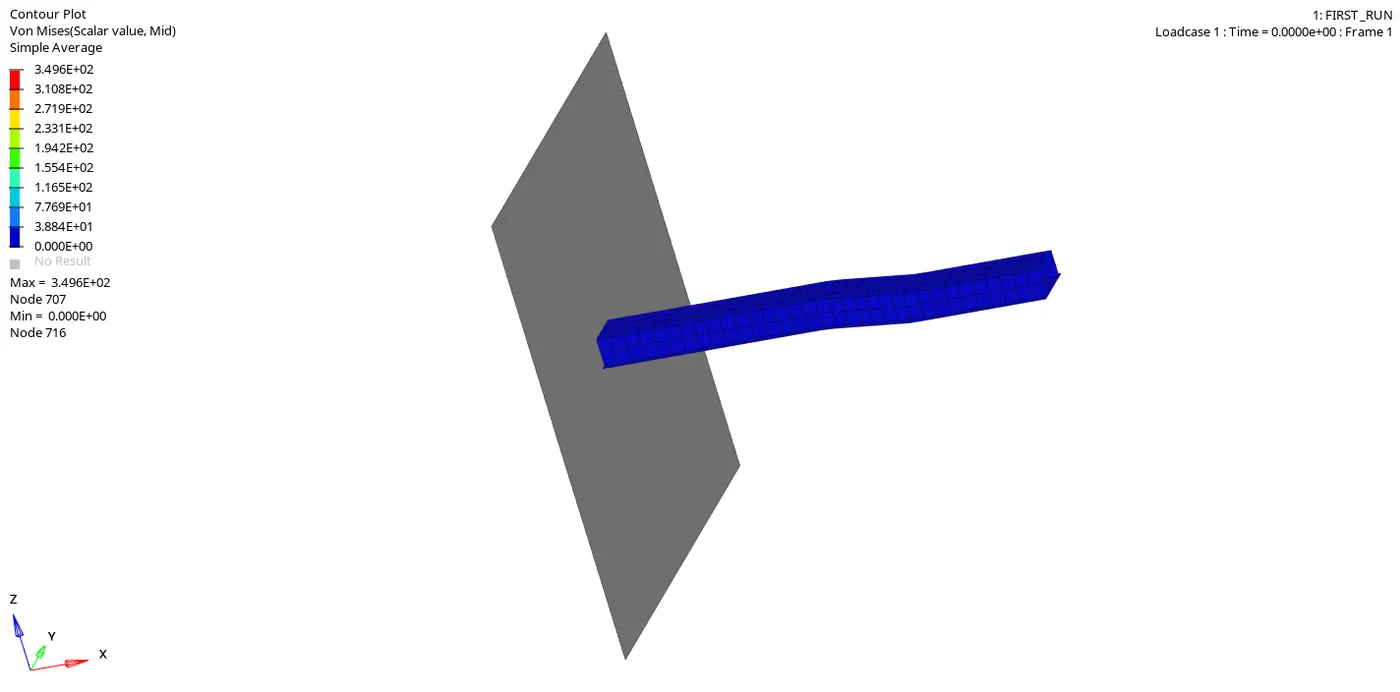
8. Therefore the model will be opened on hyper view and now to change the result type as Von Mises(s) to get the Von Mises Stress Contour Plot select the components and edit the averaging method as simple and click apply to get the animation of the crashed beam on a rigid wall. Here the Von Mises Stress Contour Plot is shown below,
8. To create the plot for each energy and absorbs that what was happening during the crash and how could the element gets deforming while applying some force. Now select hyperchart option that will give the empty graph as a display. Import the file FIRST_RUNT01 and click the apply option.
9.Then we want to plot the graph for the energy that is mention in the question they are Plot rigid wall forces, internal energy, hourglass energy, contact energy, and total energy. That plot is proceeding for each energy by select the options and click apply to obtain the energy plot for each condition.
Step-10
Total Plot:
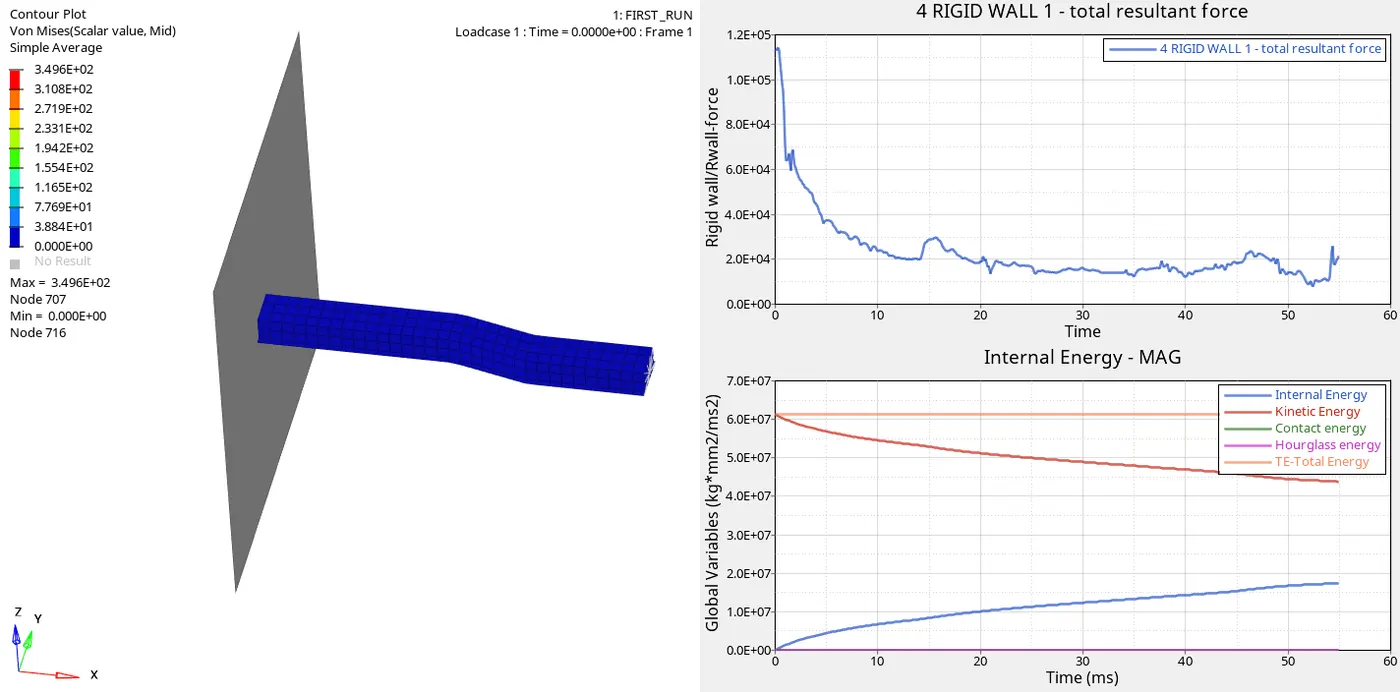
Here below plot shows that all the energy graph is obtained. The resultant plots show the rigid wall force is getting raised in the starting stage because when the beam is crashed on the wall on that stage force acting on the body is high and the value shows that increase in the force of (1.1E+05 kN) and then the force is decreased. This is because stress acting on the element that will vary either it will increase or decrease.
In plot 3 shows that the internal energy is raised because of the drop-down in kinetic energy. When the beam is crashed in that rigid wall that case kinetic energy will decrease due to a reduction in displacement whereas internal energy is created in that case. Therefore a decrease in kinetic energy will give the result in a rise in internal energy.
In plot 4 shows that hourglass energy is 0 because of change in the properties lead to executing the solver as fully integrated.
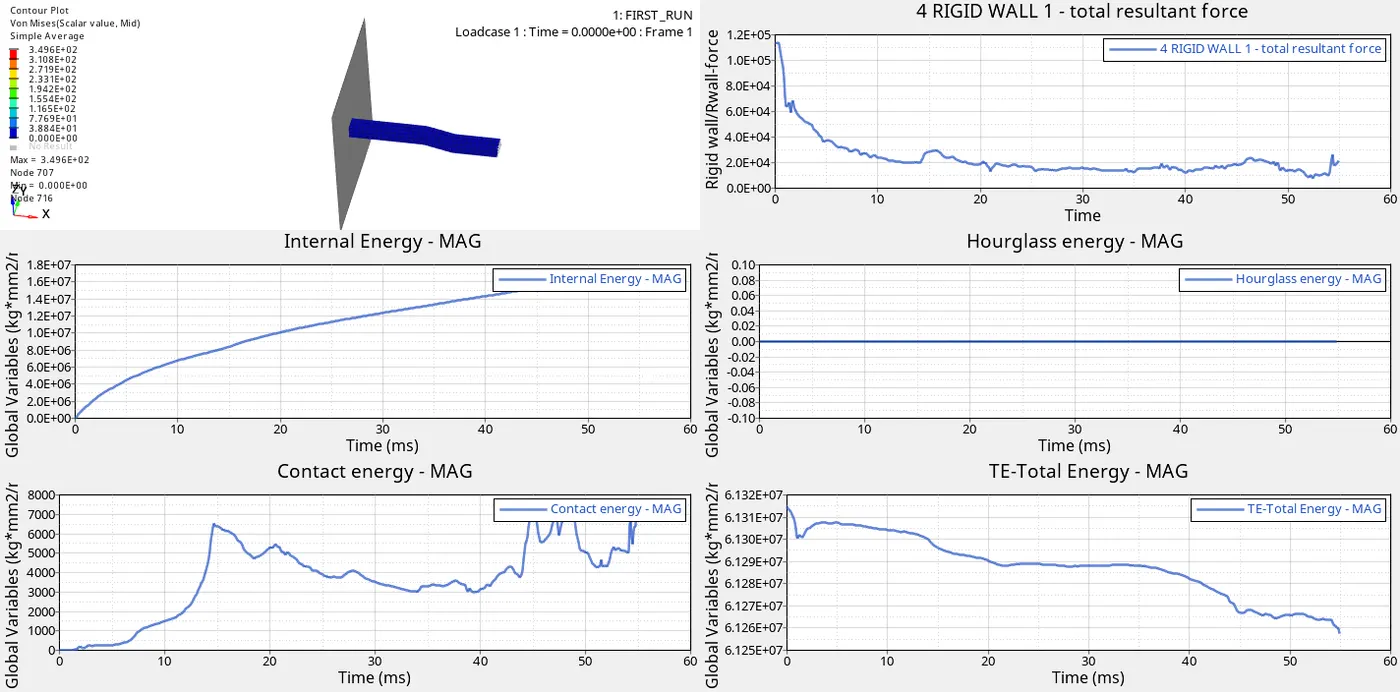
Fig: Plot for Study-2 (Internal energy, Hourglass energy, contact energy, total energy vs time)
The total energy plot given below shows that when the Kinetic Energy decrease, Internal Energy starts to increases through the system (from 0.0E+00 to 1.8E+07 kg⋅mm2ms2">kg⋅mm2ms2kg⋅mm2ms2) due to changes in its internal state.
We Know that Total Energy is the sum of all energy. Whenever Kinetic energy decrease will lead to an Internal Energy increase therefore total energy should be stable. In this case Total Energy Plot shows stable (at 6.0E+07 kg⋅mm2ms2">kg⋅mm2ms2kg⋅mm2ms2).
There is no Hourglass Deformation occurs in this case, Because Shell element Properties has been improved by changing Ishell as QEPH. In QEPH Parameter Physical stabilization method is used to fix for the Hourglass Deformation. The physical Stabilization method is adding stiffness to the reduced integration element at the material level where this hourglass is occurring. So there is no Hourglass Energy (0.0E+00 kg⋅mm2ms2">kg⋅mm2ms2kg⋅mm2ms2) .
Fig: QEPH Shell Property
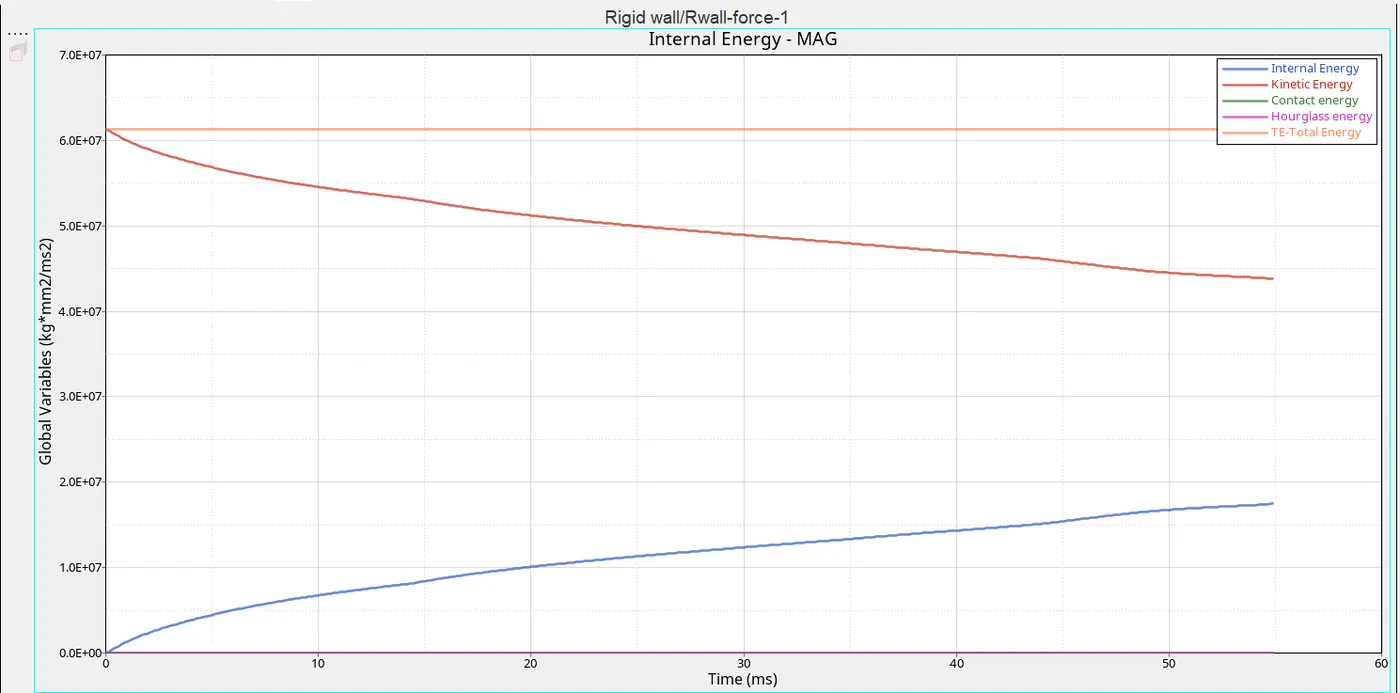
Fig: Total Energy Plot
The graphical observation of study-2 result is shown as below,
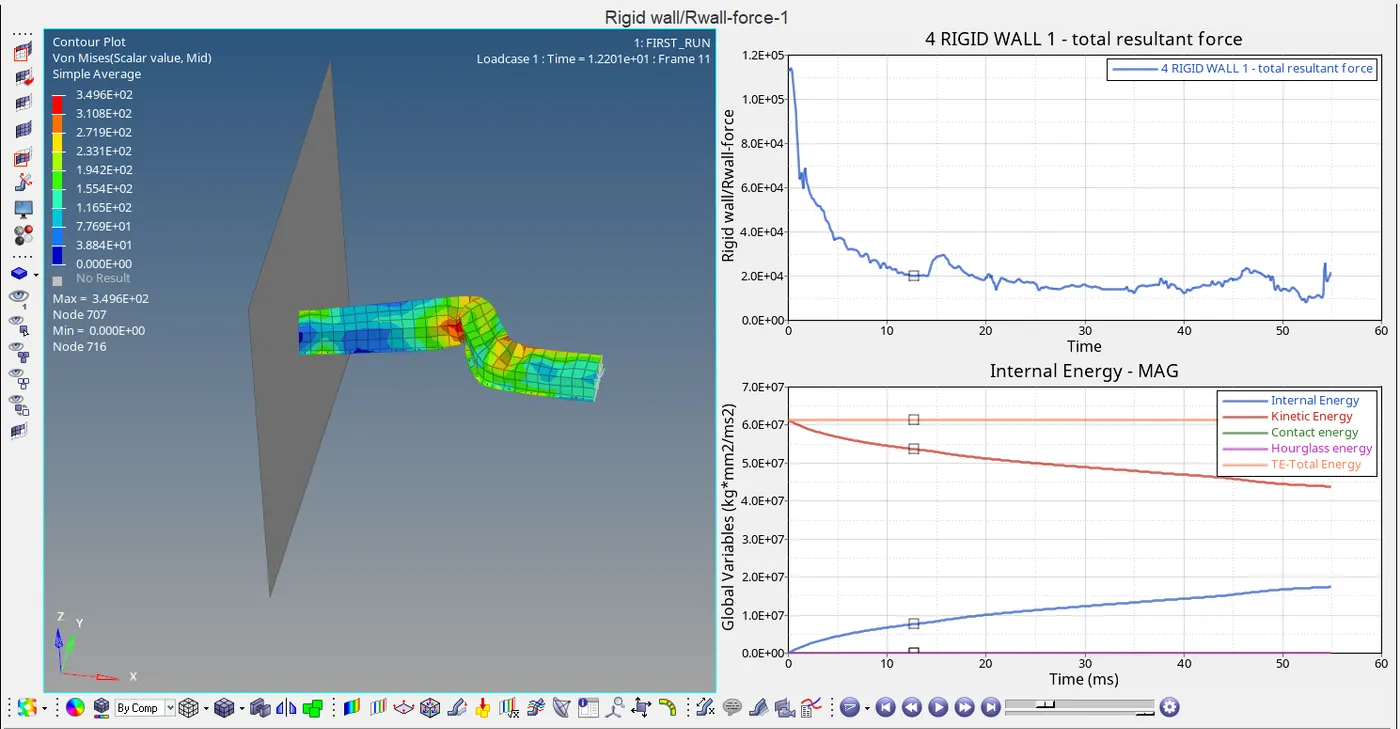
Fig: Study-2 Result
COMPARISON OF STUDY-1(WITH BASE SIMULATION) AND STUDY-2 (IMPROVED SHELL ELEMENT PROPERTIES):
Kinetic Energy: By comparing these two studies In the case of Study-2, since to overcome hourglass generated initially here we are adding stiffness, so we can see the slow decrease in the value of Kinetic Energy with time compared to the Study-2 there the hourglass energy is controlled at the material level itself.
Internal Energy: It keeps on increasing in both the study as kinetic energy decreases as we know total energy should be too constant so the internal energy increases. In study-2 it increases a little faster as the elements having more stiffness.
Hourglass Energy: It is zero energy deformation mode where elements are seen to being deformed but there is no energy recorded for particular deformation. Hourglass energy is artificial energy, it's an energy which is actually a loss of both energy. For Study 1, it keeps on increasing but it always below from internal energy But for Study 2, it equals zero it doesn't increase with time. It's because the Hourglass energy is treated at the material level itself and opposes the only velocity of nodes but not the force that is why when force is introduced, we add some stiffness (young modulus, yield stress), and that stiffness going to control hourglass energy. Here we are changing shell properties Ishell as QEPH. In QEPH Parameter Physical stabilization method is used to fix for the Hourglass Deformation. The physical Stabilization method is adding stiffness to the reduced integration element at the material level where this hourglass is occurring. So in the study-2, there is no hourglass is created.
Contact Energy: It is nearly equal to zero value throughout the study since this simulation is carried out between the plastic behavior body and the rigid body and so the contact force is also nearly zero and this plot is not considered in our study.
Total Energy: While observing these two studies in study-1, it decreases with time and in study-2 it's constant throughout. This is because in study-1 we know Energy dissipation is more due to the hourglass effect and it keeps on giving negative values and in simulation 2nd it doesn't decrease. Hence in the graph, we can see clearly the total energy.
CONCLUSION:
Hence the crash animation of a rigid wall with the beam is executed and the results are studied. Study-2 also analyzed by changing shell properties Ishell as QEPH and results are observed.
All the energy plots are obtained during the simulation for both case1 and case2. In Study-2 the hourglass energy remains zero due to changes in shell properties and thus total energy is stable in that study.
Therefore results are observed and animations are executed.