Combustion Analysis
Question :
Part I
Perform a combustion simulation on the combustor model and plot the variation of the mass fraction of the different species’ in the simulation using line probes at different locations of the combustor. You need to plot for CO2, H2O, CH4, N2, O2, NOx emissions & Soot formation.
Part II
As you must have observed from the above simulation, the Nox and soot is getting formed at the outlet of the combustor. Such formation has harmful effects on the environment and humans. The stringent government norms also demand the least formation of Nox and soot and to satisfy those requirements, you need to check the effect of adding the water in the fuel.
In this part, you need to add the water content in the fuel from 5% to 30% by mole and observe the effect of it on the results. It is necessary to provide line plots and contours to prove your claim.
You can use the parametric study approach if required.
Note:-
1. Use methane-air-2step as a mixture material than methane-air. [It allows to add water in the fuel or air]
2. Use a one-step soot model to calculate the soot formation.
Answer :
We are going to simulate the Combuster for 2 Cases
- PART I : Fuel without water content.
- PART II : Adding water content in fuel to obtain least emissions.
Simulation Procedure :
Geometry:
- Import the given combuster.
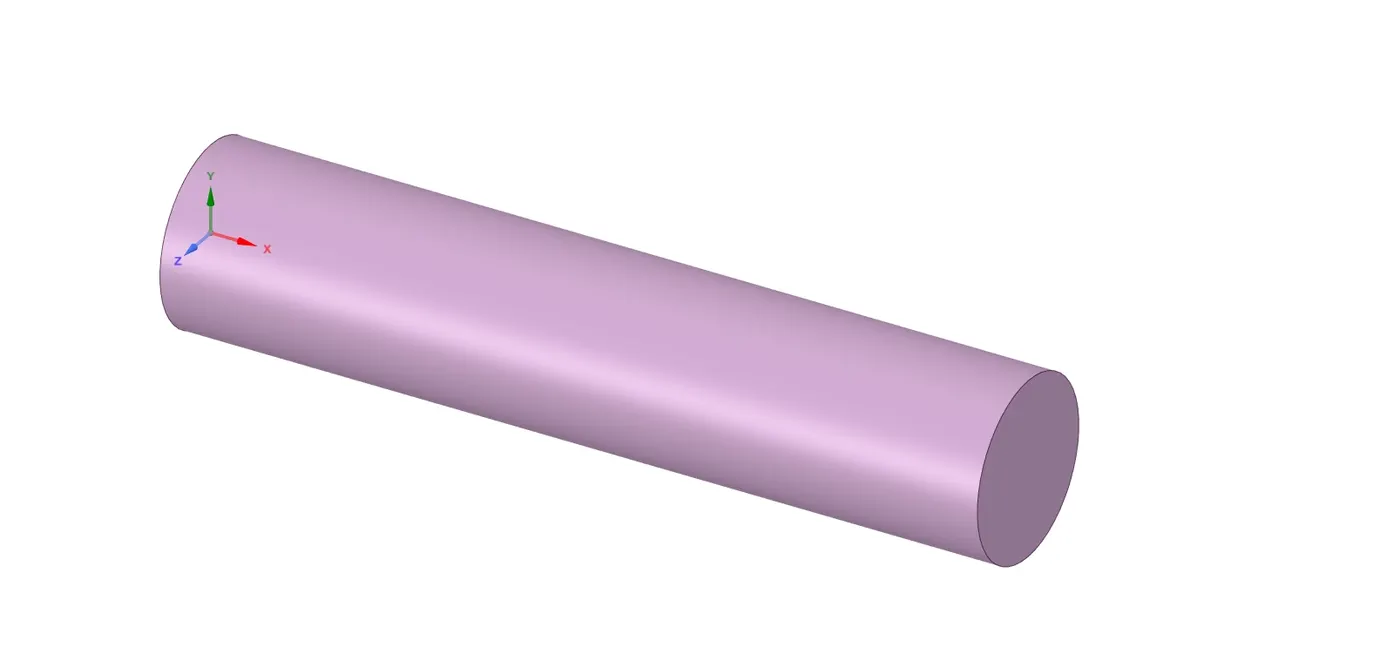
- Combine all the components and split the body to get the desired symmetric plane.
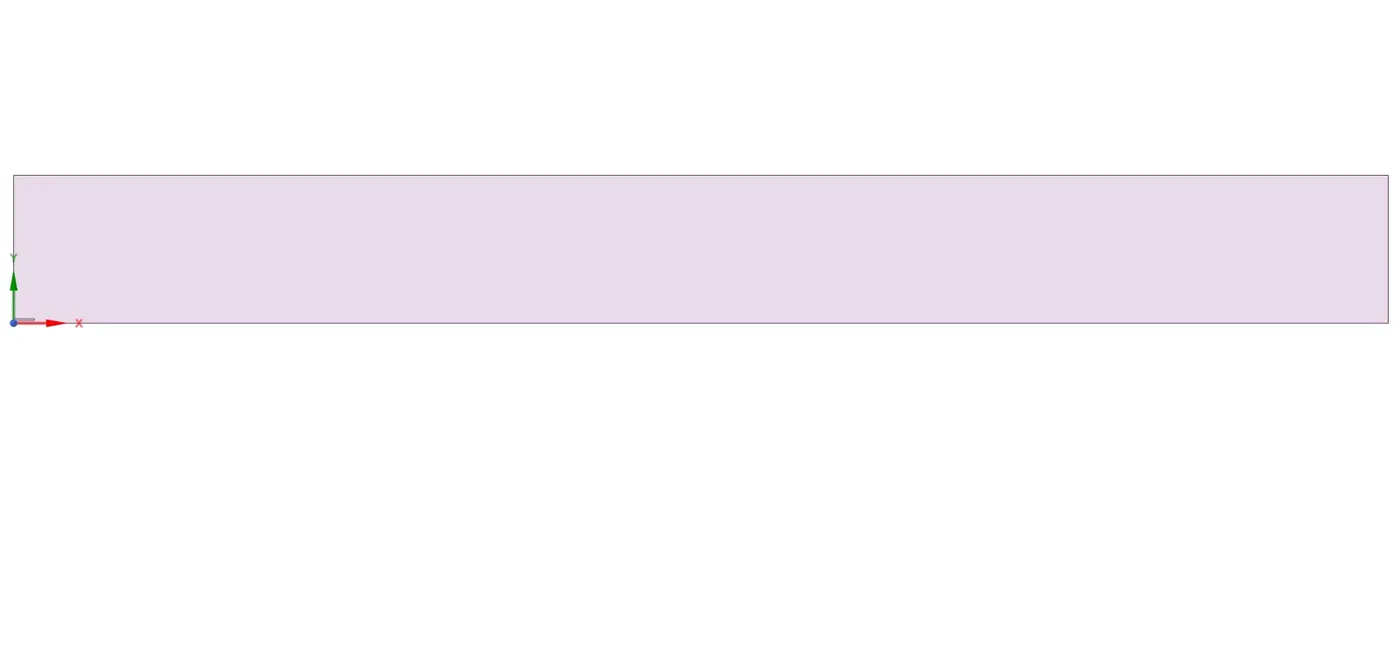
- Copy the plane and create the new design window and save it.
- This completes the geometry section.
Mesh :
- Open the mesh section.
- Add mesh element size(we have used 0.001 m as mesh element size).
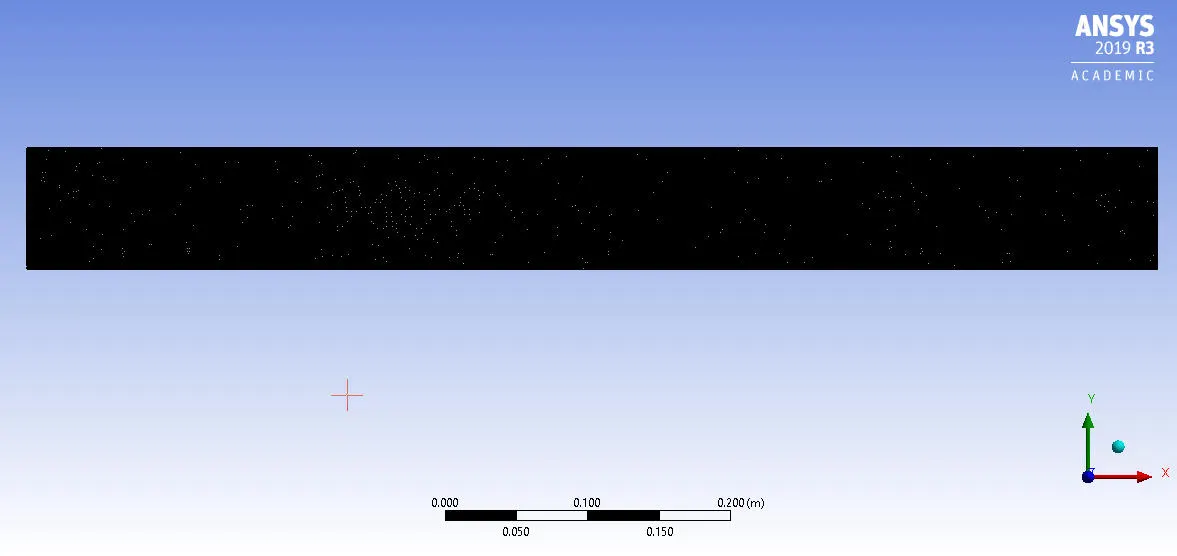
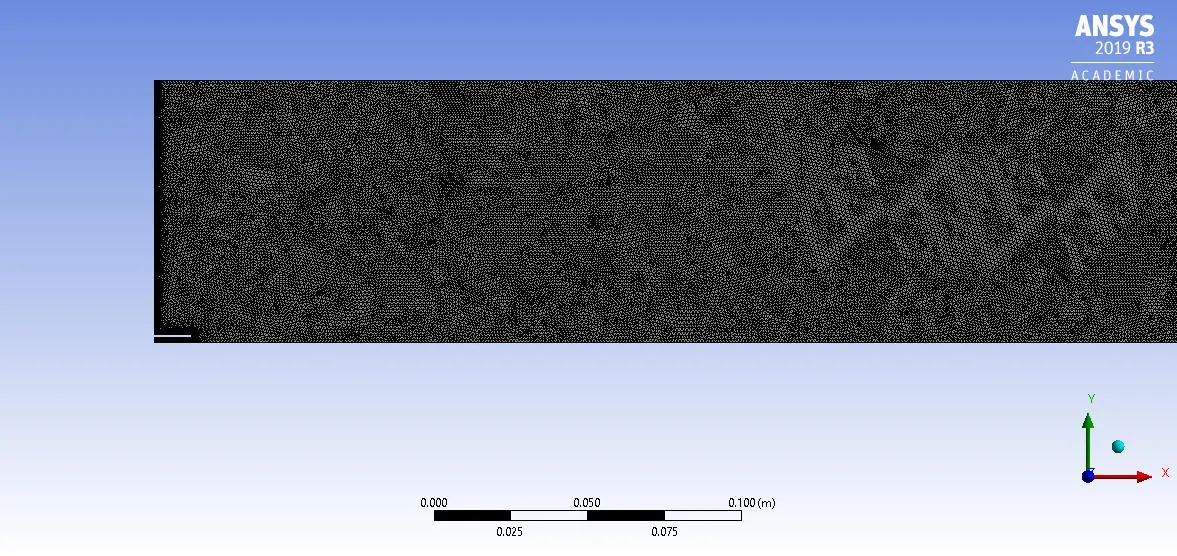
- Add mesh method and select triangular mesh method.
- Add body sizing to all inlet edges and add higher no. of divisions to refine them more.
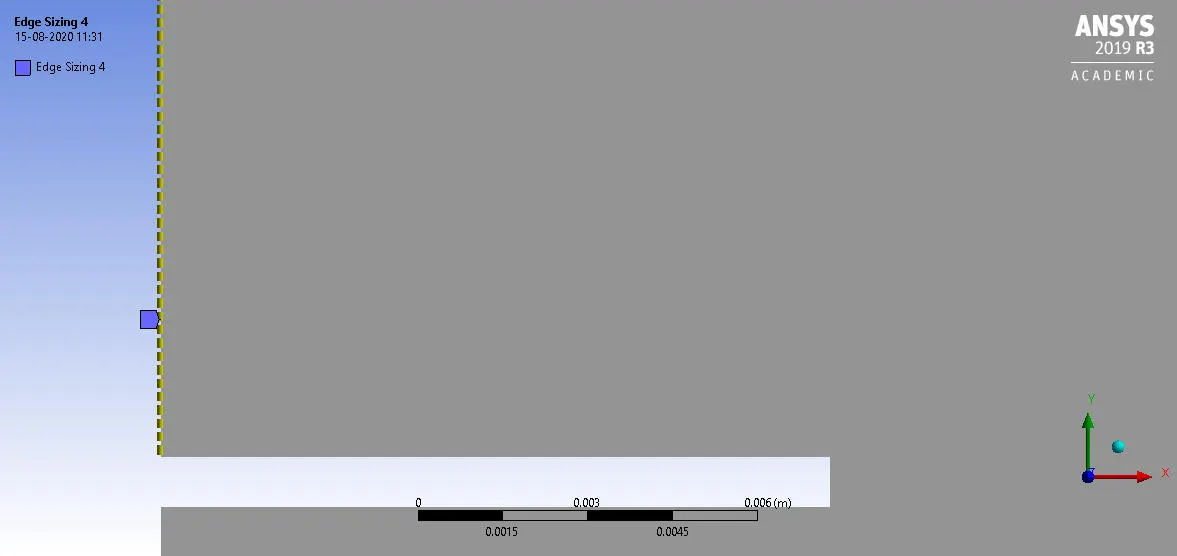
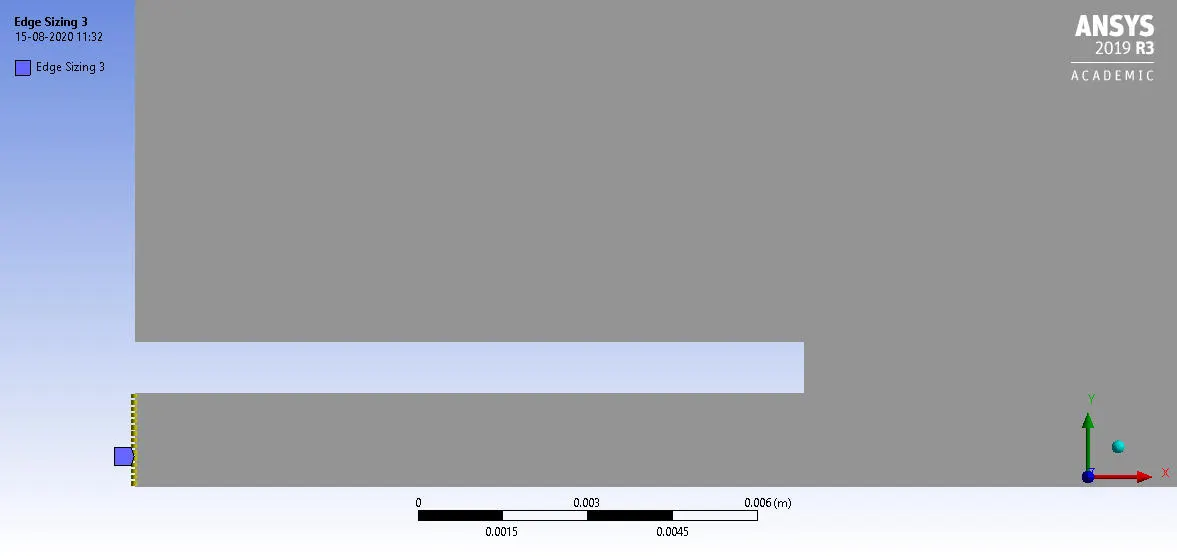
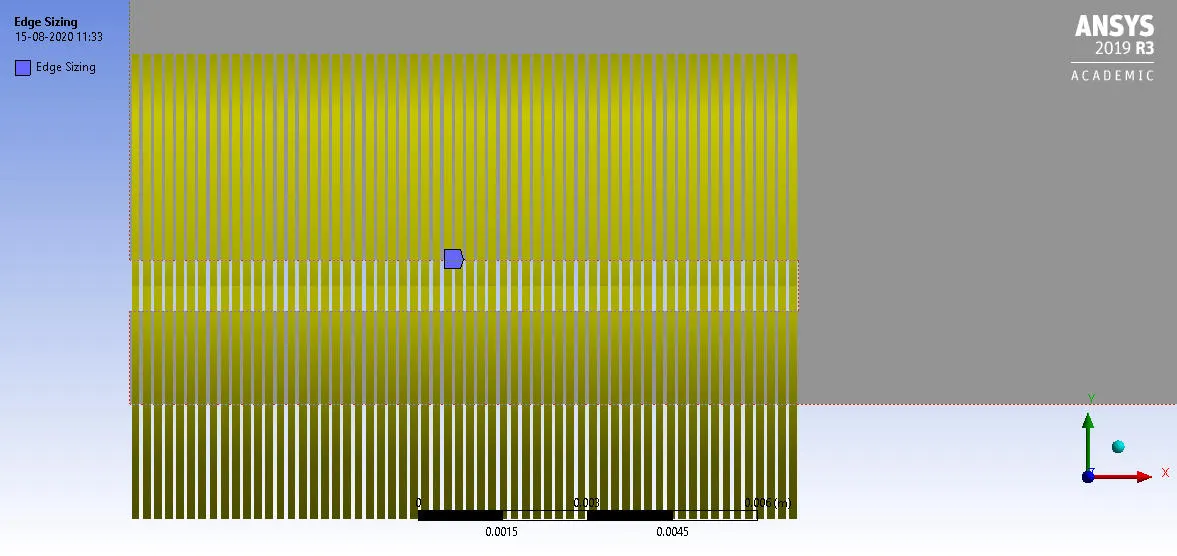
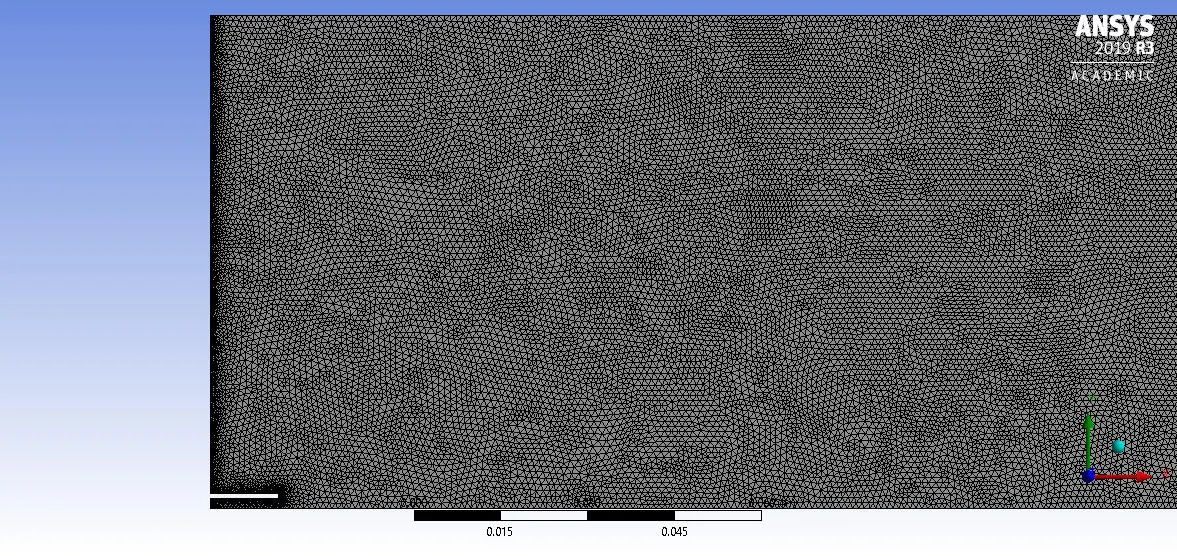
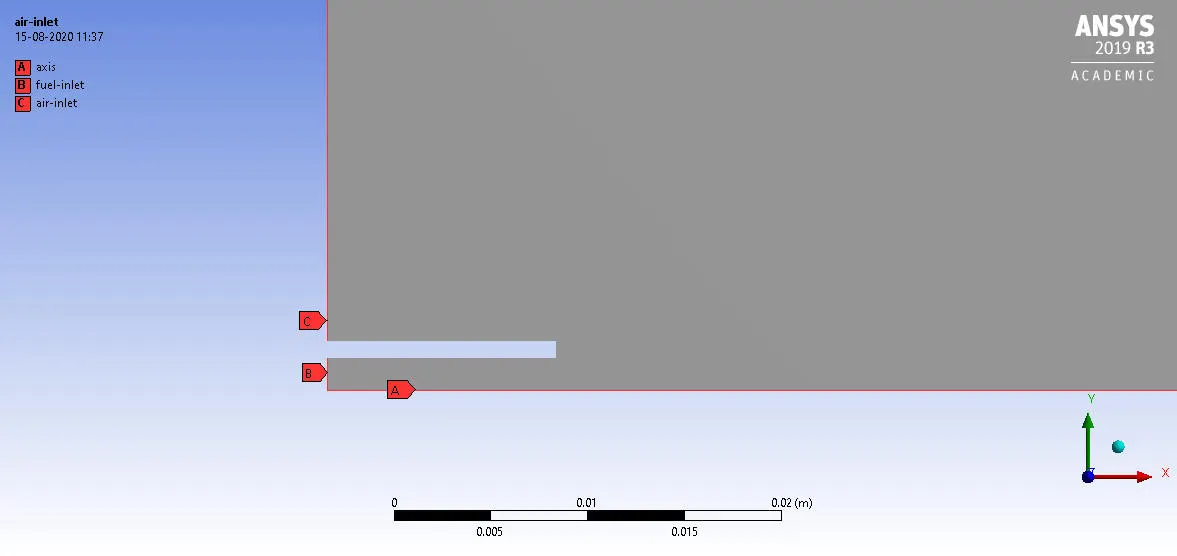
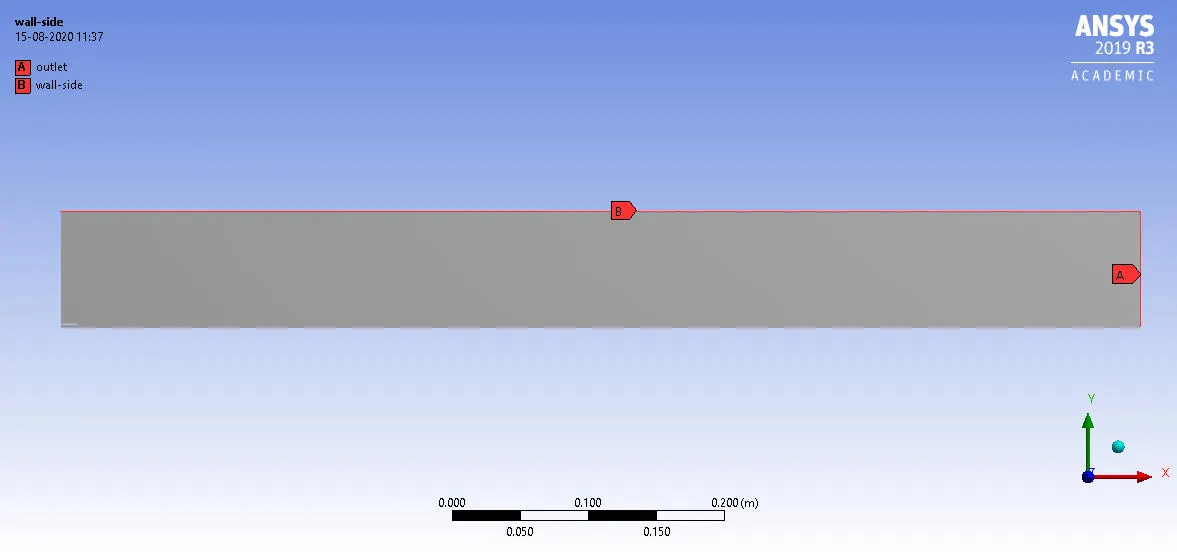
- Name the boundaries as Air inlet, Fuel inlet, axis, side walls, outlet.
Setup :
- Perform mesh check.
- Enable Axisymmetric option in 2D space of general settings.
- Enable the energy model.
- Enable viscous model(we have used k-epsilon standard model).
- Enable the species transport model.
- Enable NOx model, also thermal and prompt NOx pathways.
- Set the boundaries, air inlet and fuel inlet.
- Set the solution method, initialize with hybrid initialization.
- Set the contours and simulate the problem.
Result :
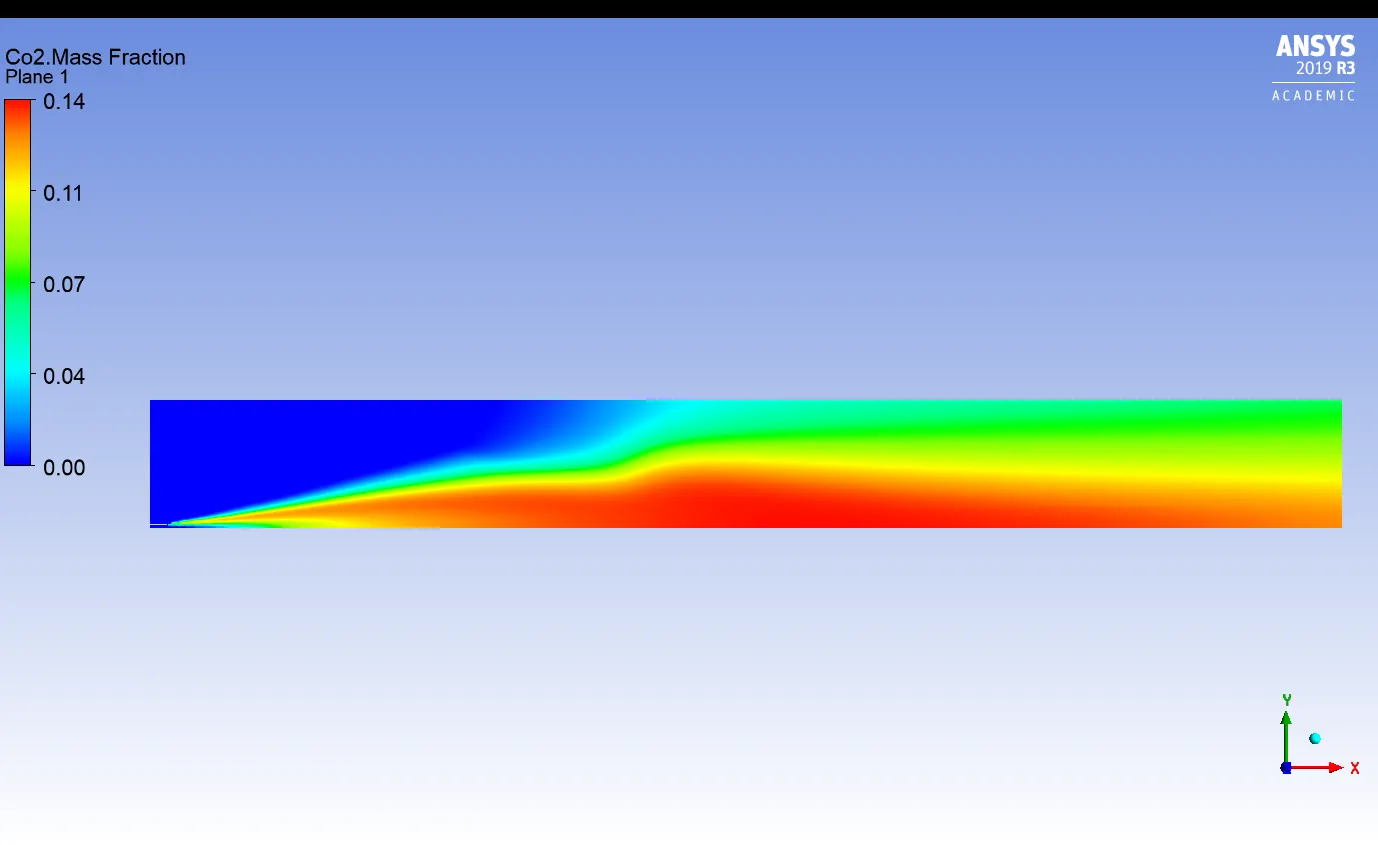
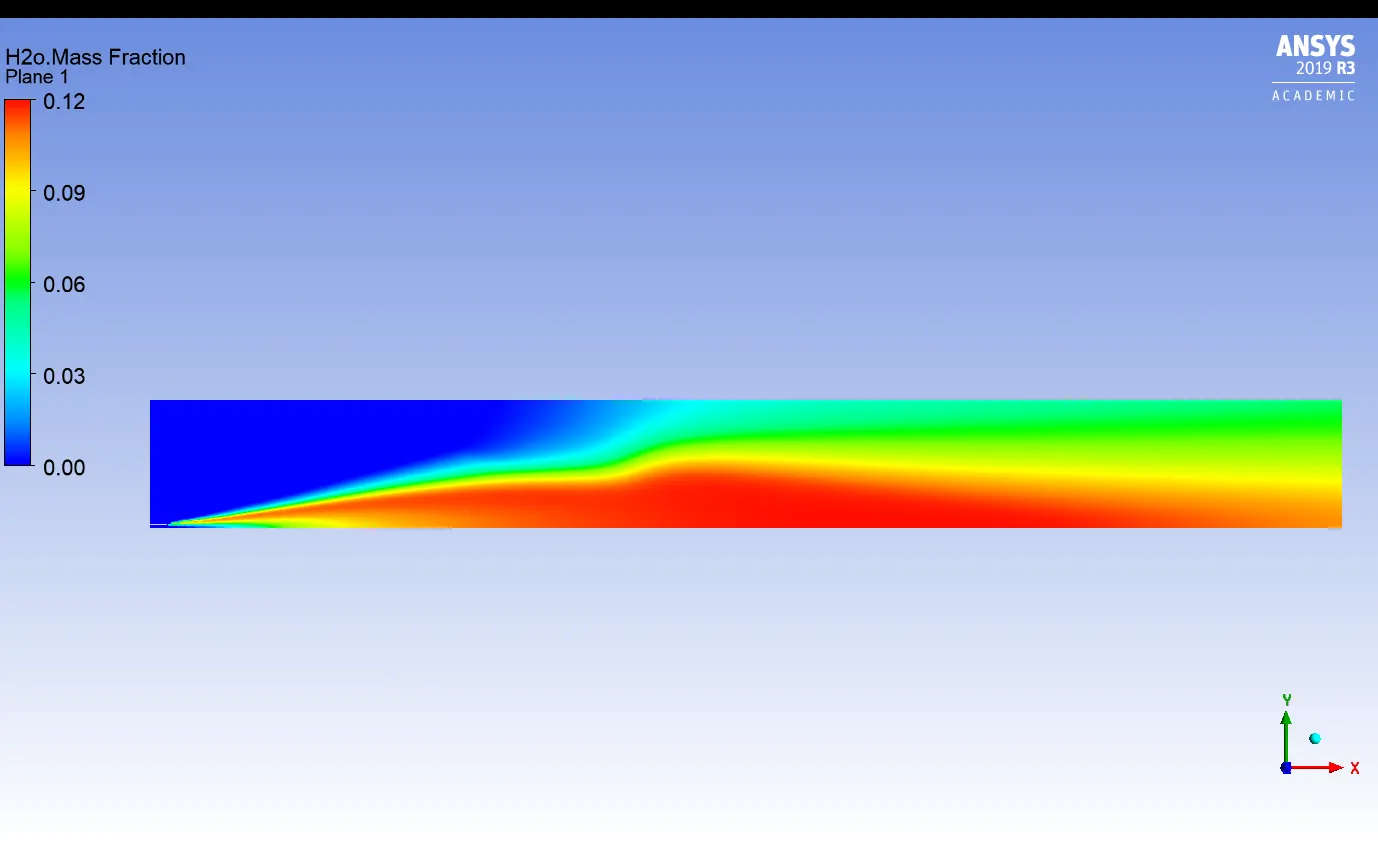
- Create a plane and color it with various variables like species mass fraction, temperature.
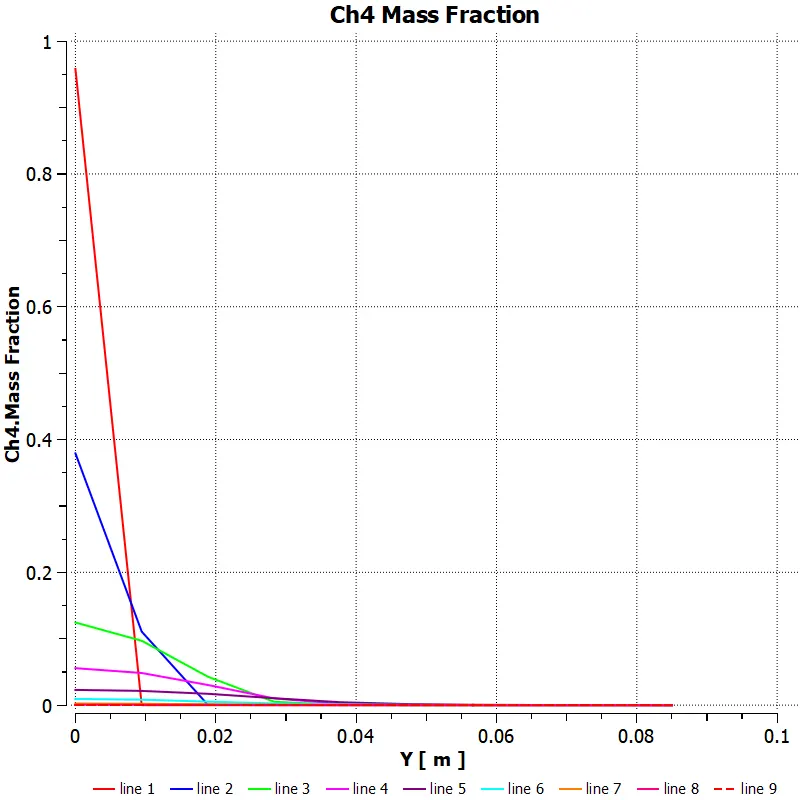
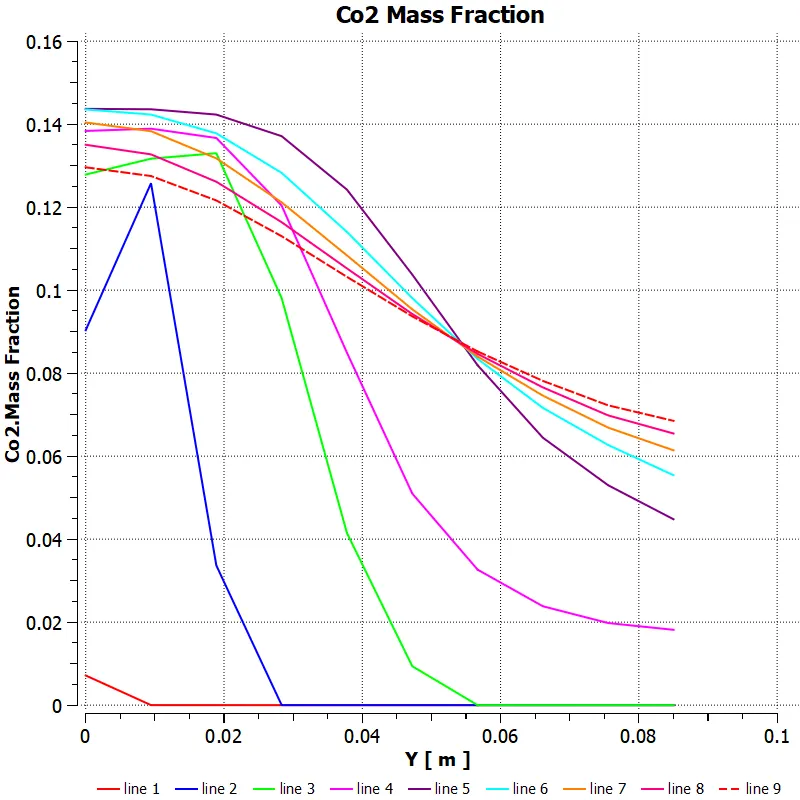
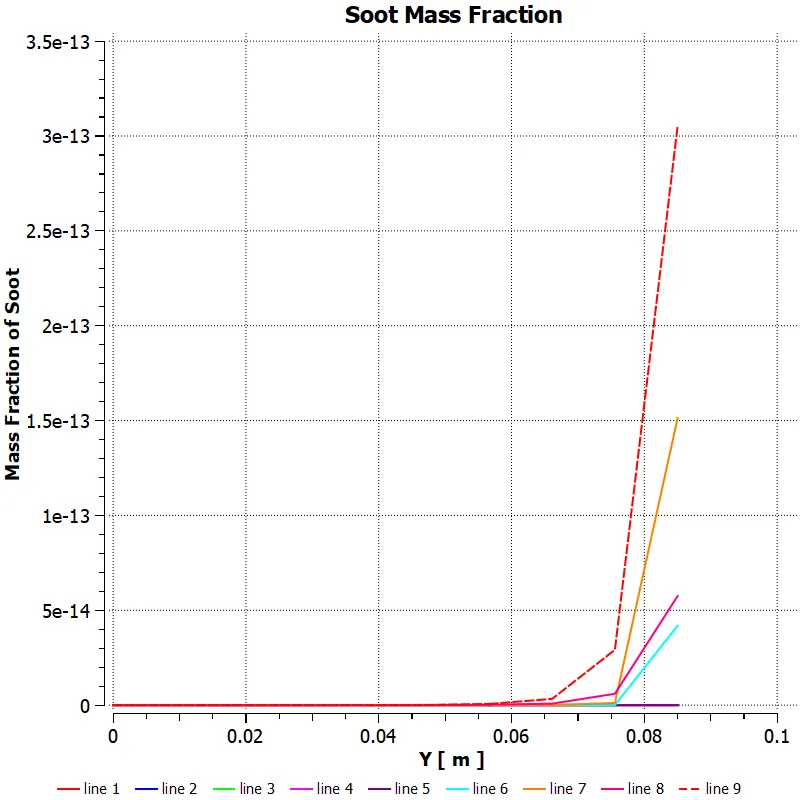
- Create the line contour and analyze the changes in graph.
Parameter :
- Set more no. of DP units and provide different CH4 and H2O percentages for each.
- Select the retain data option and update all the dp points so the solution runs automatically for all Dp points and solves according to the current DP settings.
- Now observe the NOx, Soot, temperature at outlet for all Dp points.
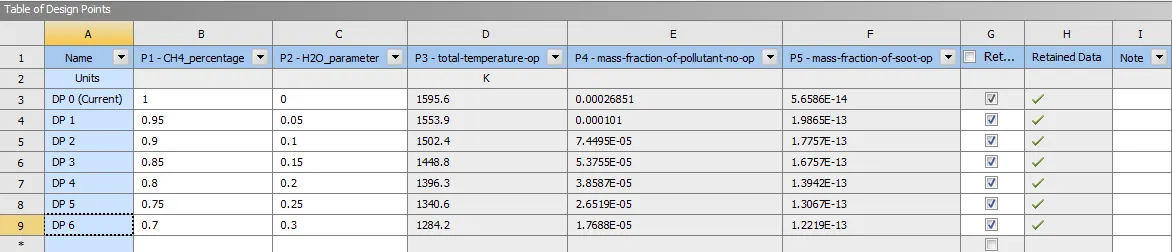
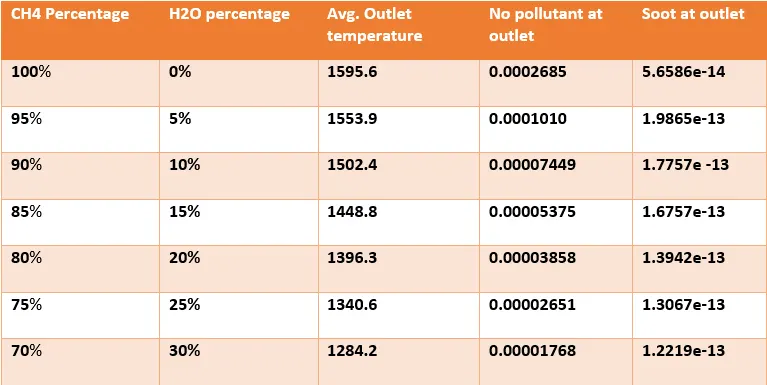
- Below are our simulation results of NOx, Soot, temperature at outlet for all Dp points.
Mesh Inputs :
- Mesh method : triangular
- Body sizing : air inlet edge - 350 no. of divisions.
fuel inlet edge - 15 no. of divisions.
Inner wall edge - 60 no. of divisions.
- Mesh element size : 0.001 m
- Total Elements : 149769
- Nodes : 75976
Setup Inputs :
- Viscous model : K-epsilon (standard).
- Species model : species transport.
- Mixture material : Methane-air-2-step.
- Turbulence chemistry reaction : Eddy Dissipation.
- NOx pathaways : Thermal NOx - It occurs due to oxodation of N2 present in combustion air mainly due to temperature. Higher the temperature of the flame,higher the formation of thermal NOx.
Prompt NOx - Prompt NOx is formed in the earliest stage of combustion. Prompt NOx is made by the reaction of atmospheric nitrogen with radicals in the air.
- Soot model : One-Step soot model.
- Solution method : SIMPLE.
- Initialization method : Hybrid.
Boundaries :
- Air inlet : Velocity - 0.5 m/s.
Species - O2 - 0.23.
Temperature - 300 k.
- Fuel inlet : Velocity - 80 m/s.
Temperature - 300 k.
Species - Part I - CH4(100%) H2O(0%)
Part II - CH4(95 - 70%) H2O(5 - 30%)
Outputs :
############################### { Part I - Fuel without water content } ###############################
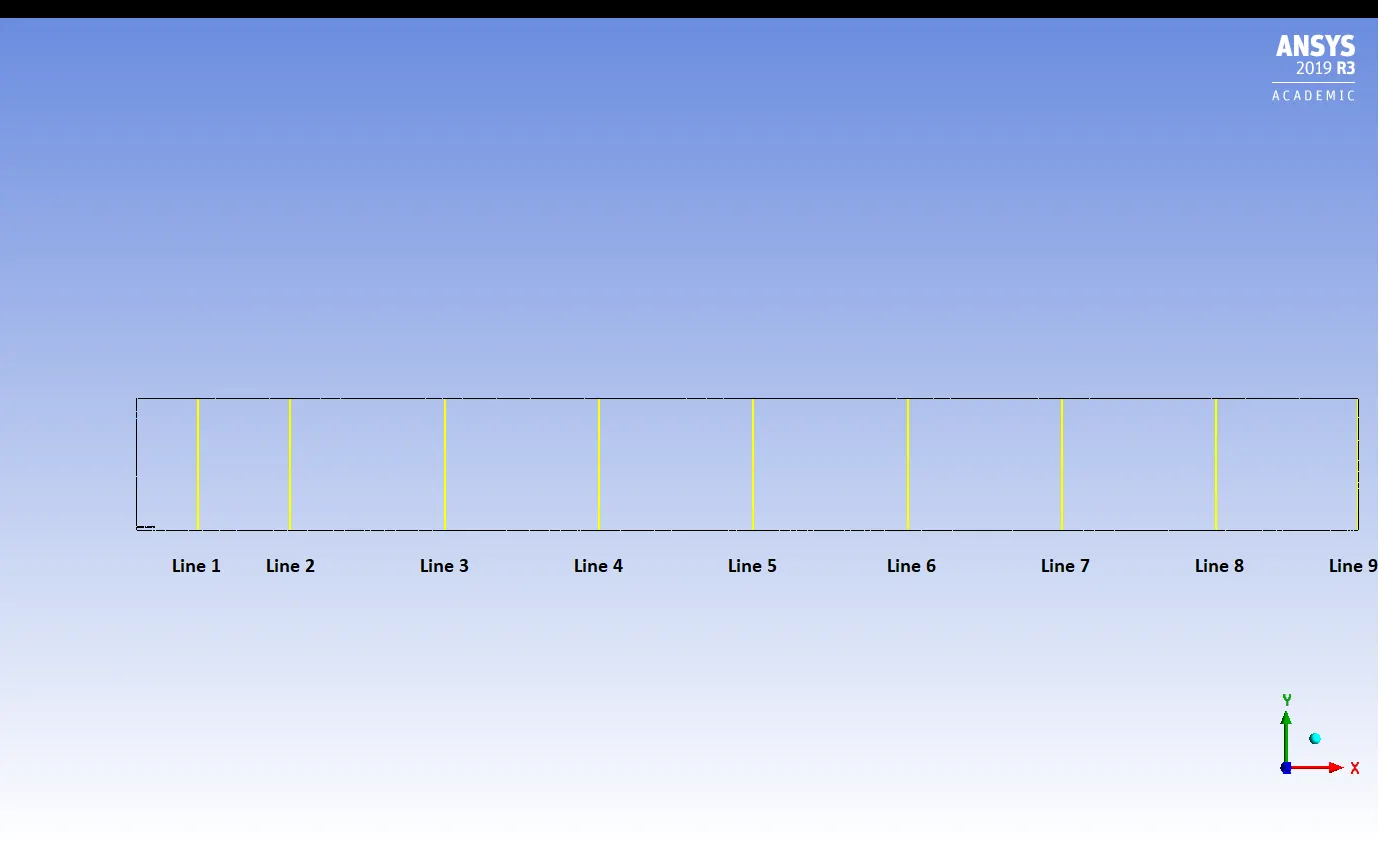
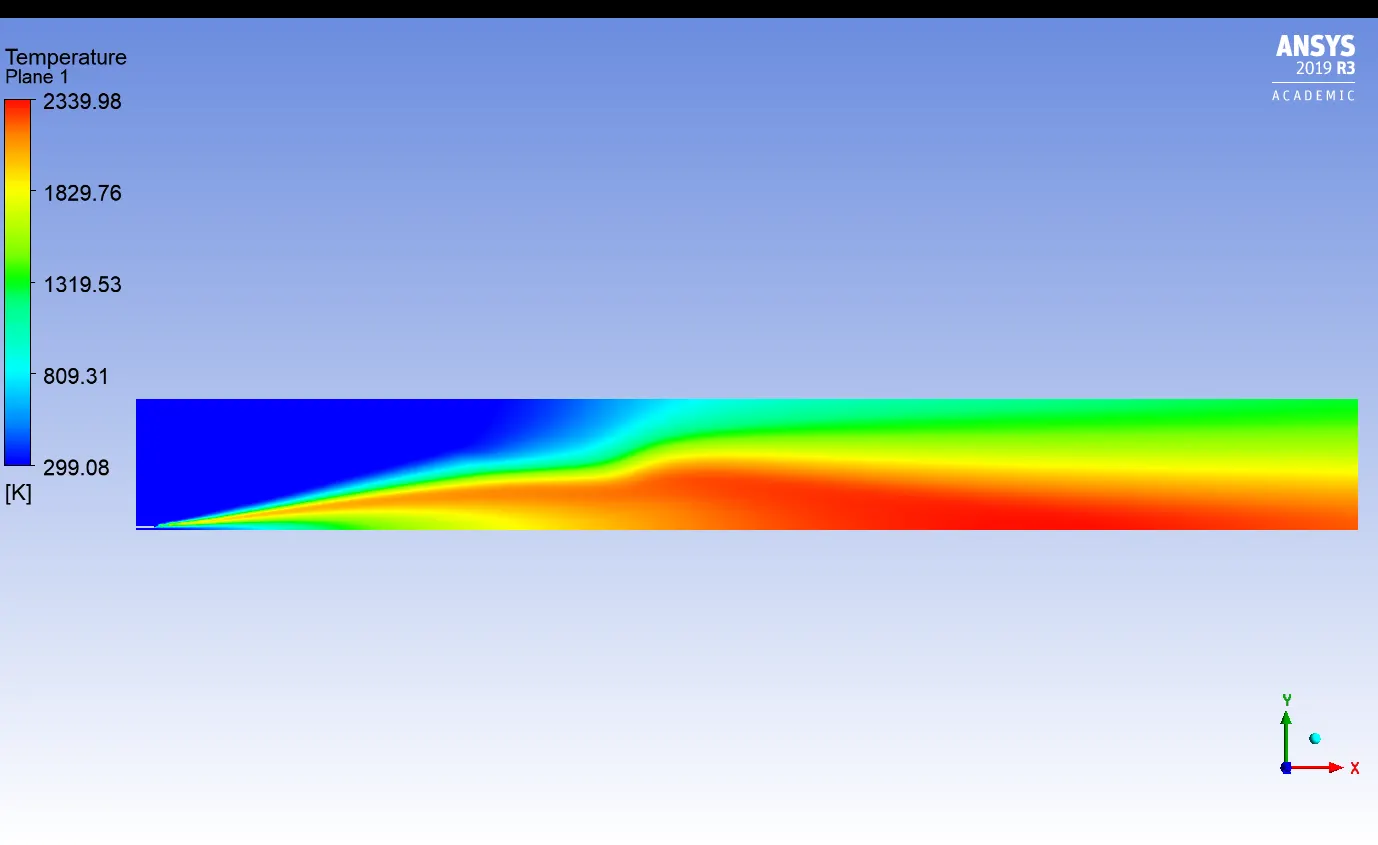
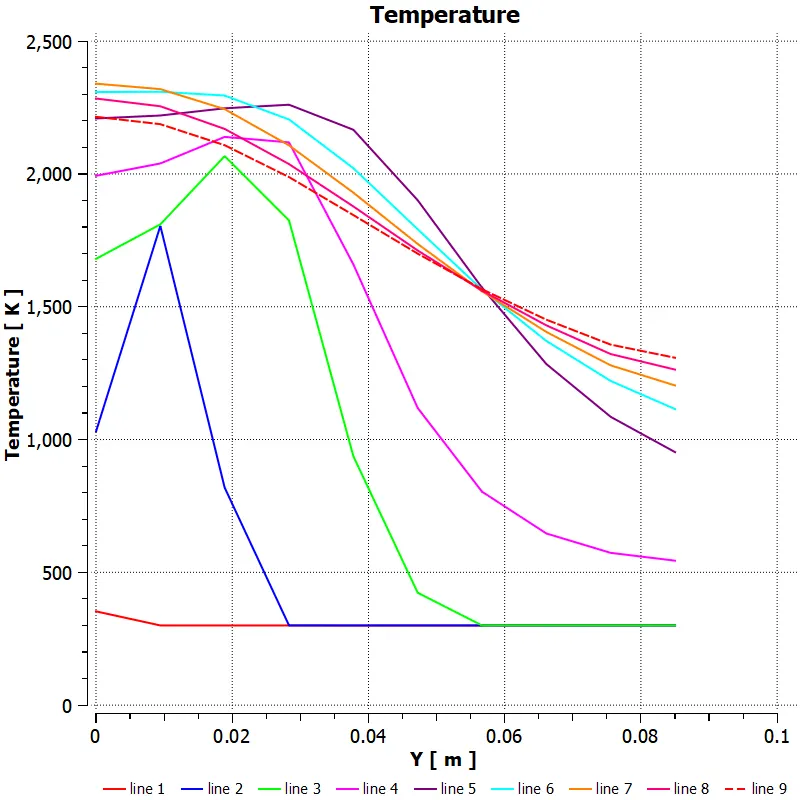
- Contour lines:
These are the contour lines from which we will obtain graph for specific variables followed below.
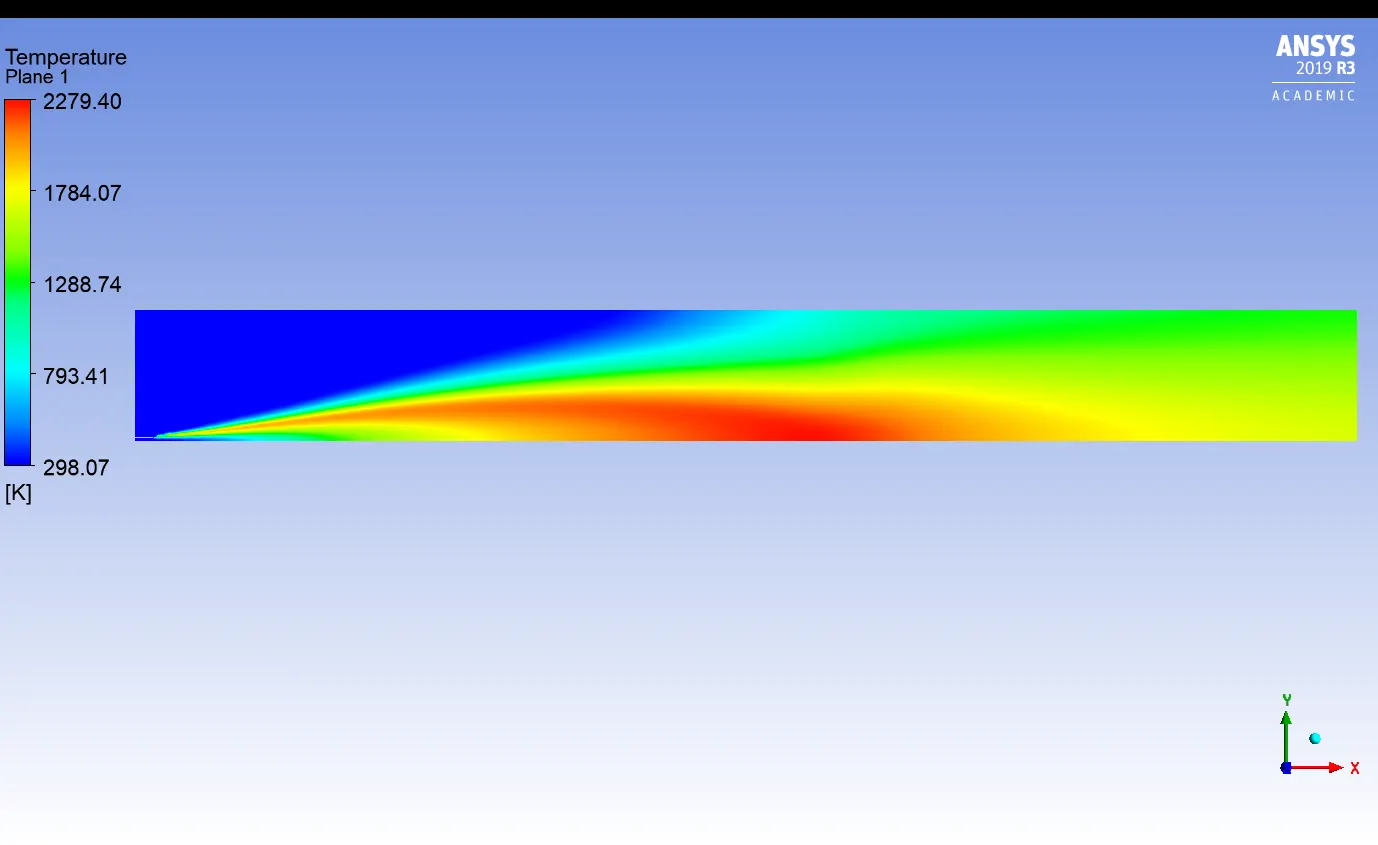
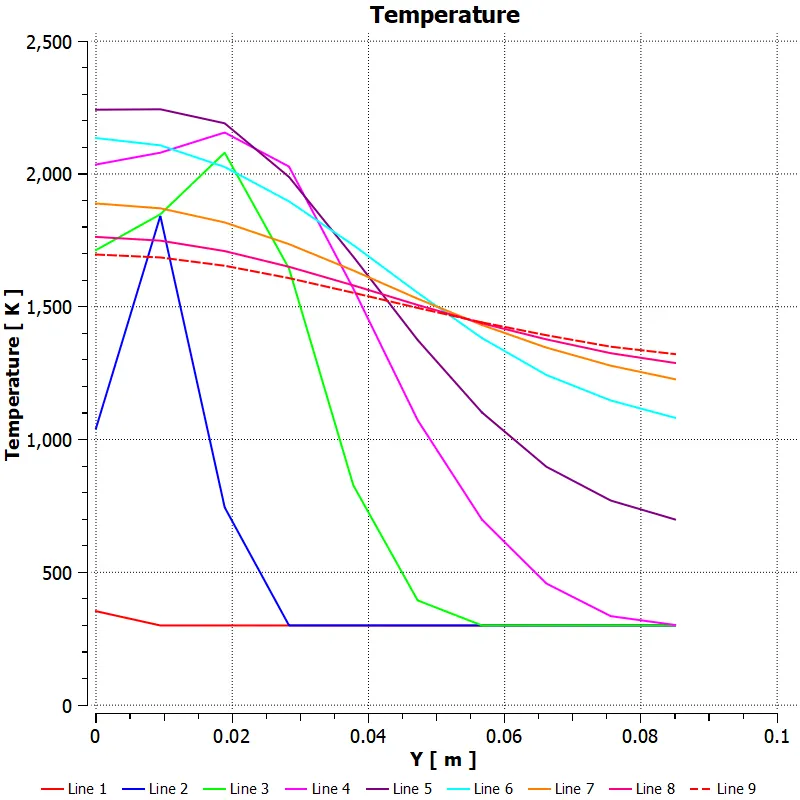
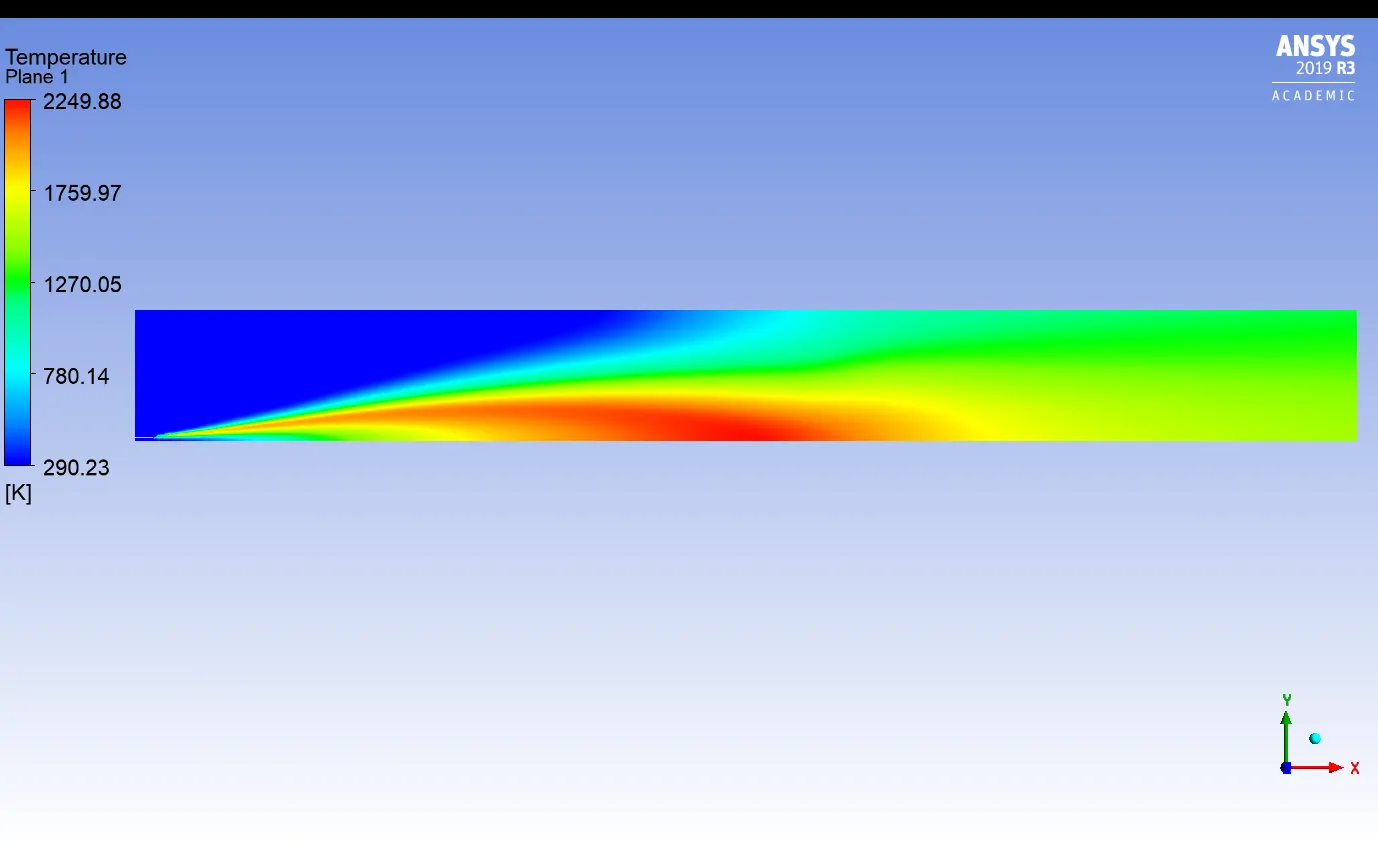
- Temperature :
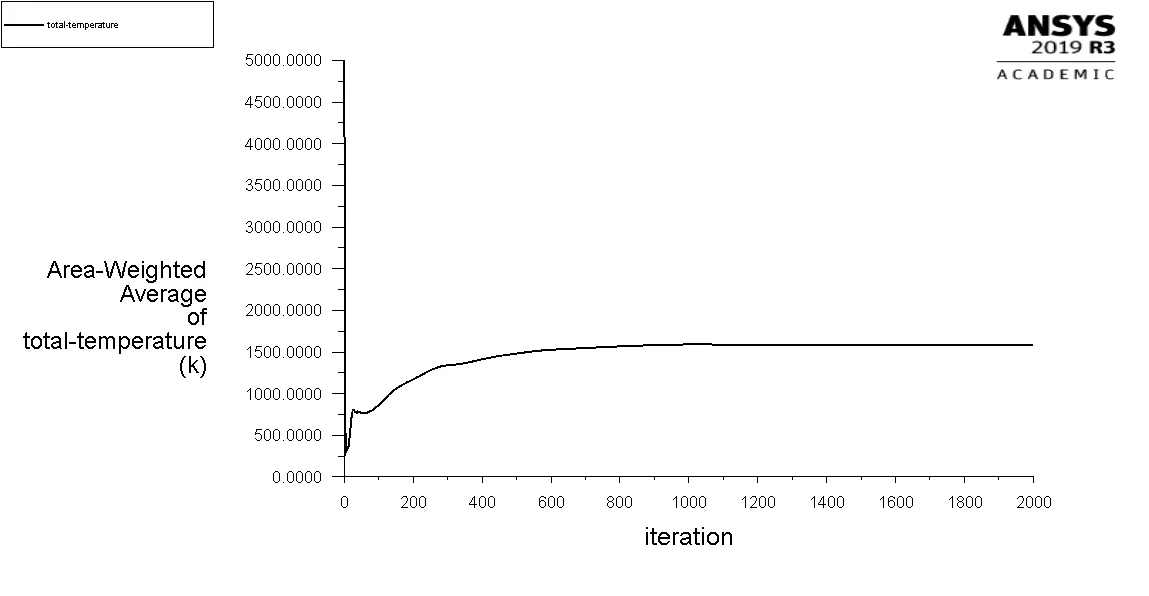
- Avg. Total temperature:
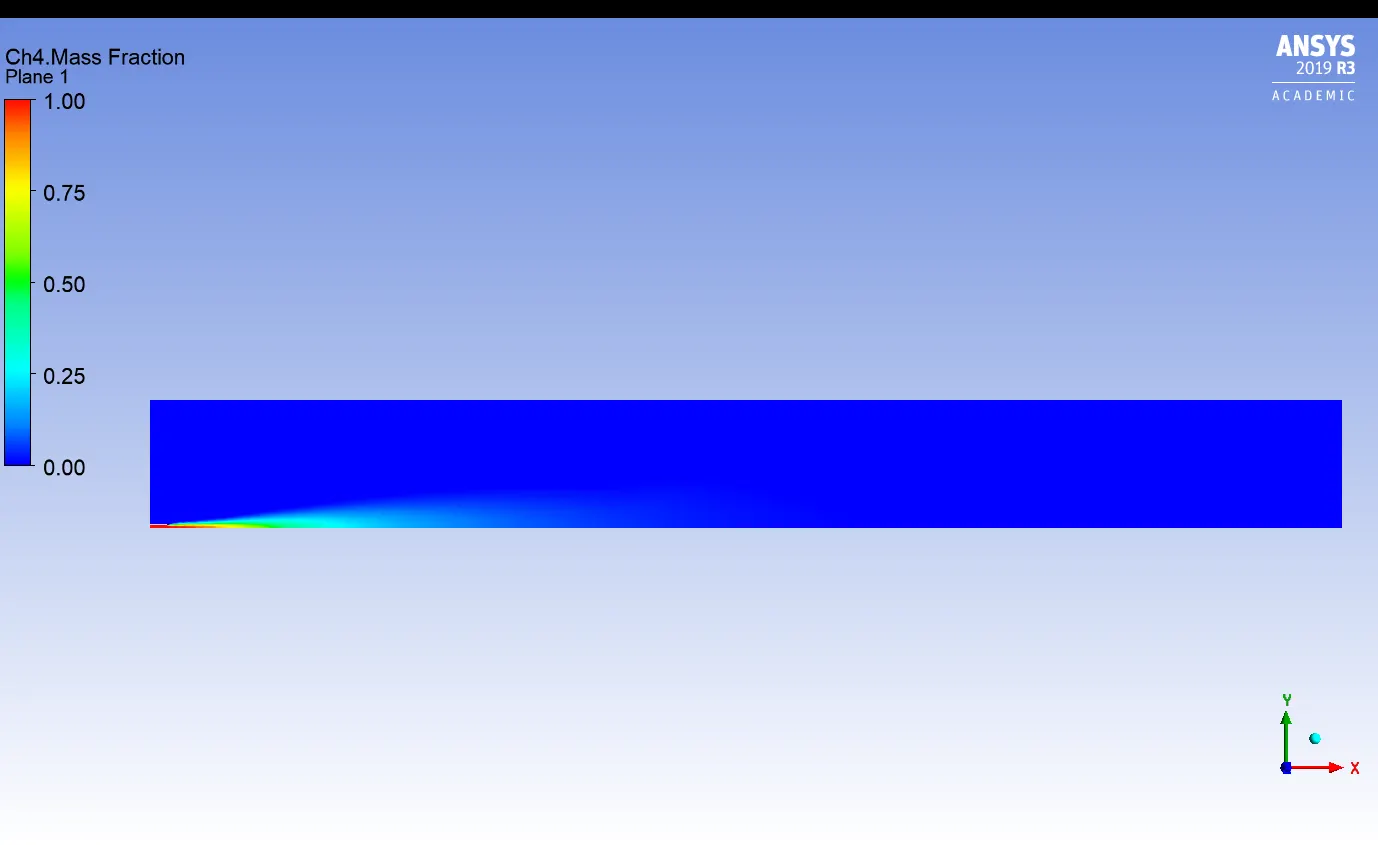
- CH4 Mass fraction:
- CO2 Mass fraction:
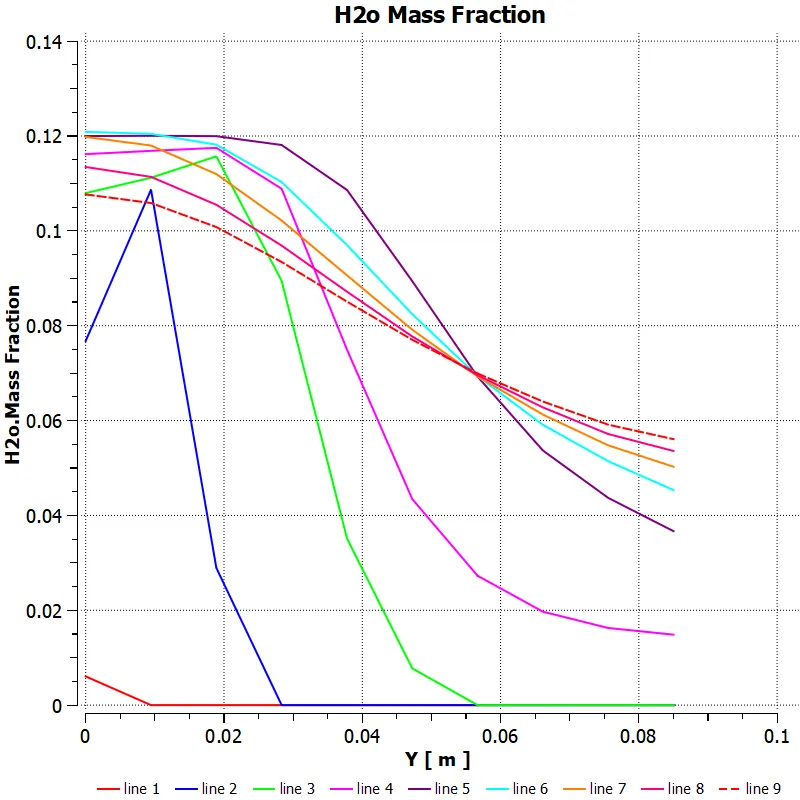
- H2O Mass fraction:
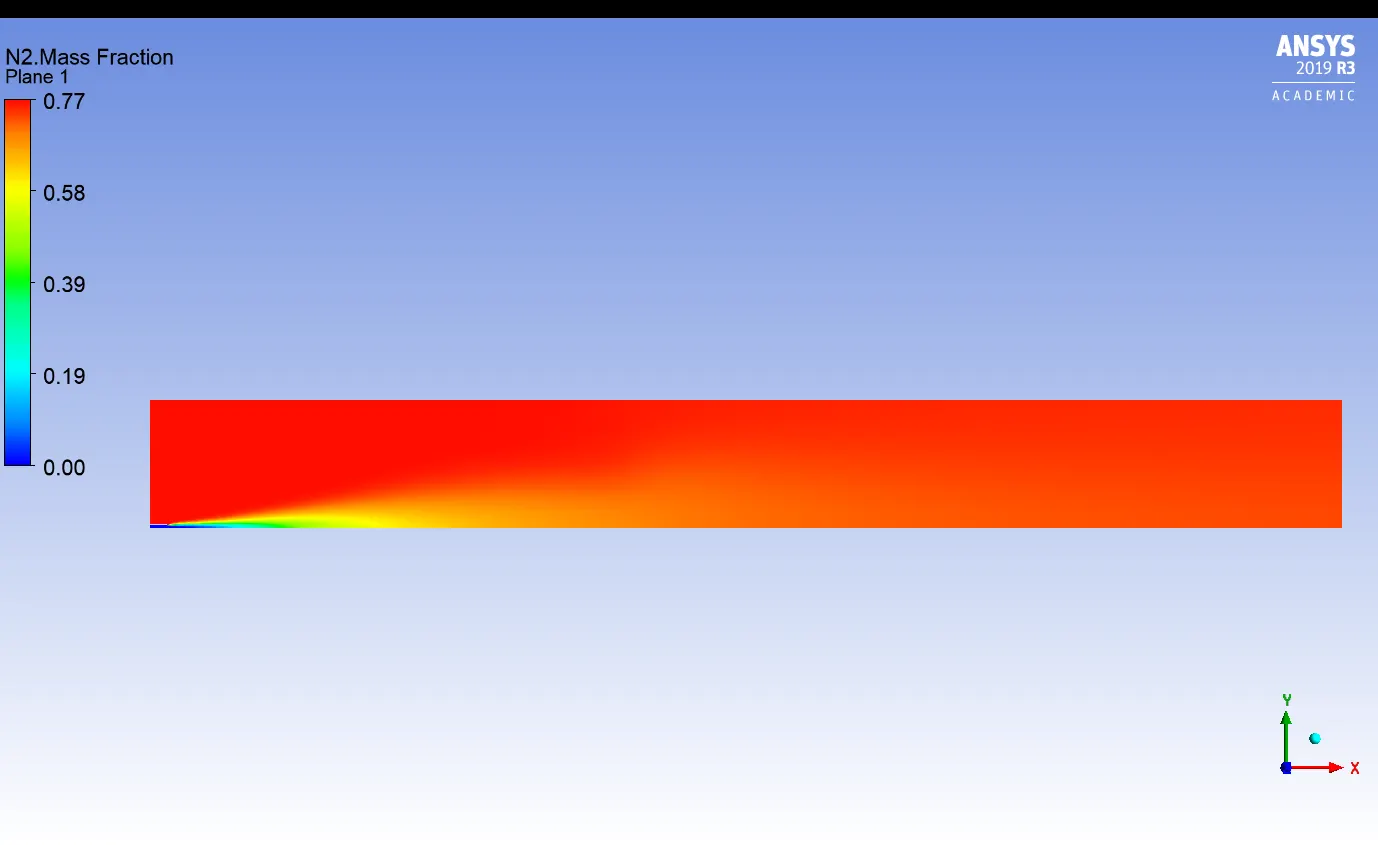
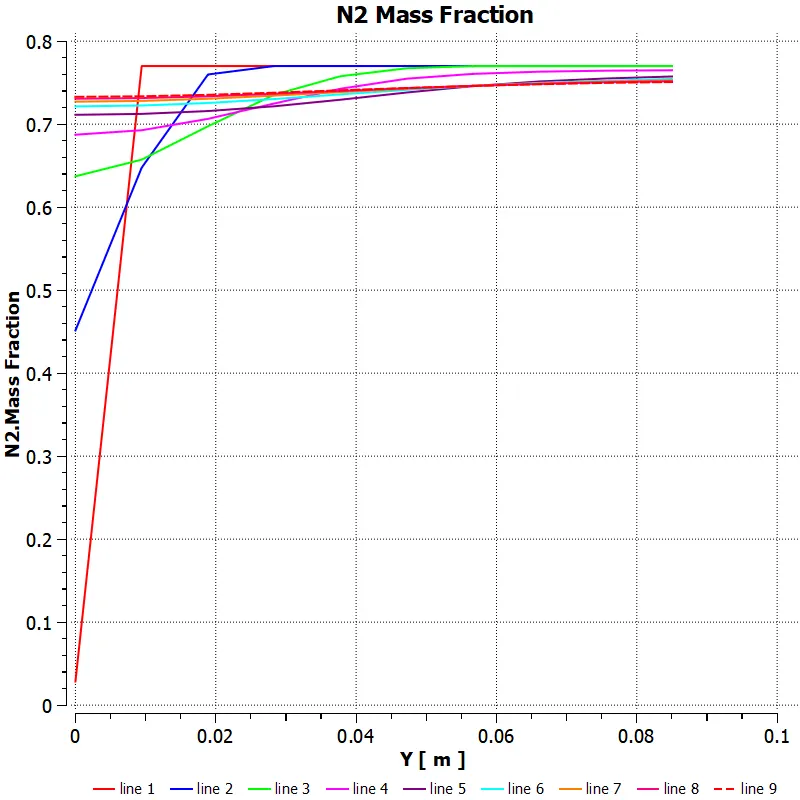
- N2 Mass fraction:
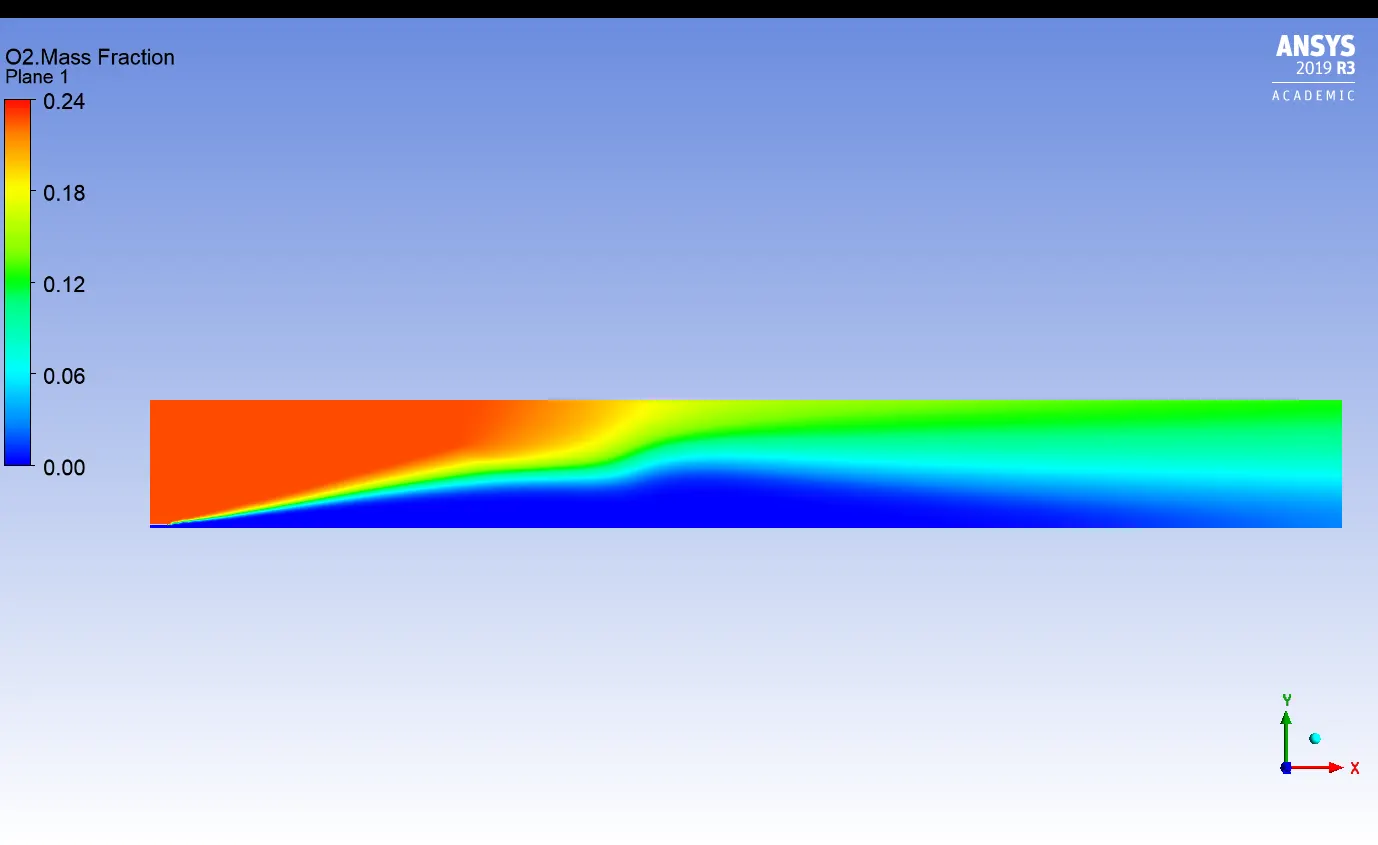
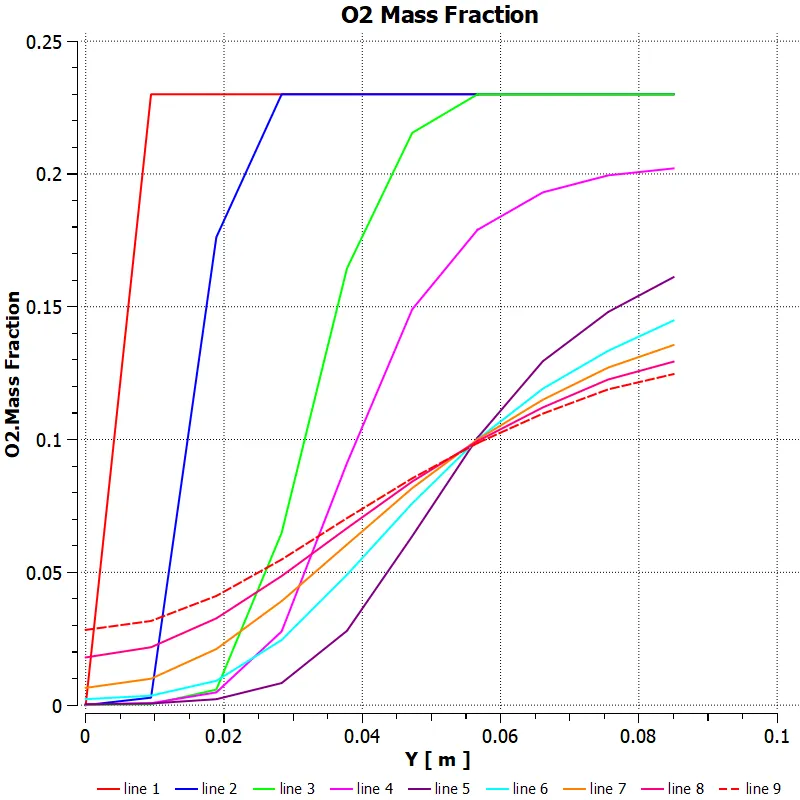
- O2 Mass fraction:
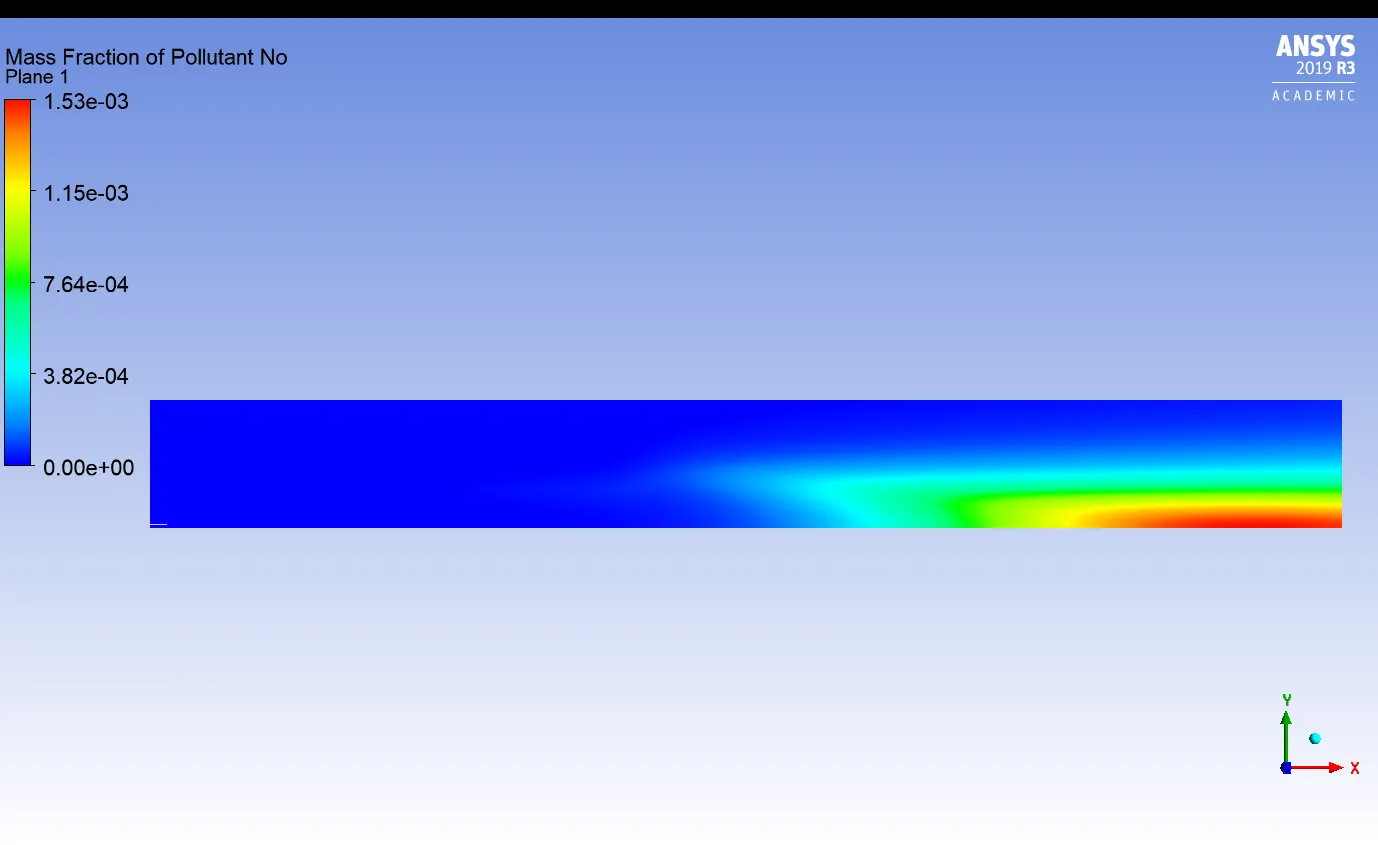
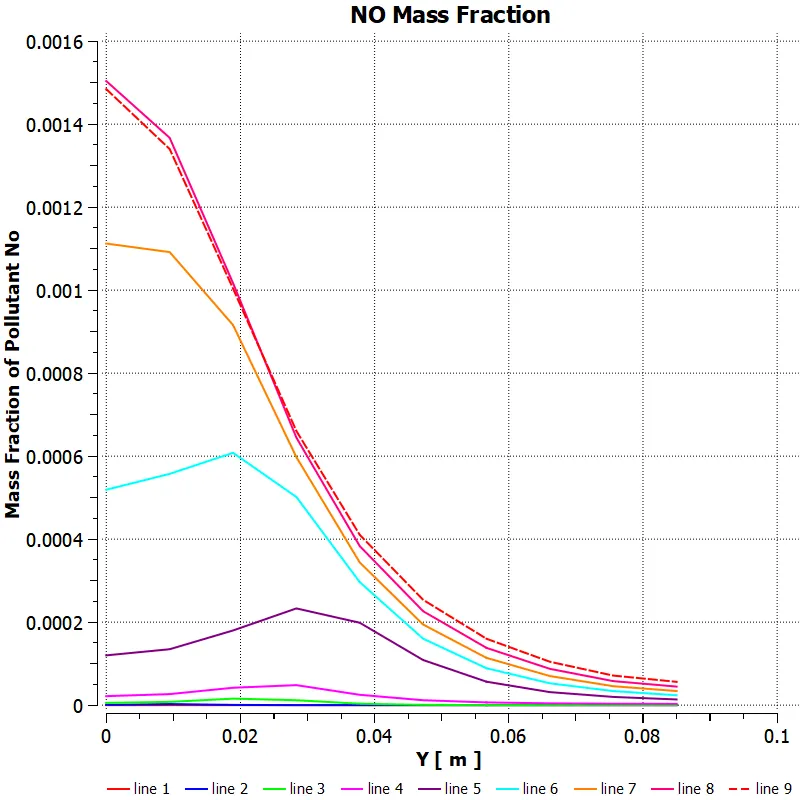
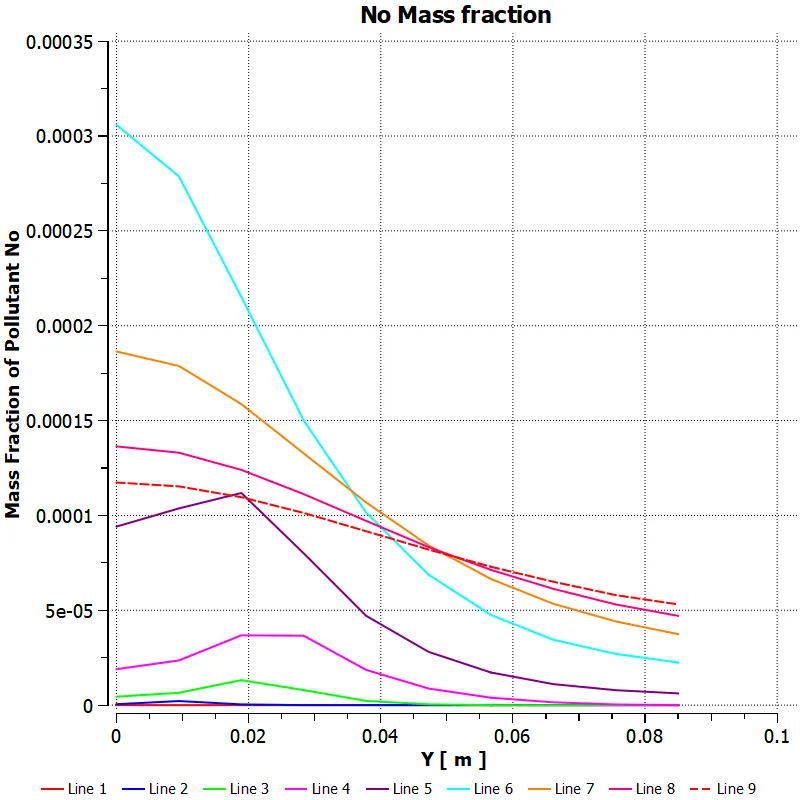
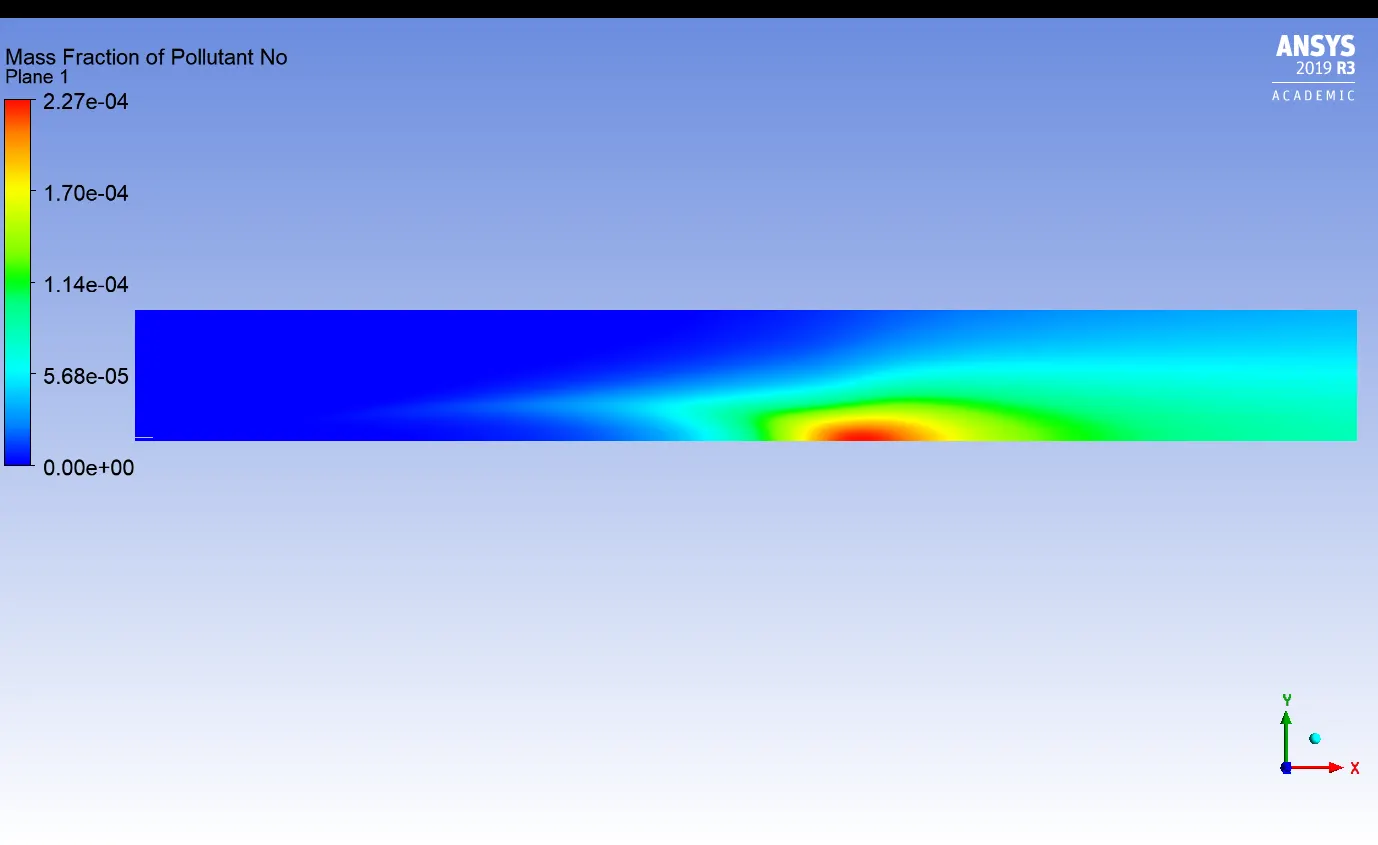
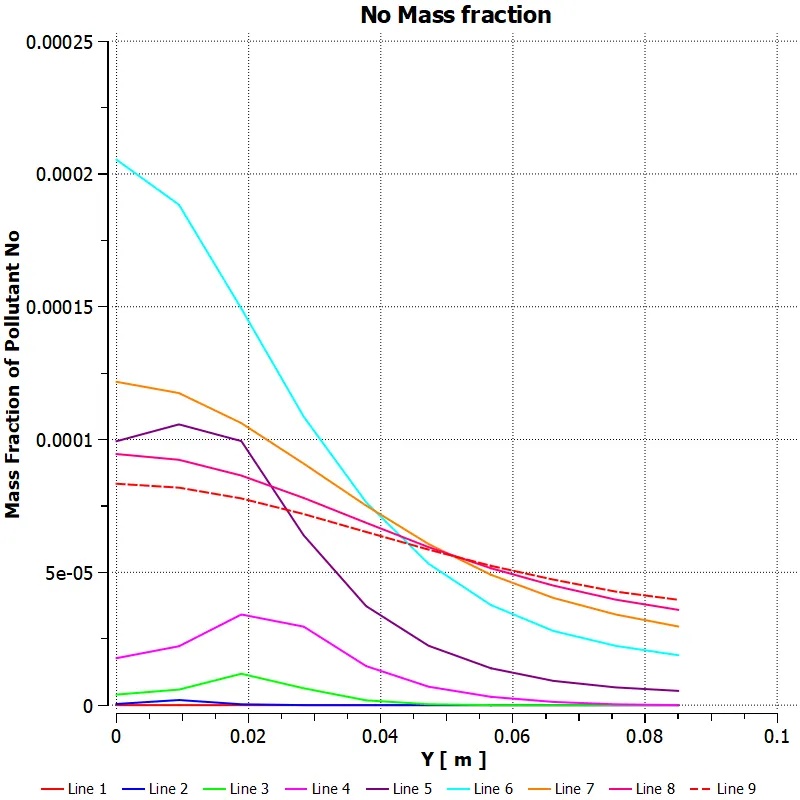
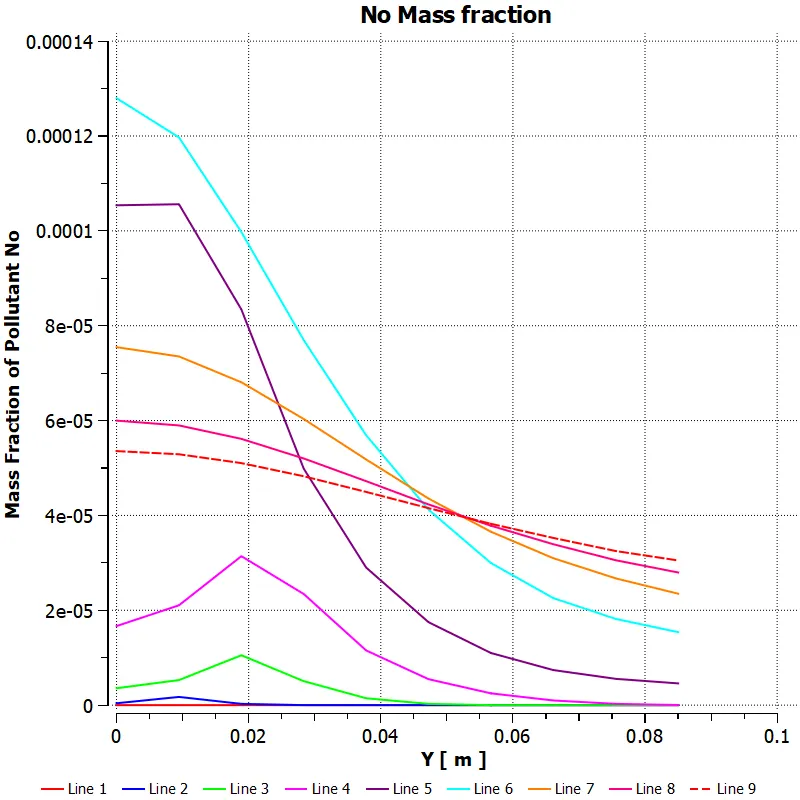
- NO Mass fraction:
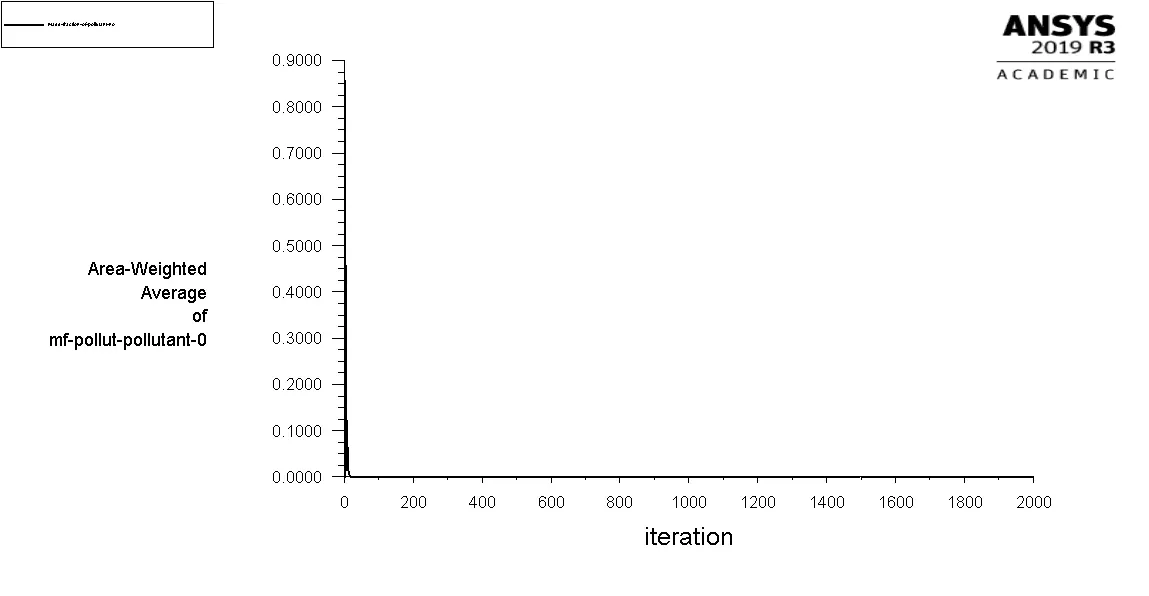
- Avg. Of pollutant No :
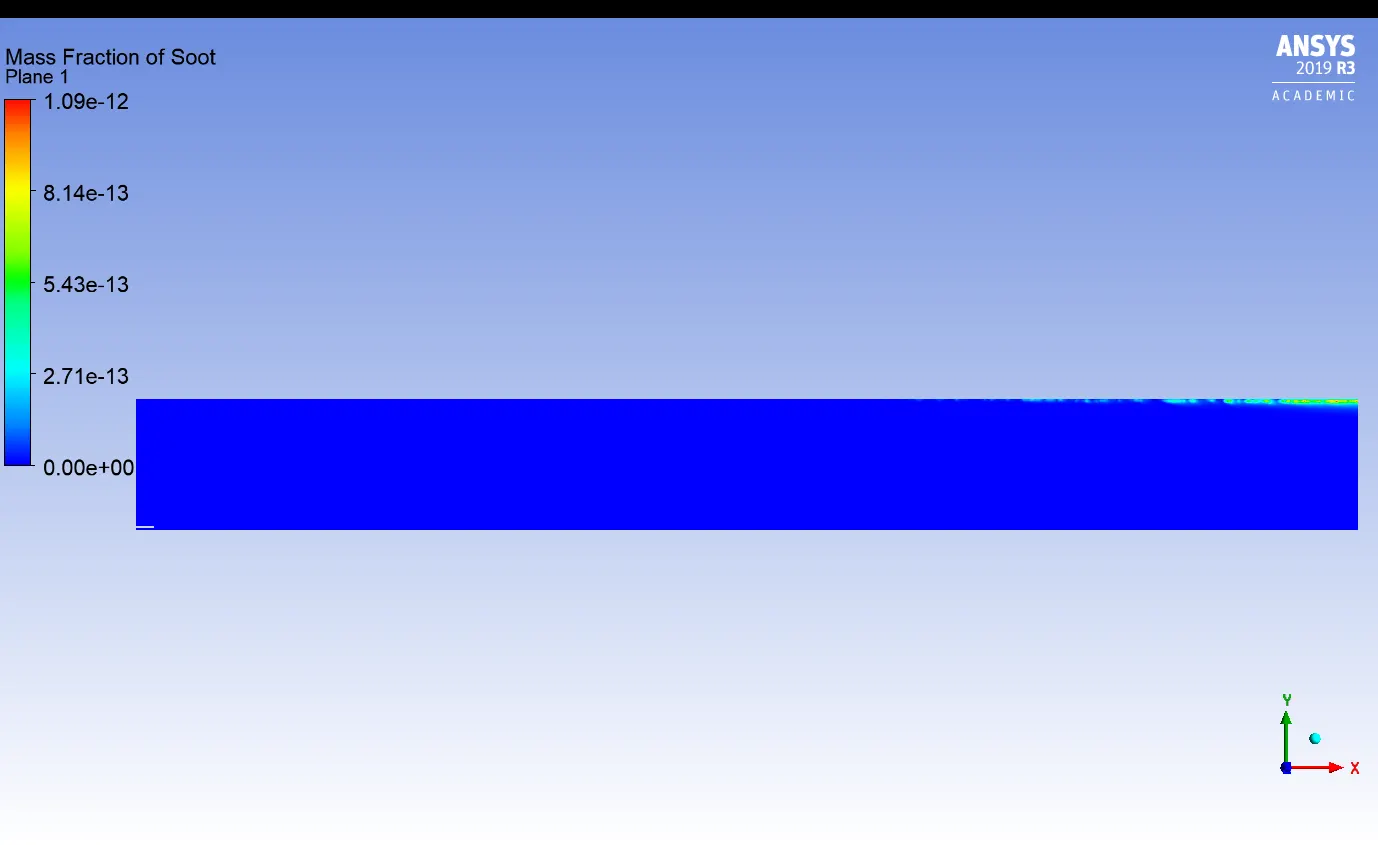
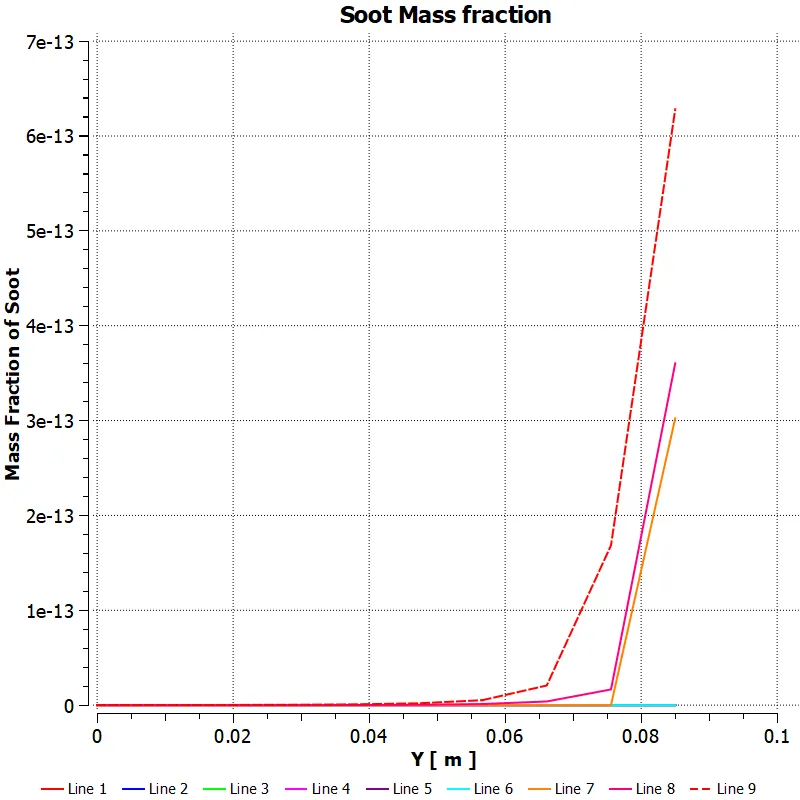
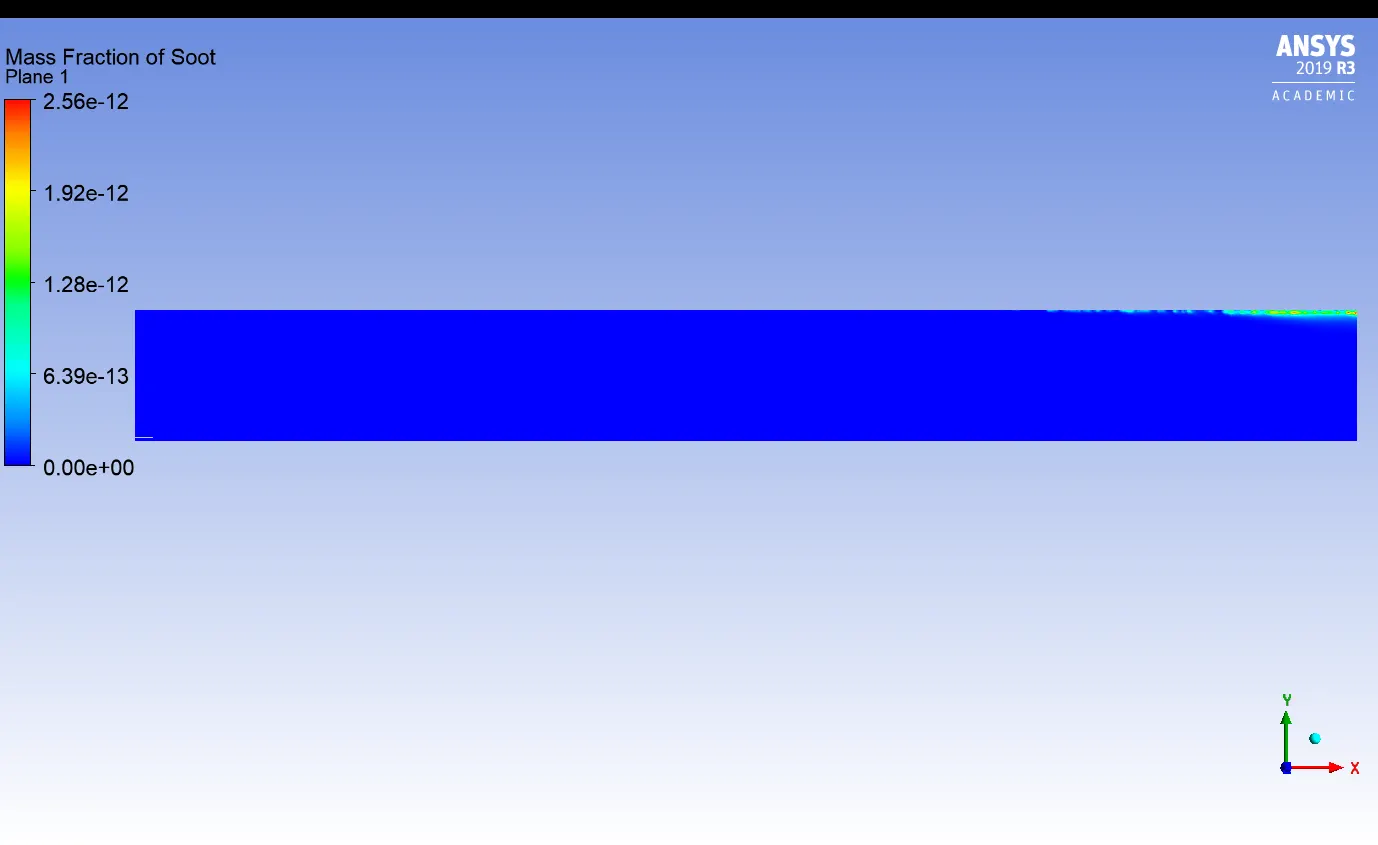
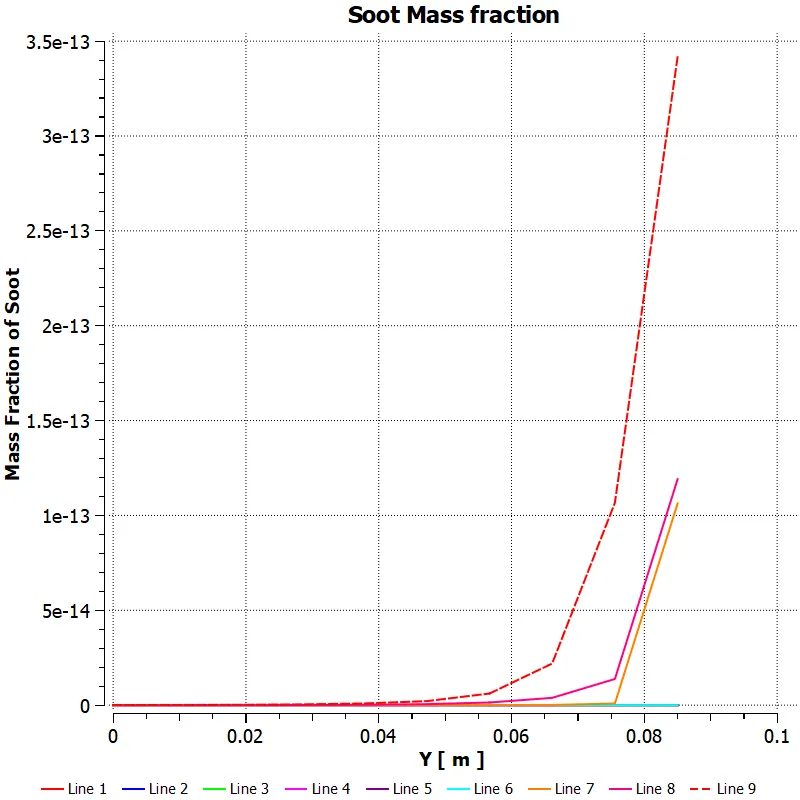
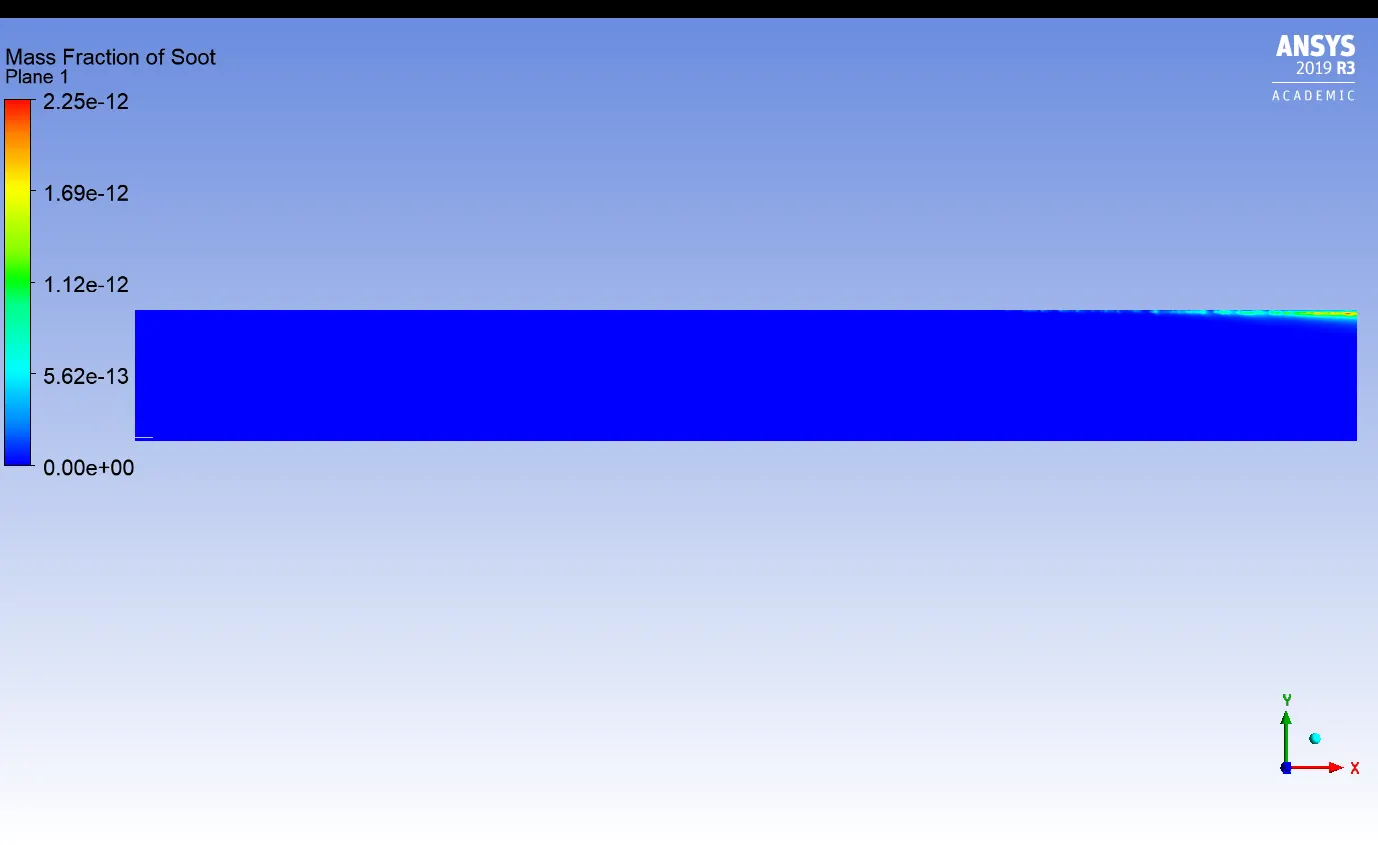
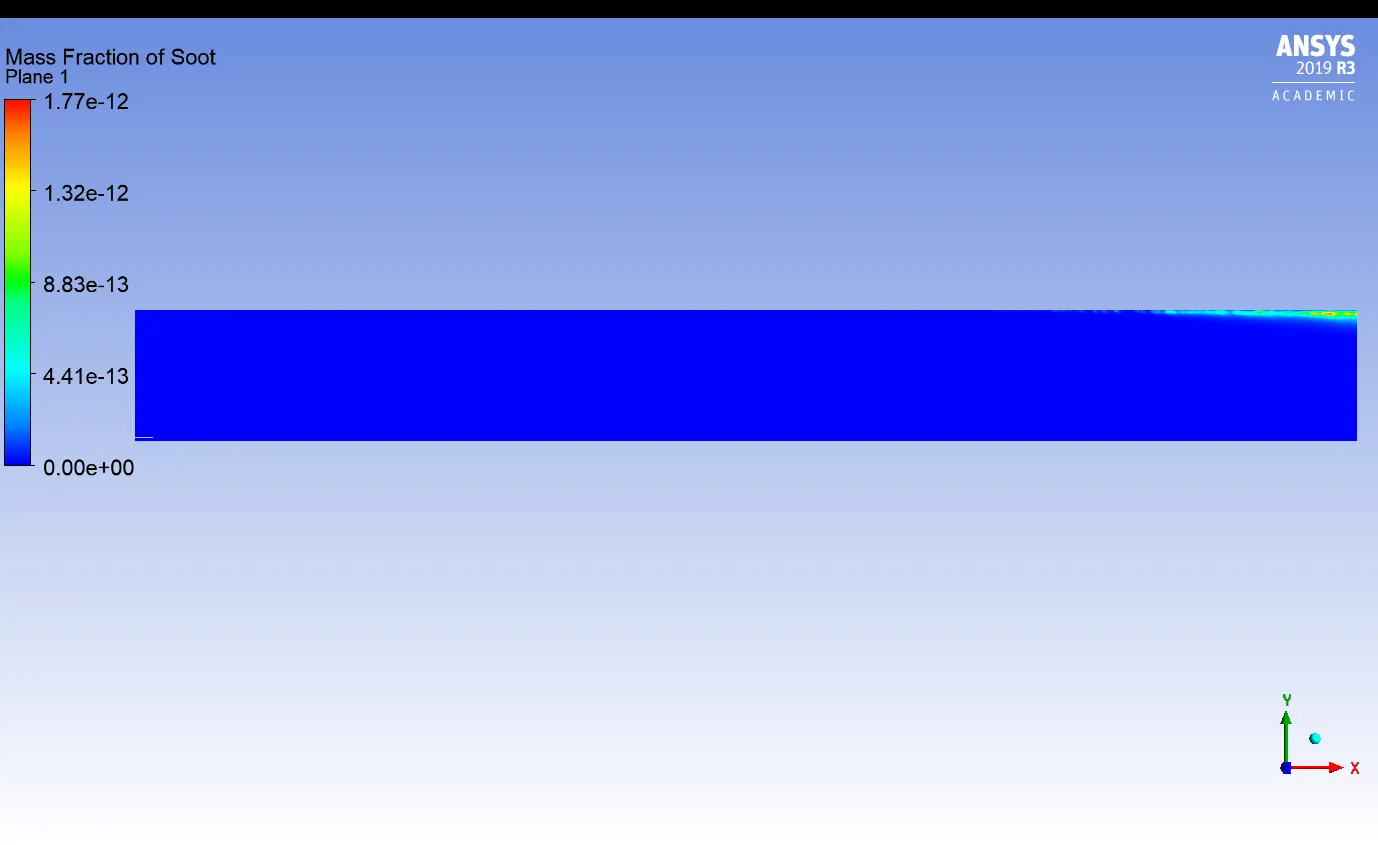
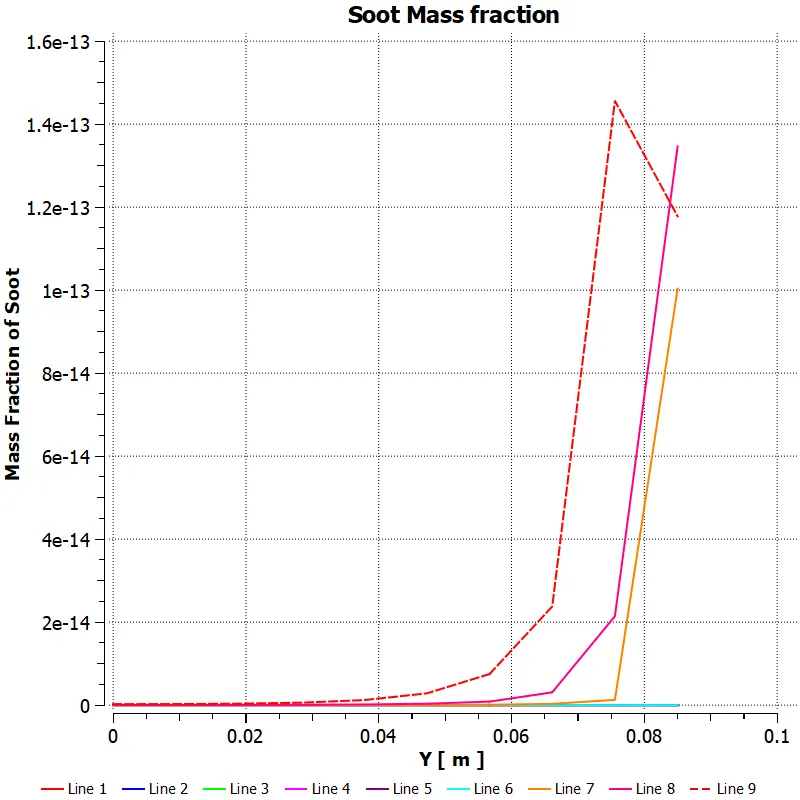
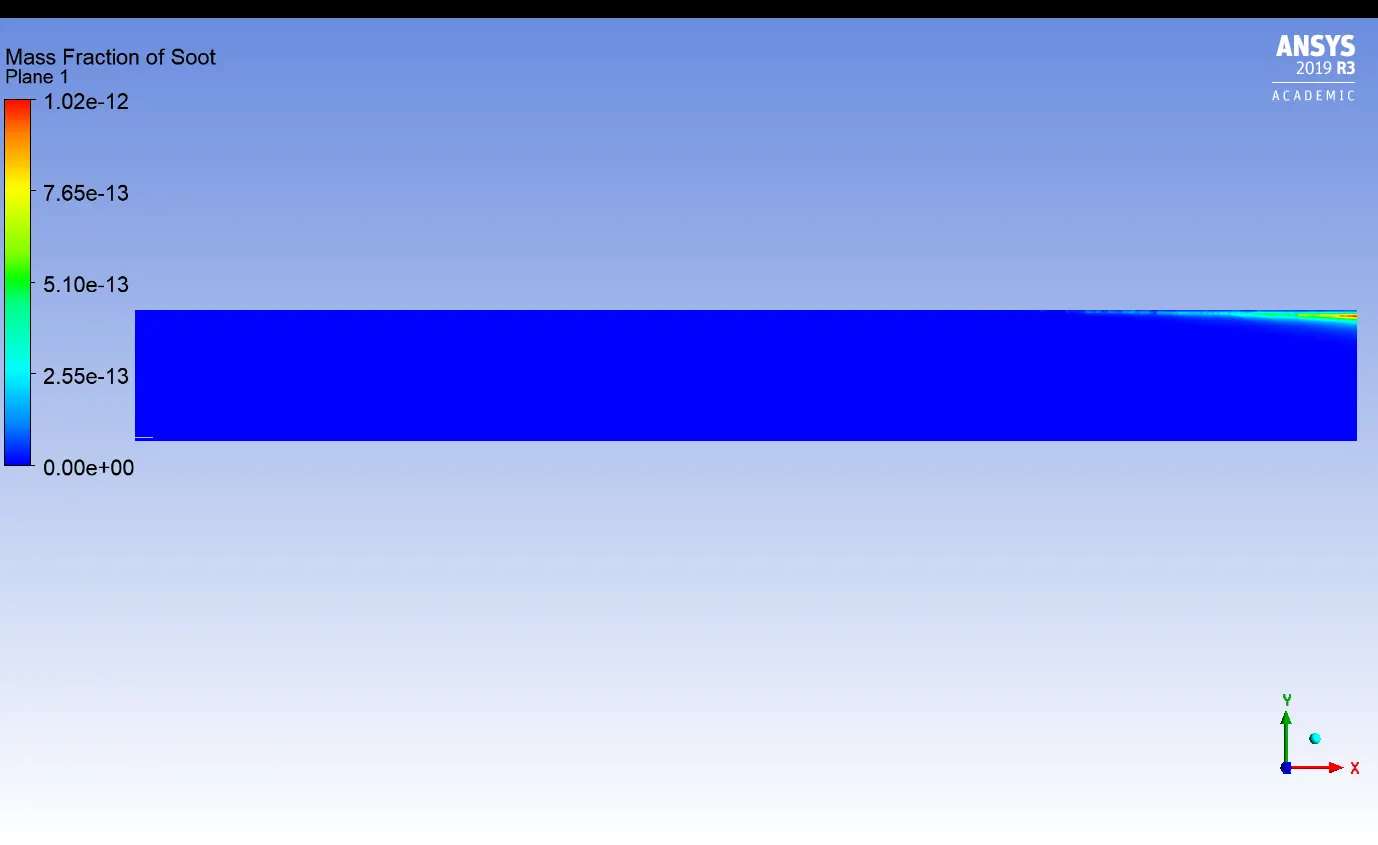
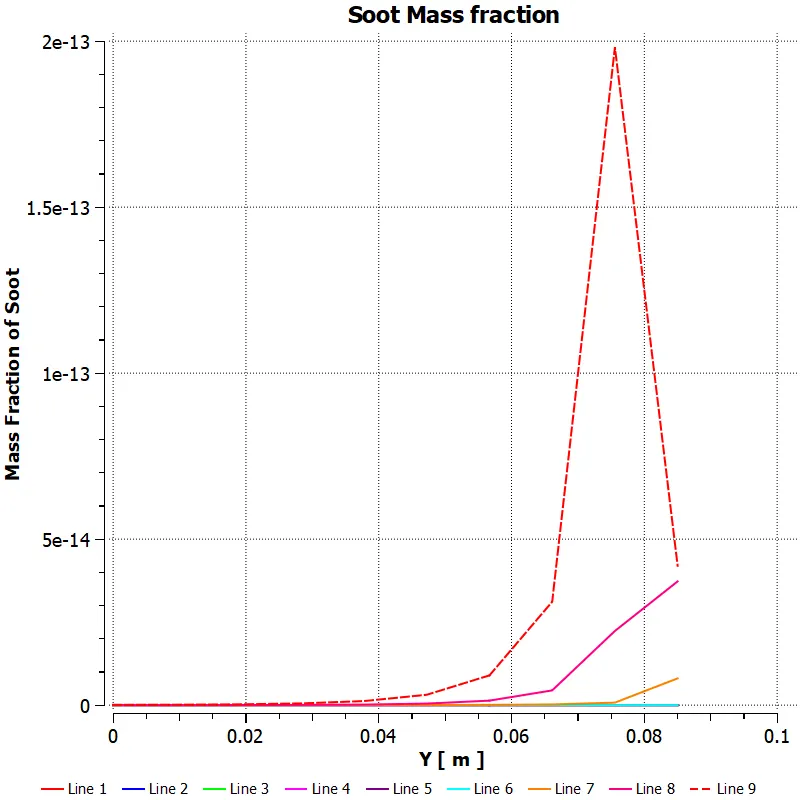
- Soot Mass fraction:
############################### { Part II - Adding water content in fuel} ###############################
- In this part we will add water in fuel and increase its percentage from 5% - 30%.
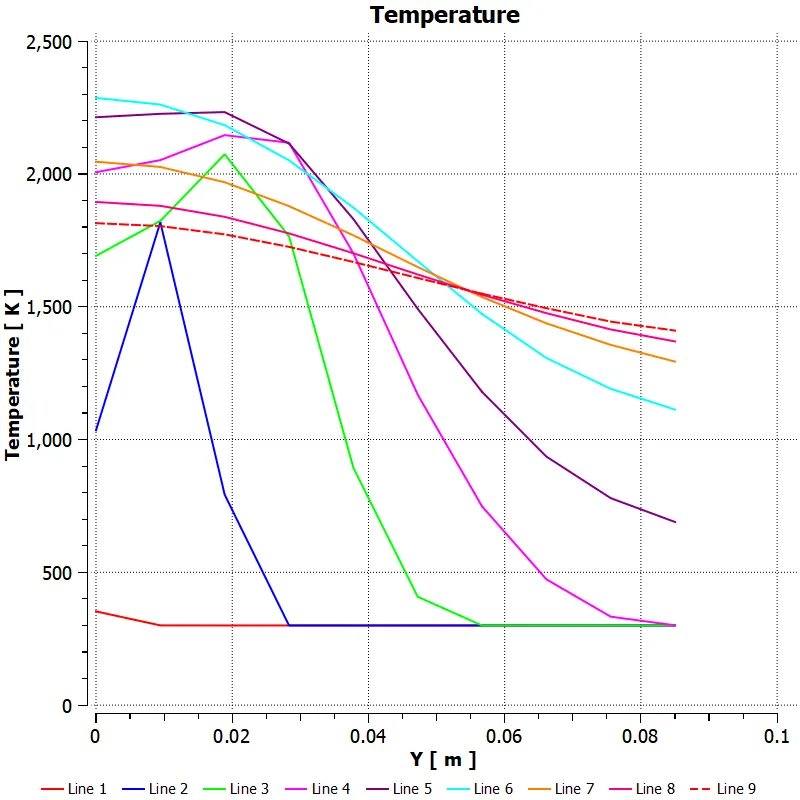
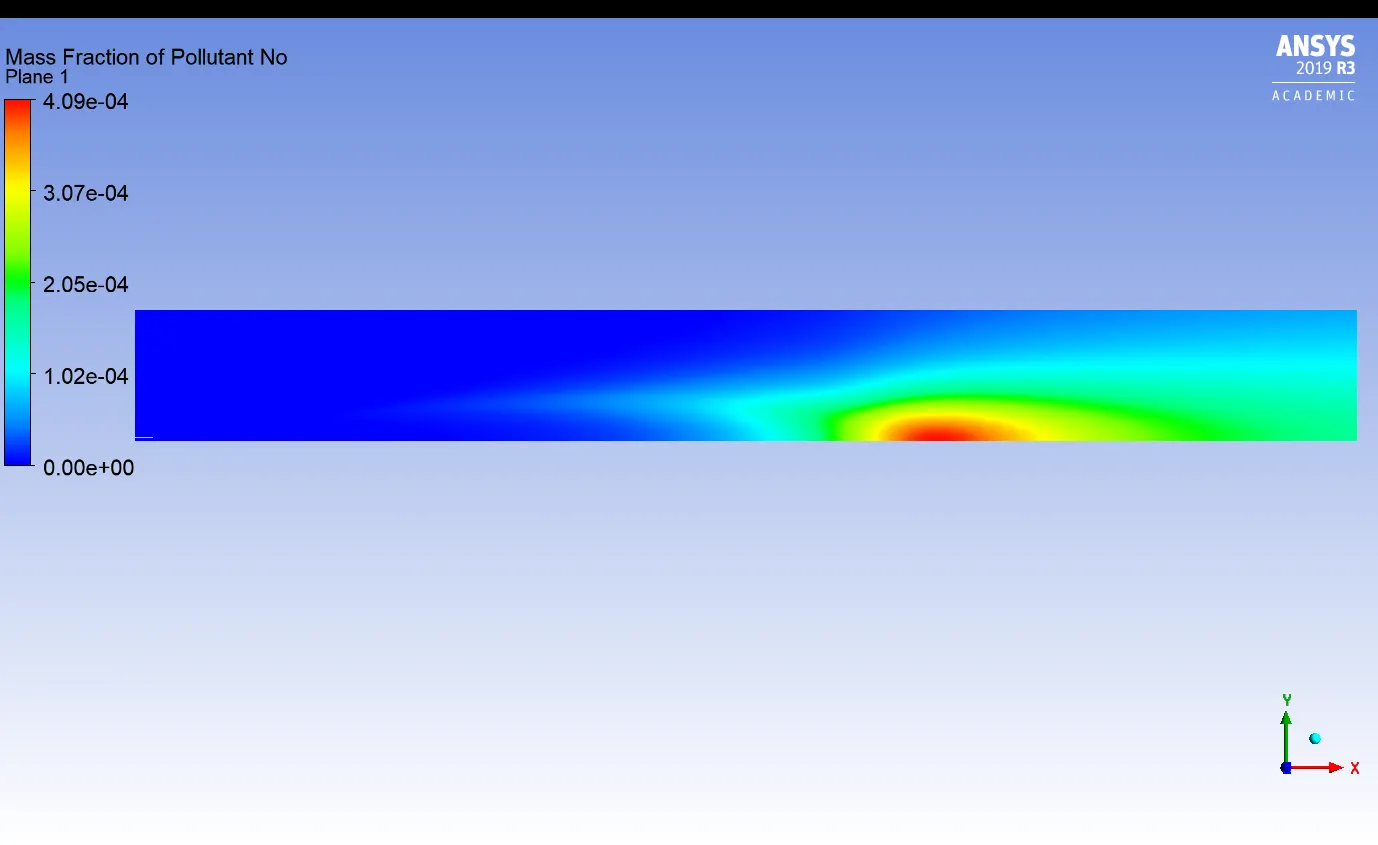
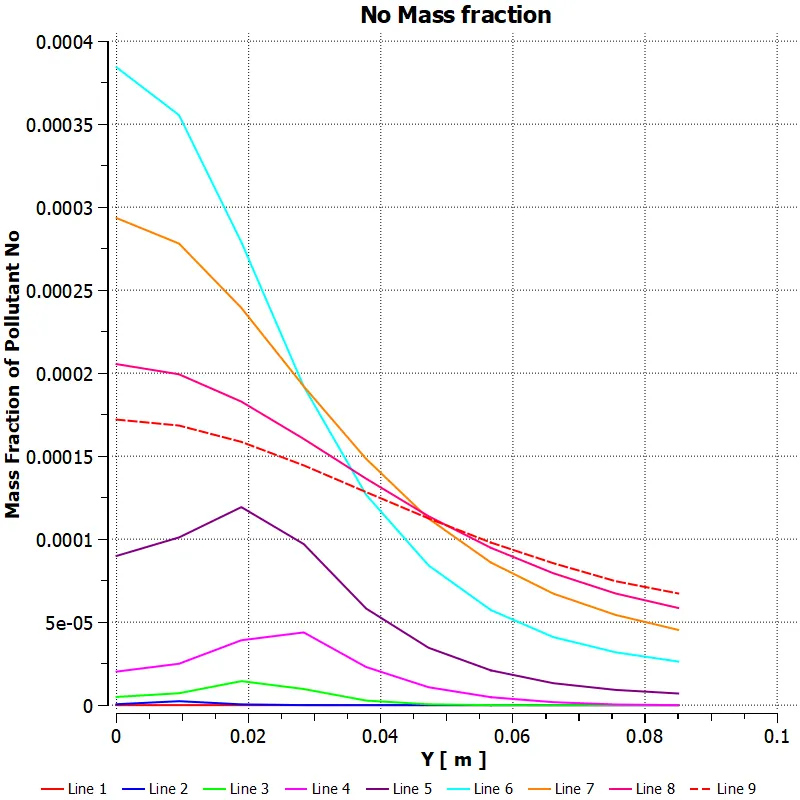
<<<<<<<<<<<<<<< [ 95% CH4 - 5% H2O ] >>>>>>>>>>>>>>>
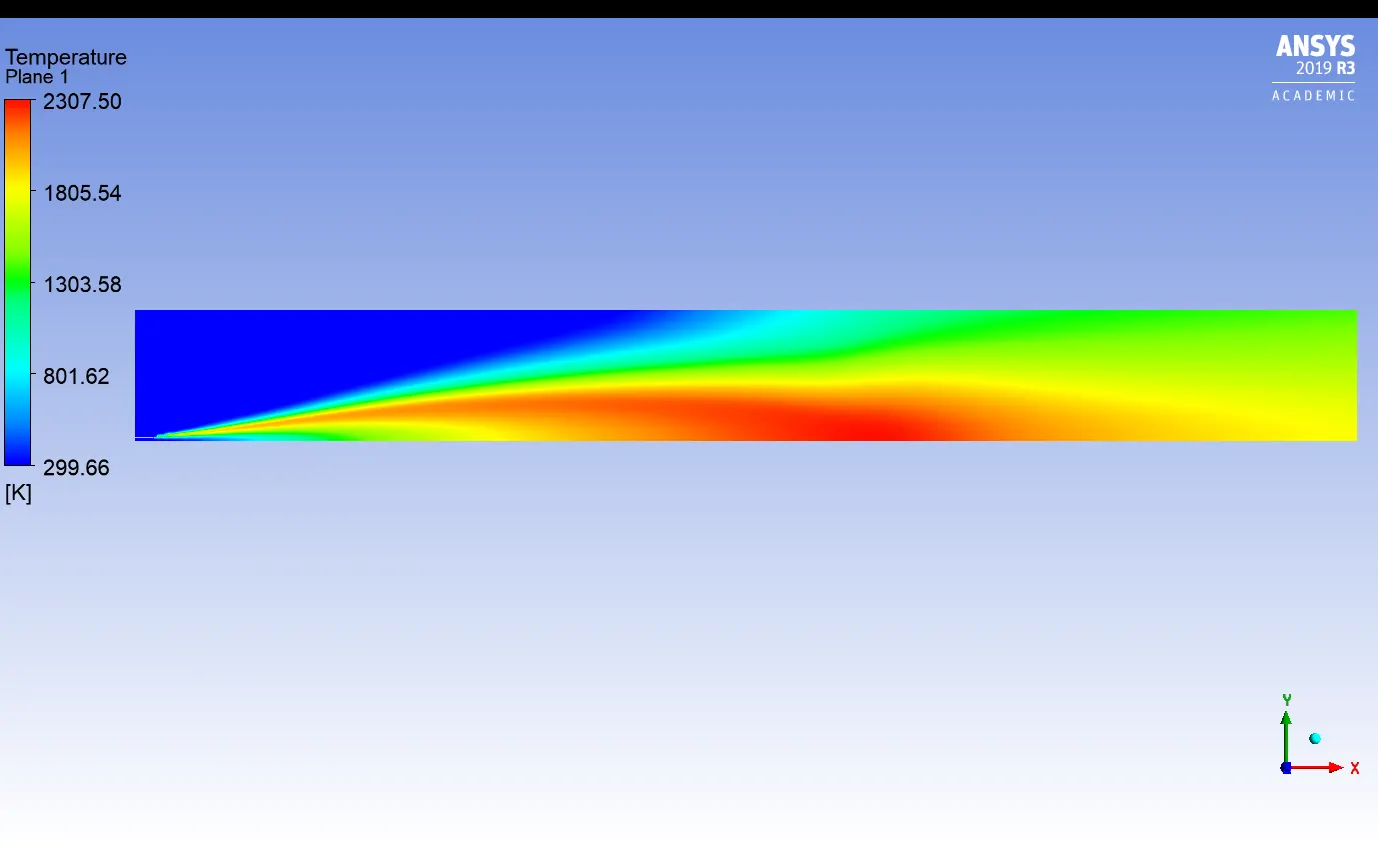
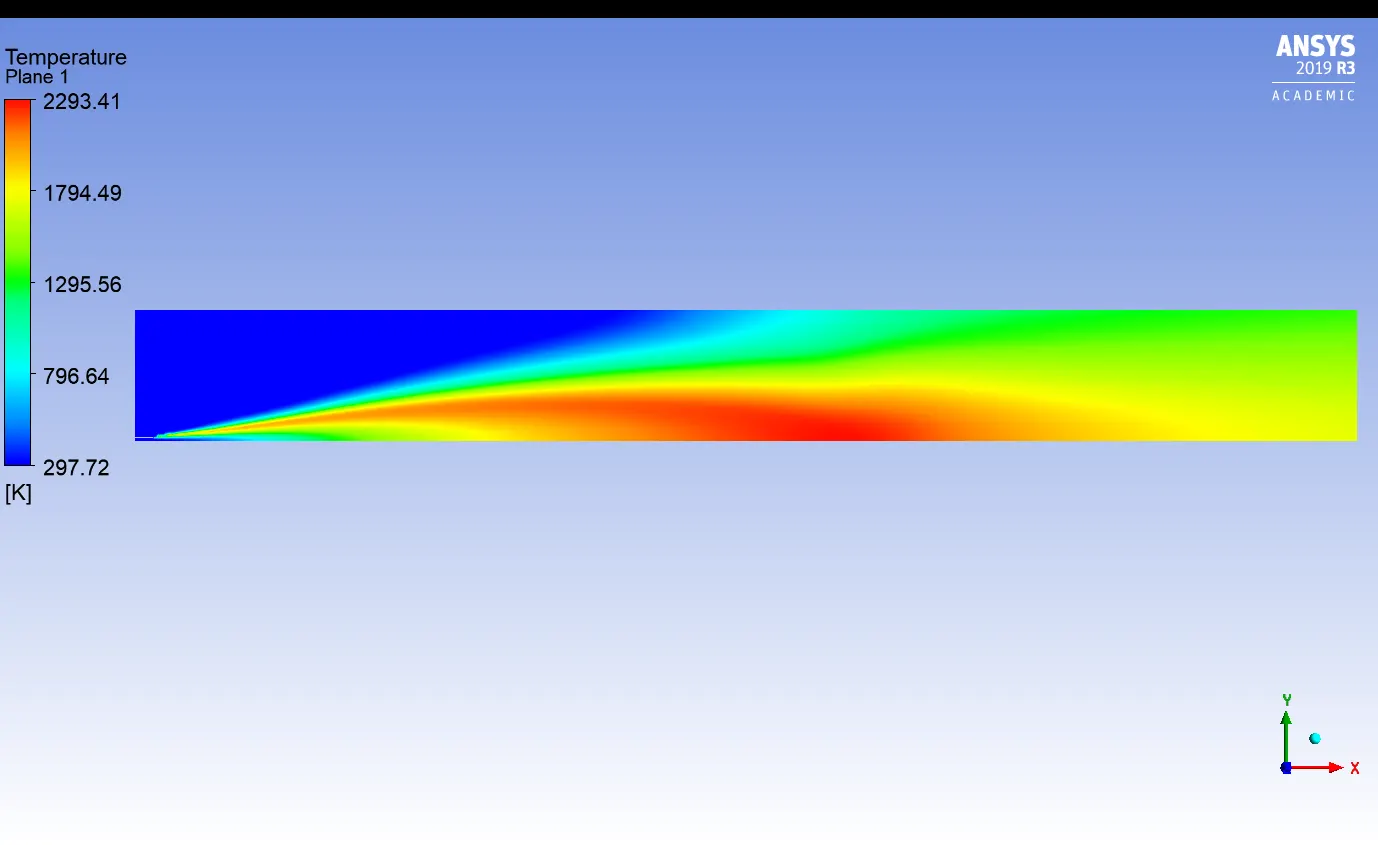
- Temperature
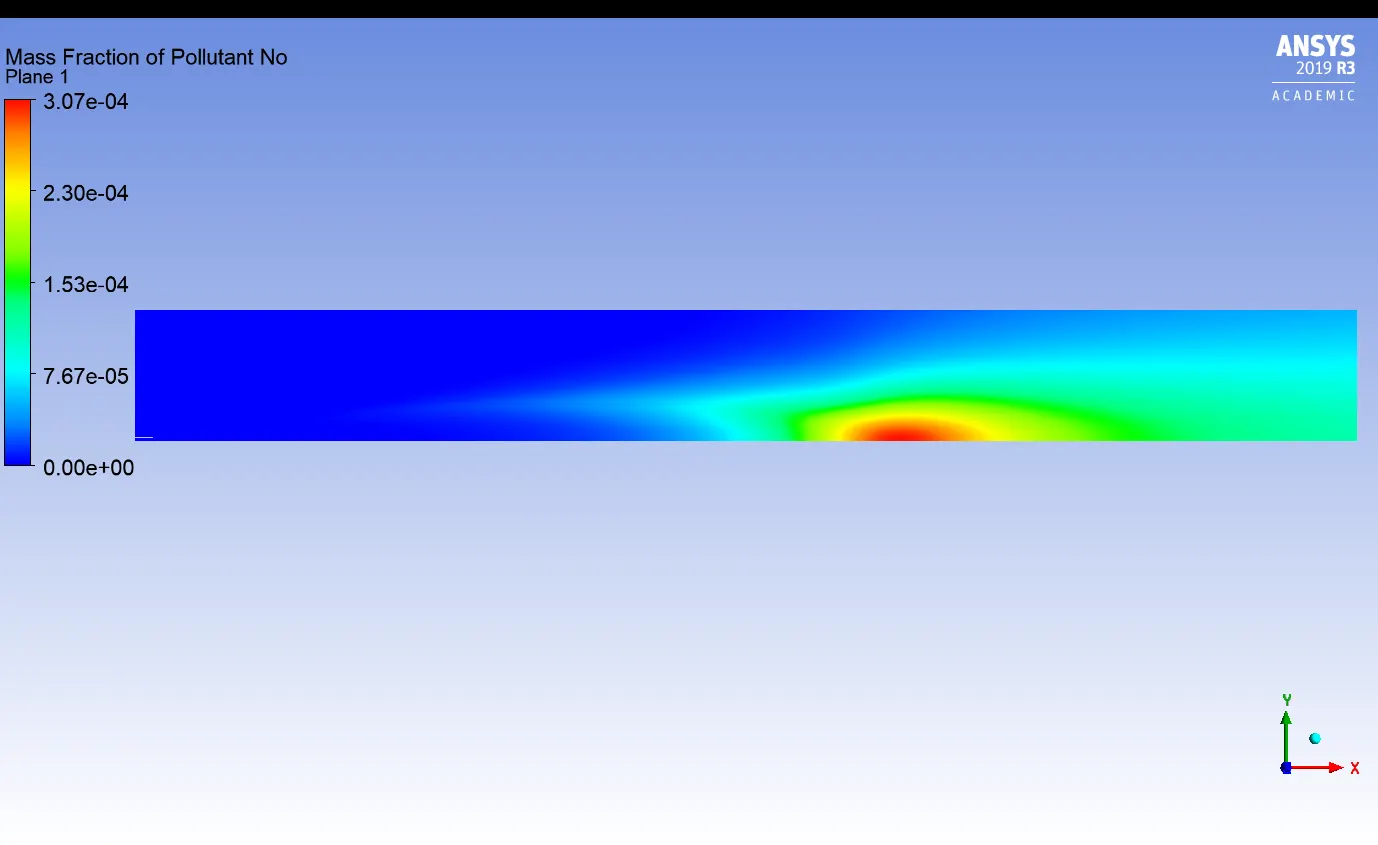
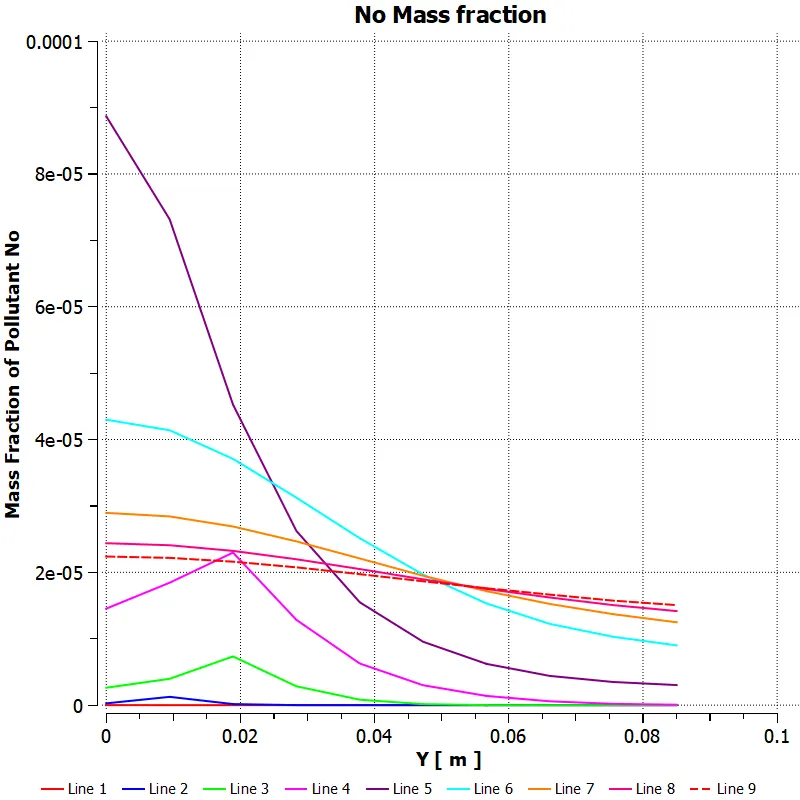
- No pollutant
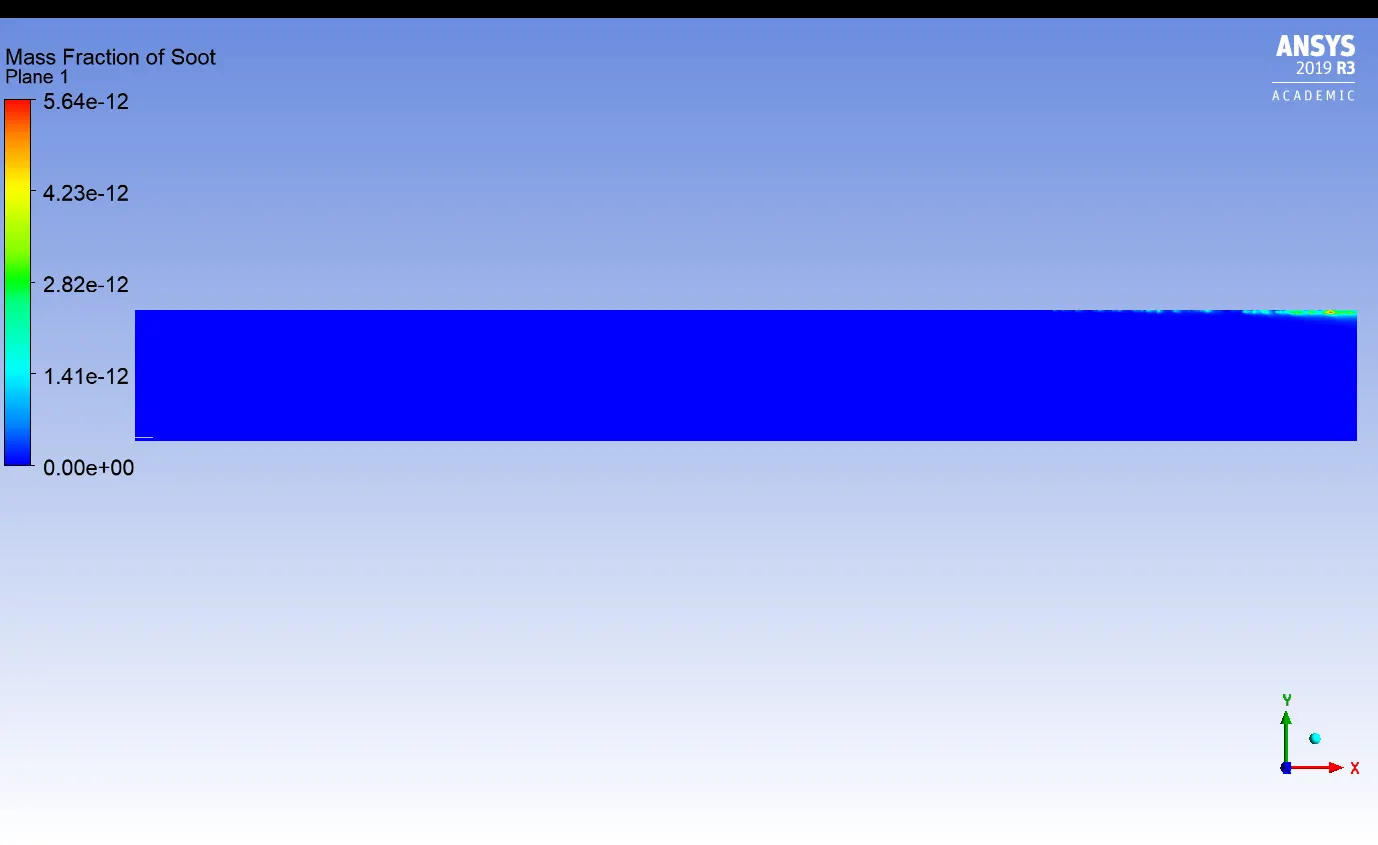
- Soot

<<<<<<<<<<<<<<< [ 90% CH4 - 10% H2O ] >>>>>>>>>>>>>>>
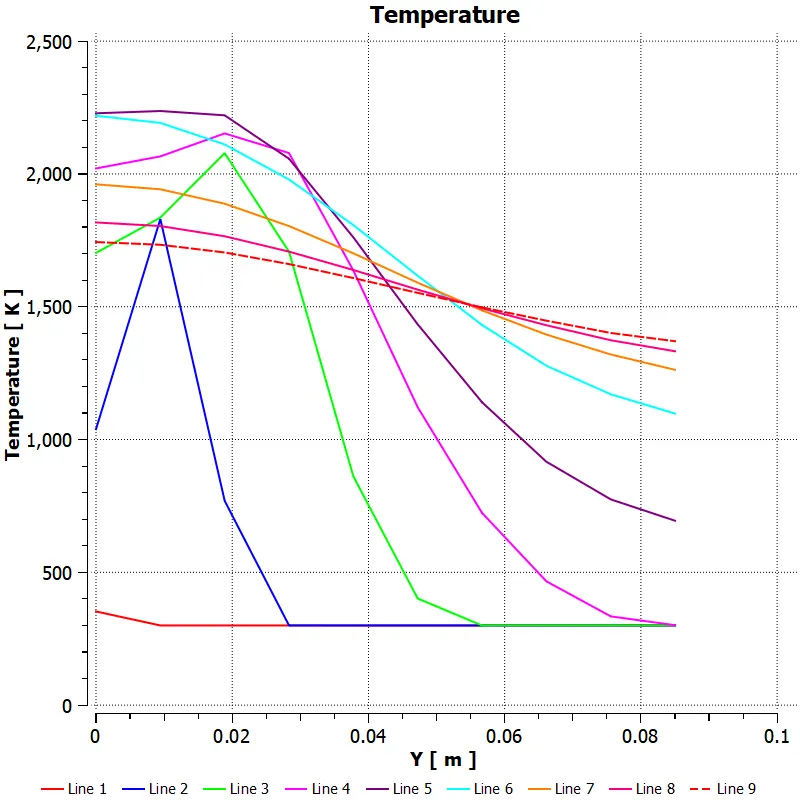
- Temperature
- No pollutant
- Soot

<<<<<<<<<<<<<<< [ 85% CH4 - 15% H2O ] >>>>>>>>>>>>>>>
- Temperature
- No pollutant
- Soot
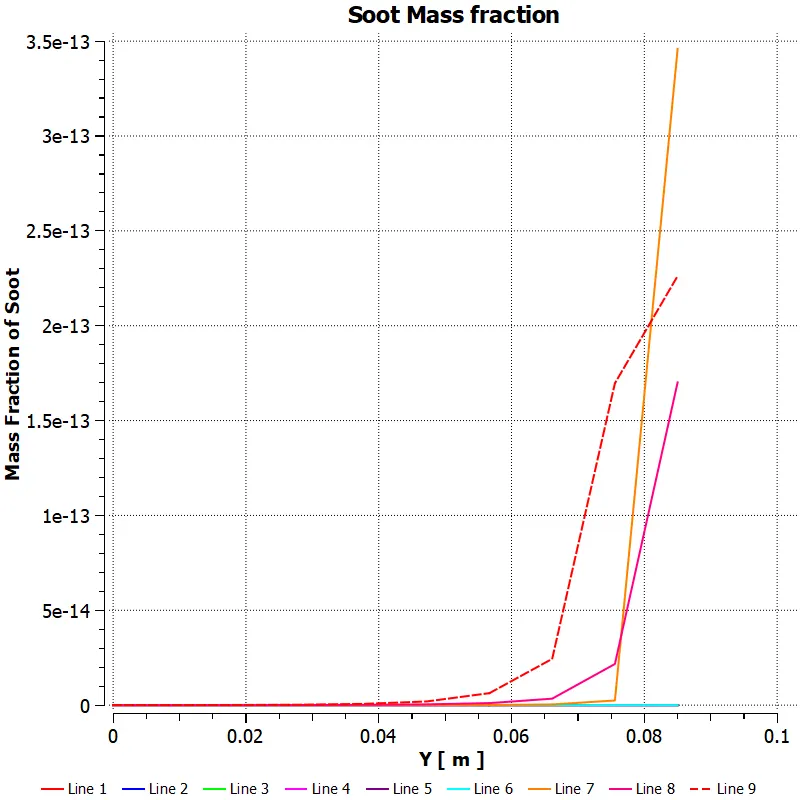

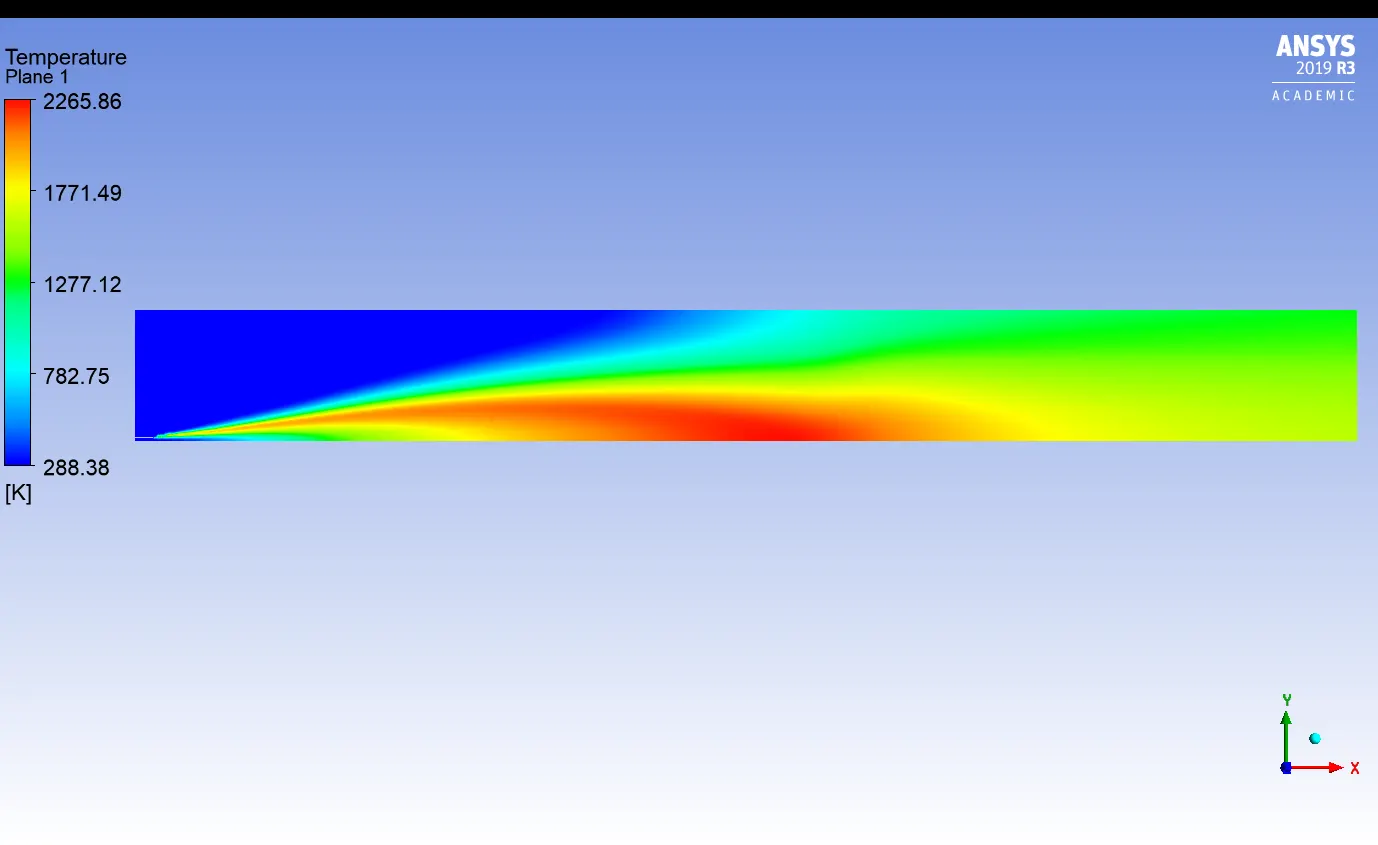
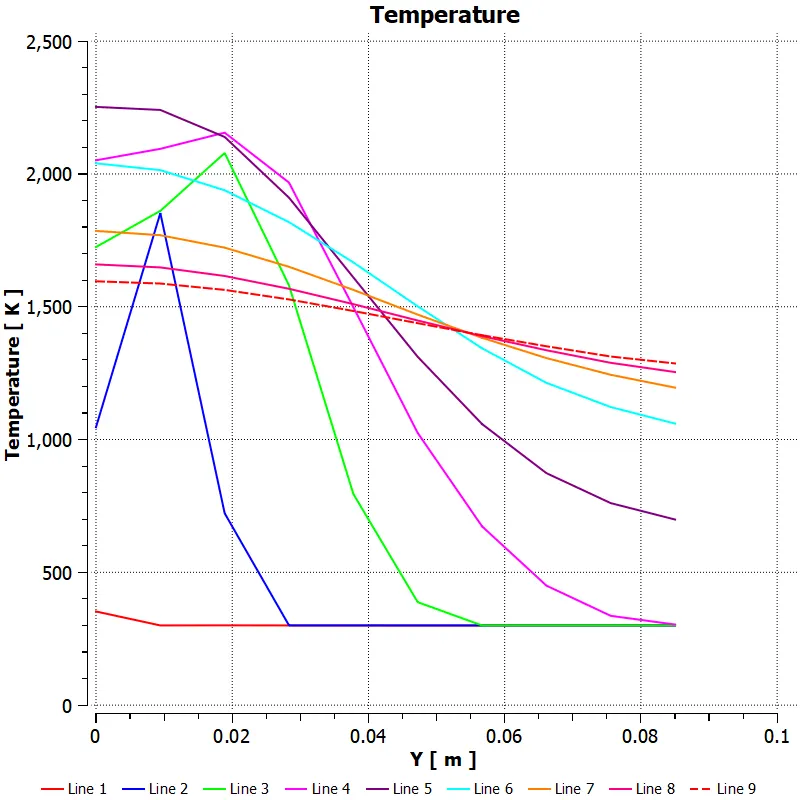
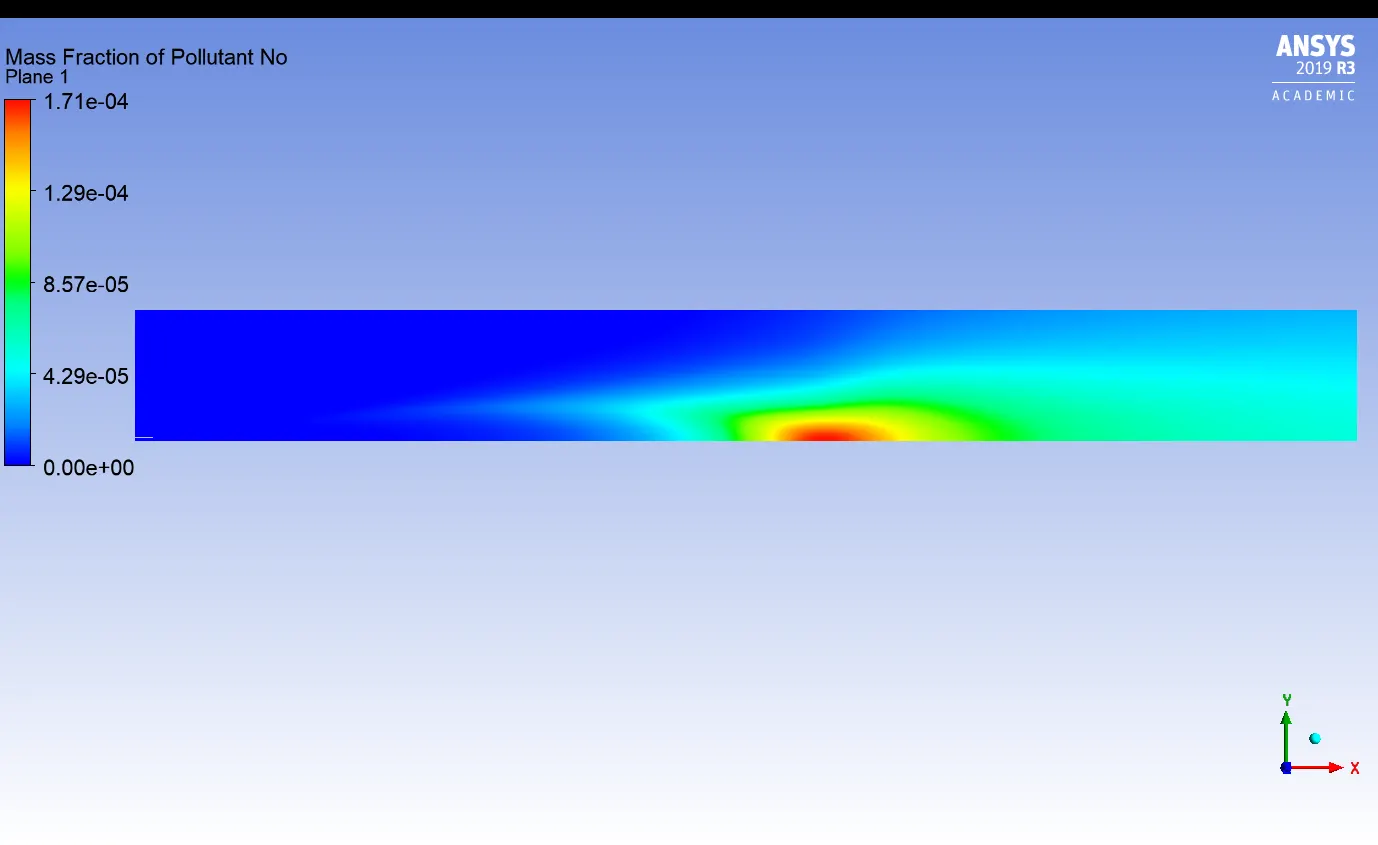
<<<<<<<<<<<<<<< [ 80% CH4 - 20% H2O ] >>>>>>>>>>>>>>>
- Temperature
- No Pollutant
- Soot

<<<<<<<<<<<<<<< [ 75% CH4 - 25% H2O ] >>>>>>>>>>>>>>>
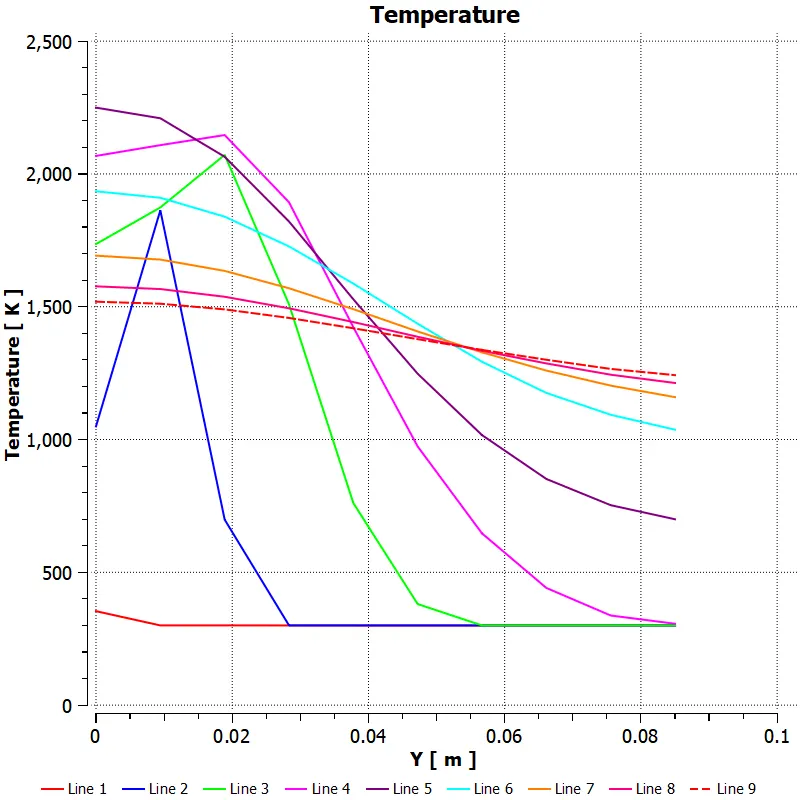
- Temperature
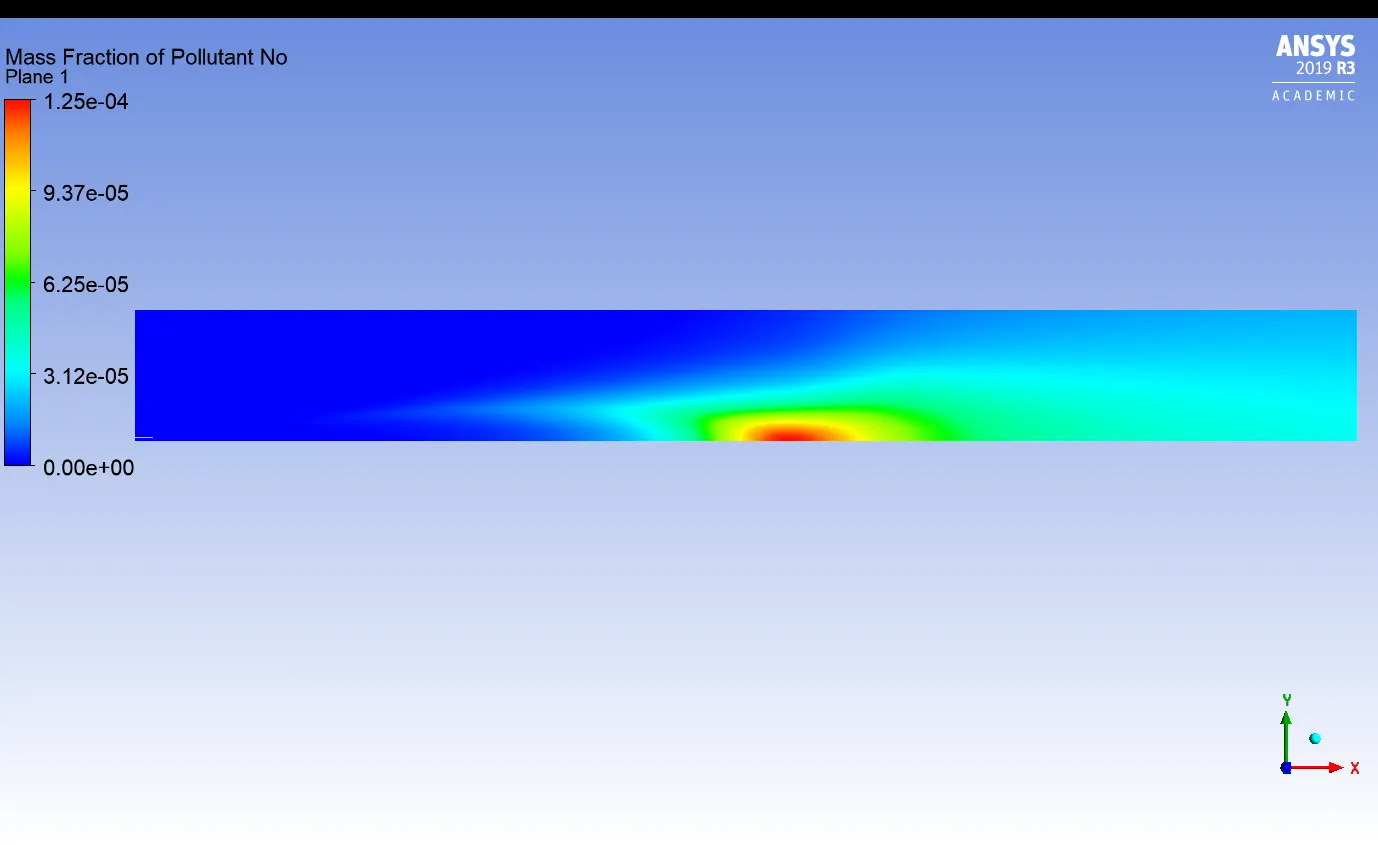
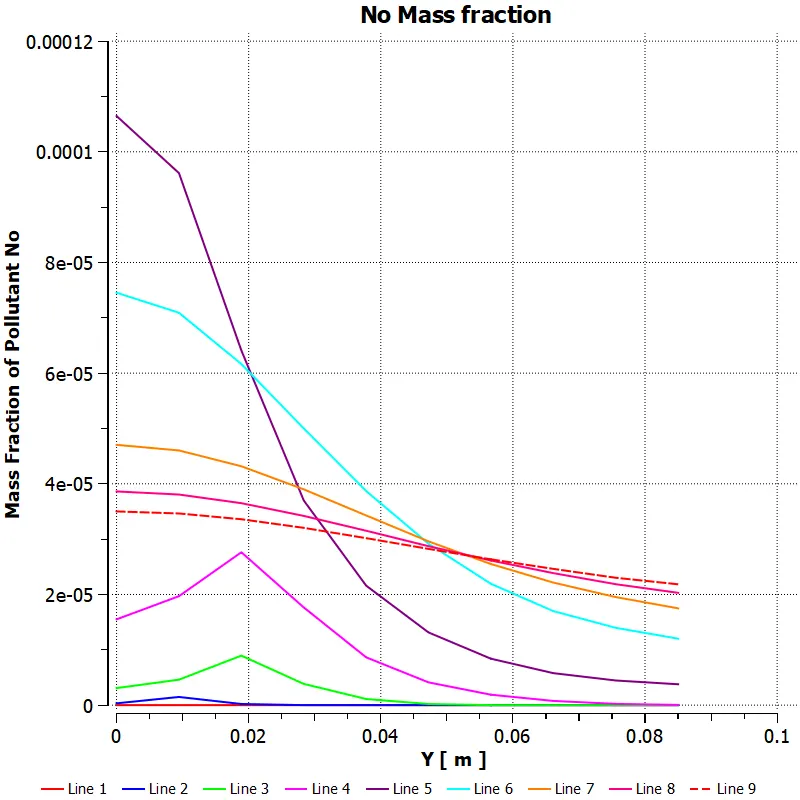
- No Pollutant
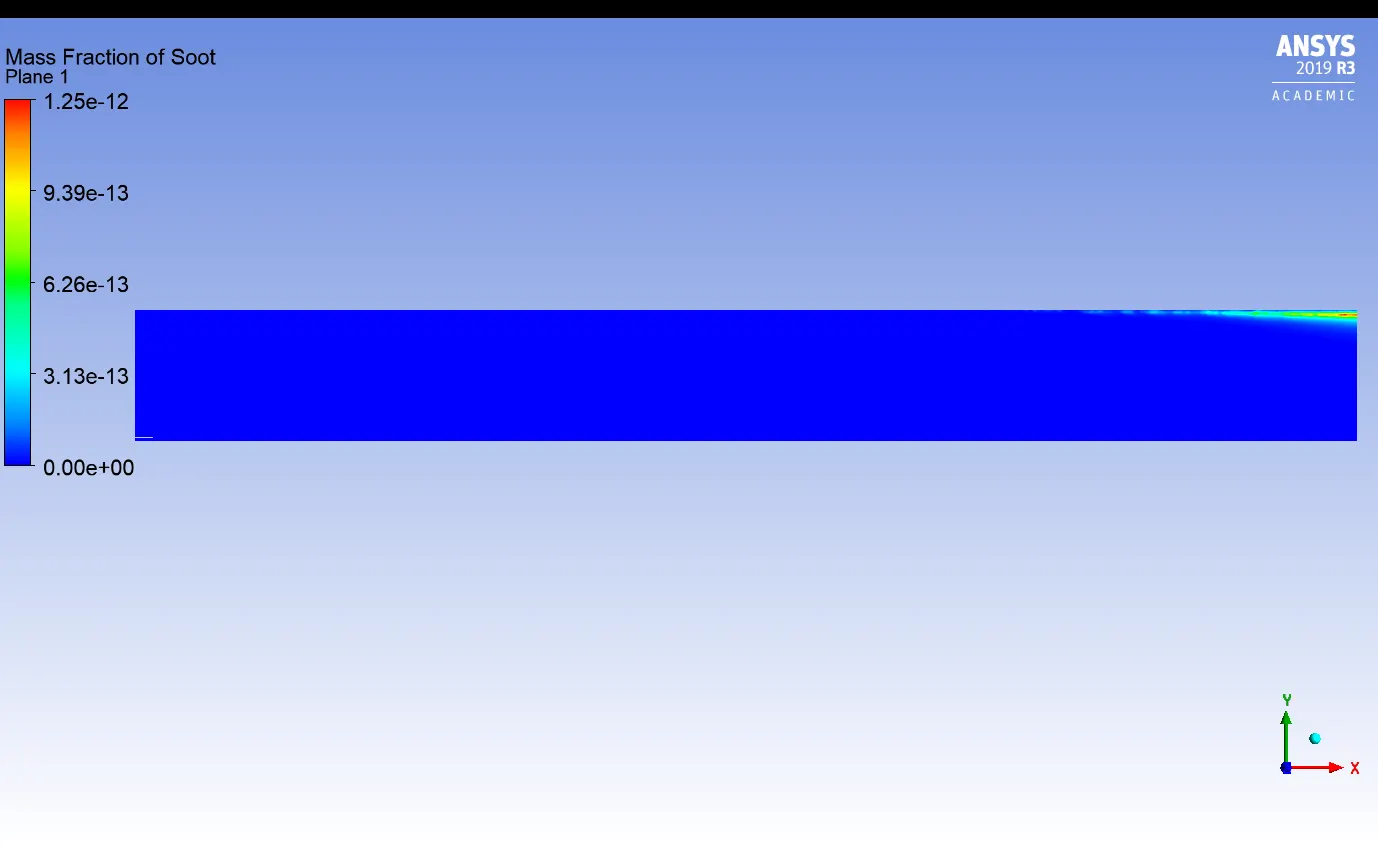
- Soot

<<<<<<<<<<<<<<< [ 70% CH4 - 30% H2O ] >>>>>>>>>>>>>>>
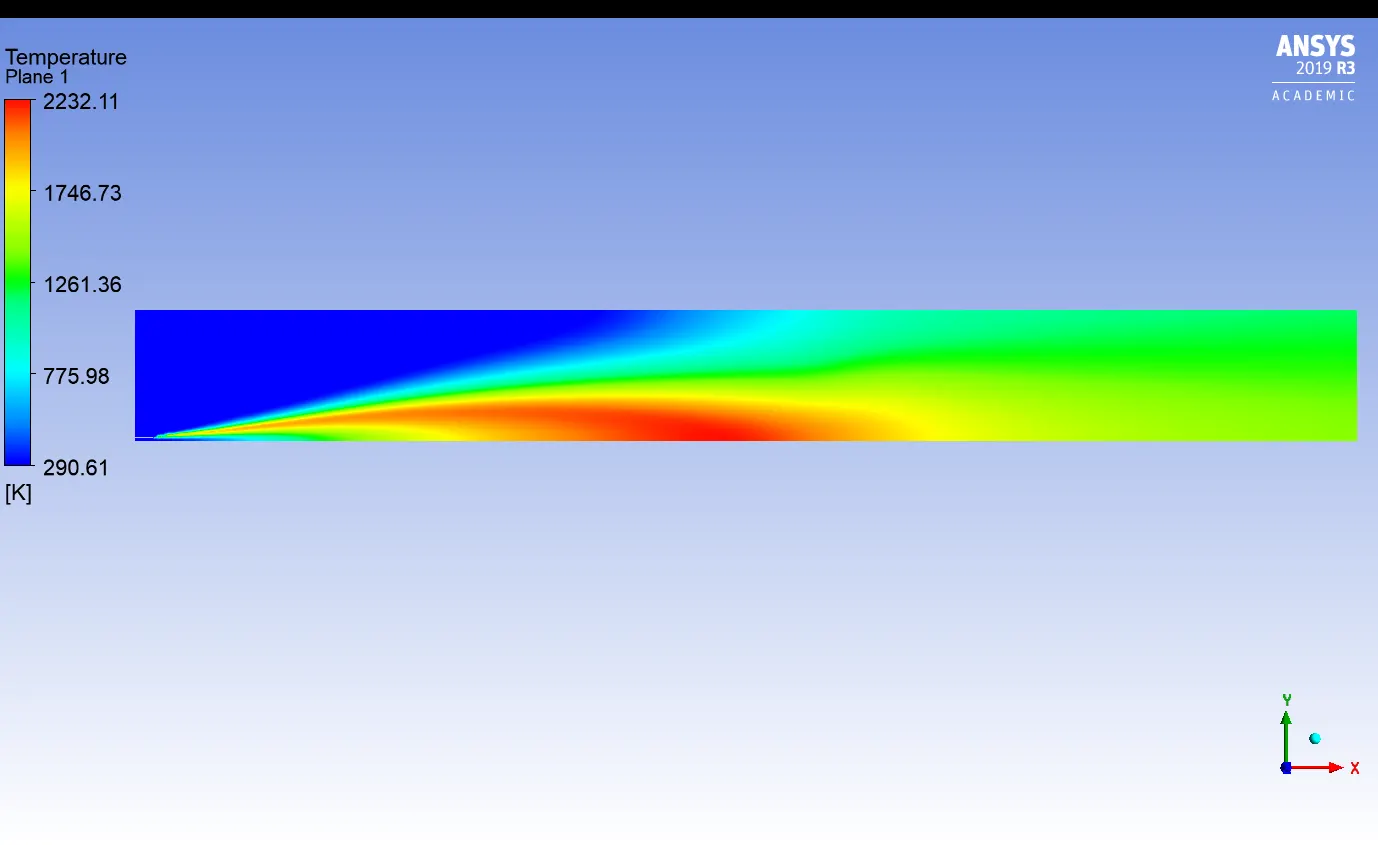
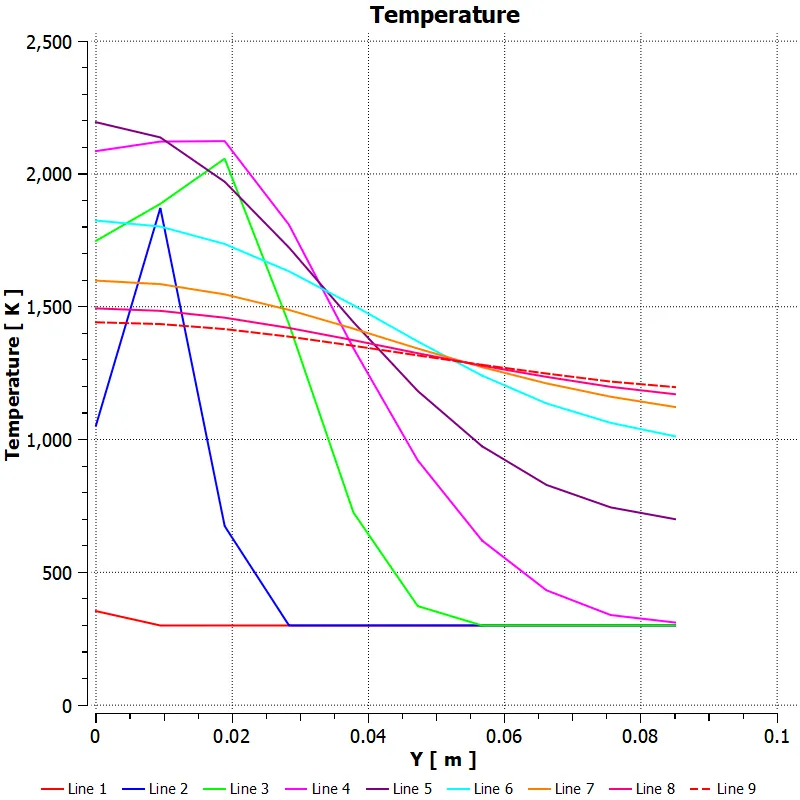
- Temperature
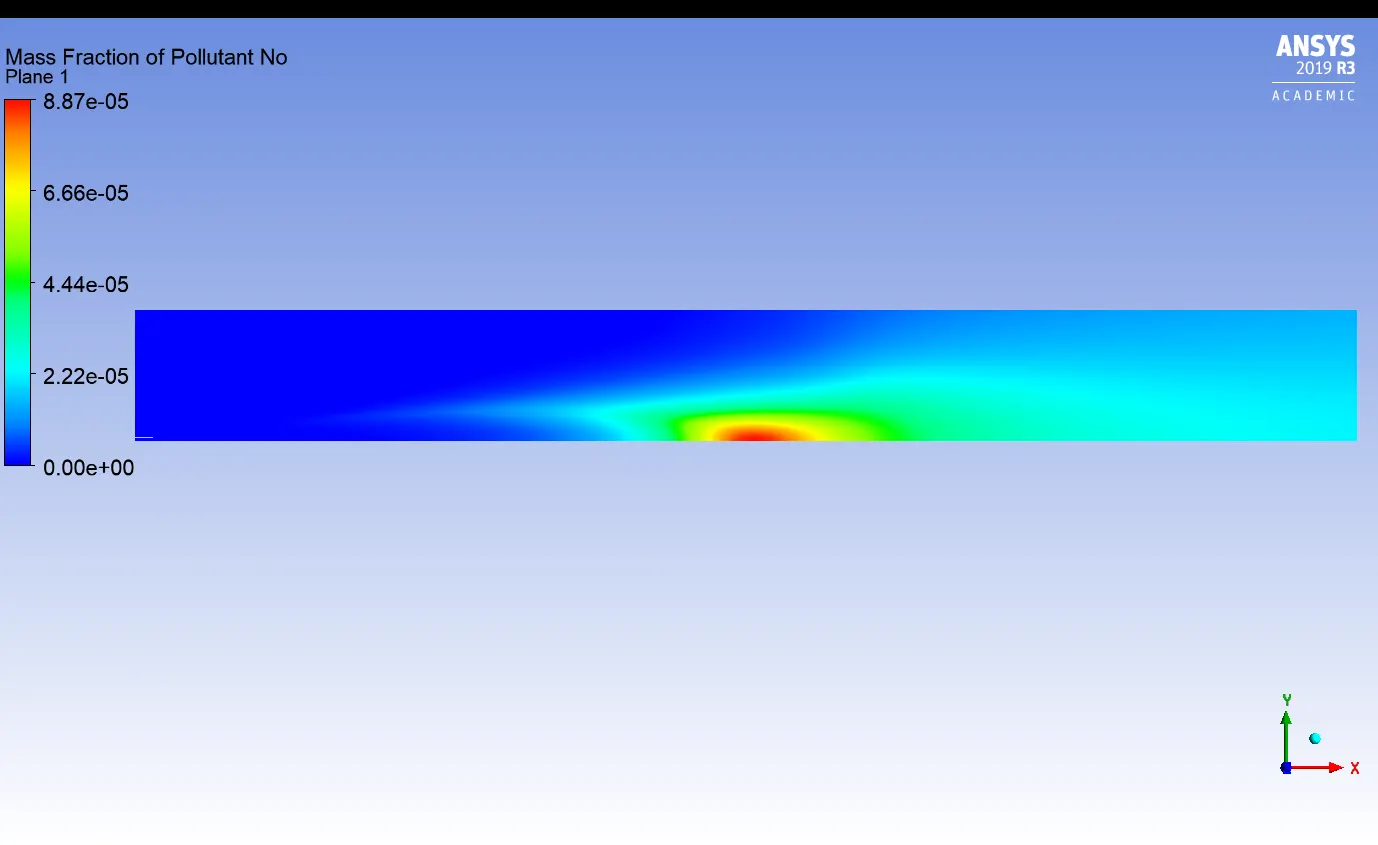
- No Pollutant
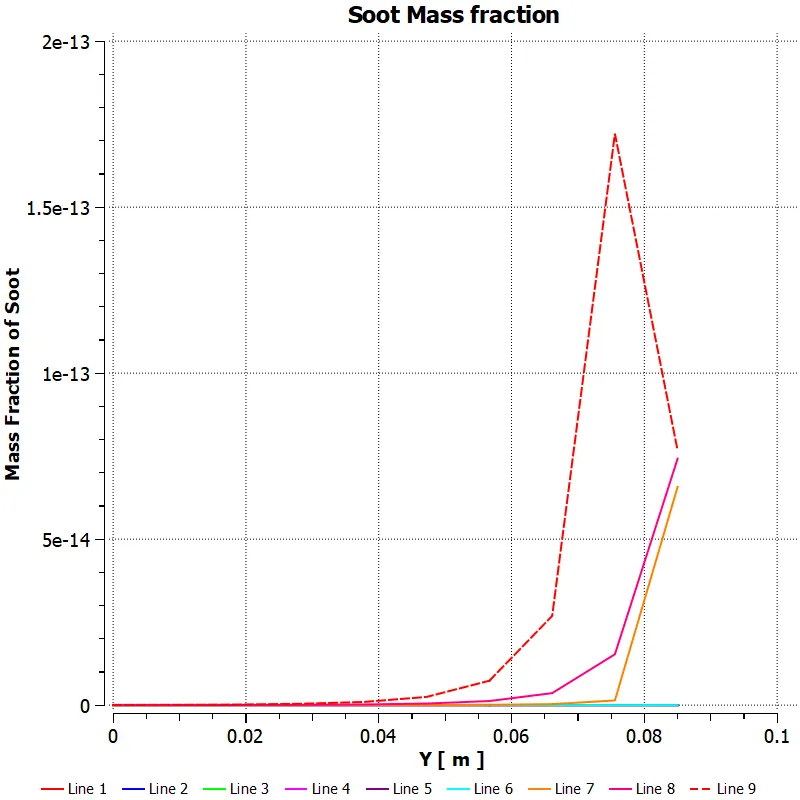
- Soot

Part II Observation table :
Observations :
- We can observe that as the water content is increased, NO pollutant at outlet decreases, ultimately resulting in less harmful emission.
- Same way temperature also decreases.
- We can see that soot formation is e-13 which is very less, also with increase in water percentage, soot at outlet increases.