Challenge 1
Stress-strain curve of concrete is a graphical representation of concrete behavior under load. It is produced by plotting concrete compress strain at various intervals of concrete compressive loading (stress). Concrete is mostly used in compression which is why its compressive stress-strain curve is of major interest.
Straight or Elastic Portion
Initially, all stress-strain curves are fairly straight; stress and strain are proportional. At this stage, the material should be able to retain its original shape if the load is removed. The elastic range of the concrete stress-strain curve continues up to 0.40fck. The slope of the elastic part of the stress-strain curve is the concrete modulus of elasticity. The modulus of elasticity of concrete increases as its strength is increased. IS Code provides equations for computing concrete modulus of elasticity.
Peak Point or Maximum Compress Stress Point
The elastic range is exceeded and concrete begins to show plastic behavior (Nonlinear) when a load is further increased. After the elastic range, the curve starts to horizontal; reaching maximum compress stress (maximum compressive strength). For normal weight concrete, the maximum stress is realized at compressive strain ranges from 0.002 to 0.0035
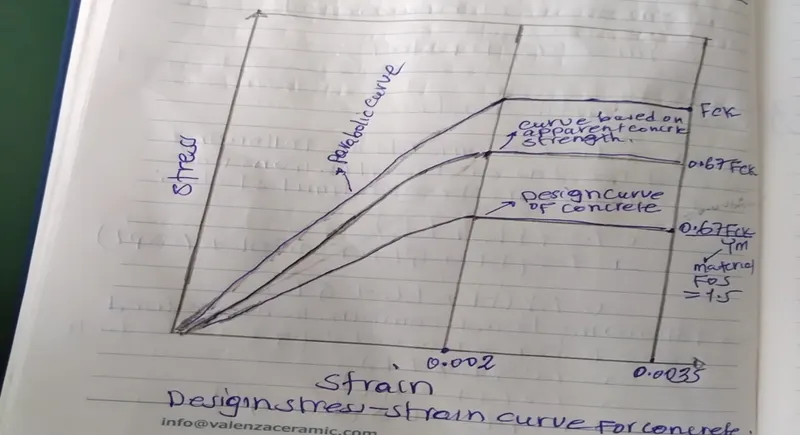
The top curve shows the compressive strength of the standard specimen and it is termed as Fck, While, the next curve shows apparent concrete strength. However, the last curve represents the design curve of concrete which is equal to 0.446 Fck.