Challenge 1
Introduction
Stress-strain curve of concrete
Stress strain curve of concrete is a graphical representation of concrete behaviour under load. It is produced by plotting concrete compressive strain at various interval of concrete compressive loading (stress). Concrete is mostly used in compression that is why its compressive stress strain curve is of major interest. Concrete is a non-homogenous material, which results in nonlinear curve.
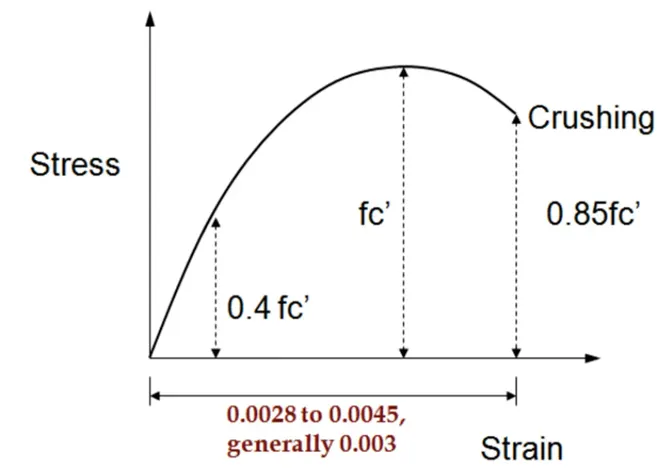
figure 1 : Stress-strain curve of concrete
Elastic Portion
- For the initial portion, stress strain curve is linear.
- The curve is straight, and stress and strain are proportional. With this stage, the material should be able to retain its original shape if the load is removed.
The elastic range of concrete stress strain curve continues up to 0.4fc’ (maximum concrete compressive strength).
When load increases, the stress increases and up to 0.4fc, cracks are stable.
If loads are removed, cracks will close.
- The slope of elastic part of stress strain curve gives concrete modulus of elasticity. The modulus of elasticity of concrete increases as its strength is increased.
Peak Portion
- The elastic range is exceeded, and concrete begin to show non-linear behaviour when a load is further increased.
- When stress > 0.4fc, cracks are unstable (some cracks are permanent). Cracks start propagating. Even if loads are removed cracks are visible and permanent.
- Stress and strain are no longer linear, it varies non-linearly.
- At peak strength fc, strain = 0.002
Descending Portion
- After reaching maximum stress, all the curves show descending trend. The characteristics of the stress strain curve in descending part is based on the method of testing.
- Strain at failure of concrete = 0.003
- Compressive strength of concrete is achieved at strain 0.002, after that it decreases and crushes permanently at strain ranging from 0.003 to 0.0035.
At failure strain, strength is less than maximum compressive strength.
Characteristics of concrete stress-strain curve
For the linear part, Ec is taken as
Ec = 5000 sqrt(fck)
At any point O, if a line is drawn from the origin to O, the slope of the line is secant modulus, Es. If tangent is drawn at point O, it is tangent modulus.
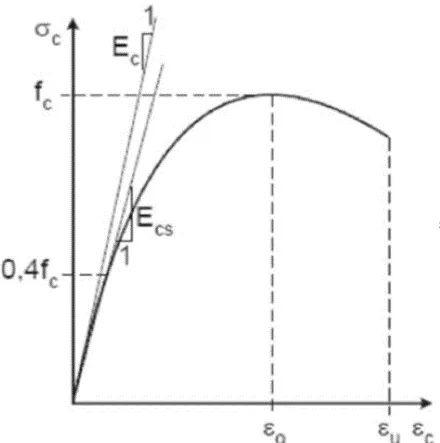
figure 2: Stress-strain curve of concrete
Analytical equation for stress-strain curve
- The parabolic stress-strain curve for concrete has been studied extensively.
- Attempts have been made to develop an algebraic expression for the parabolic stress- strain curve.
- Commonly used algebraic expression for stress vs strain is Modified Hognestad parabola.
Modified Hognestad parabola
- Concrete model proposed by Hognestad is given above. The model is widely being used for stress-strain curve to represent behaviour of normal strength and provided to be a satisfactory model for unconfined concrete.
Ec = tan α.
- In the model, σ - ε curve up to the peak portion assumed a second-order parabola and part of the decline is assumed to be linear. The maximum stress is usually taken as 85% cylindrical strength of concrete (fc = 0.85 fck) and the maximum compressive stress corresponding to strain (εc0) is taken to be 0.002.
- The modulus of elasticity Ec, is proposed to be as in the following equation.
- The part up to the peak of the curve (second degree parabola) can be represented as,
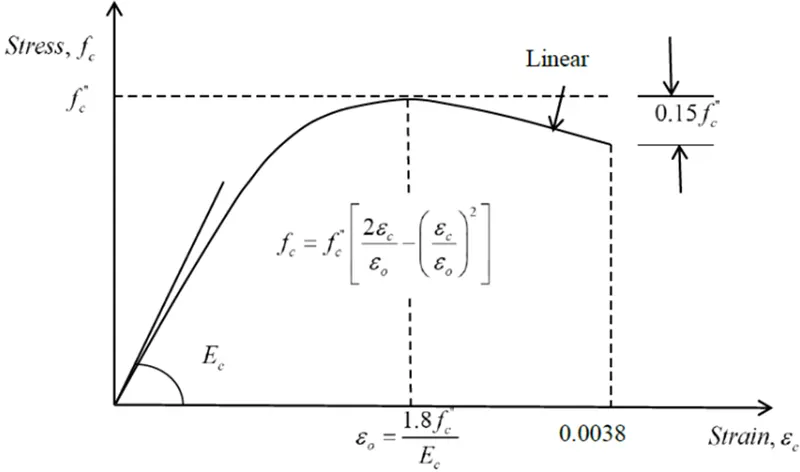
figure 3.Stress-strain curve : Modified Hognestad parabola
Where,
fc = ultimate strength of concrete
εc = strain of concrete at any point
- The above equation covers the region OA in the figure 4.
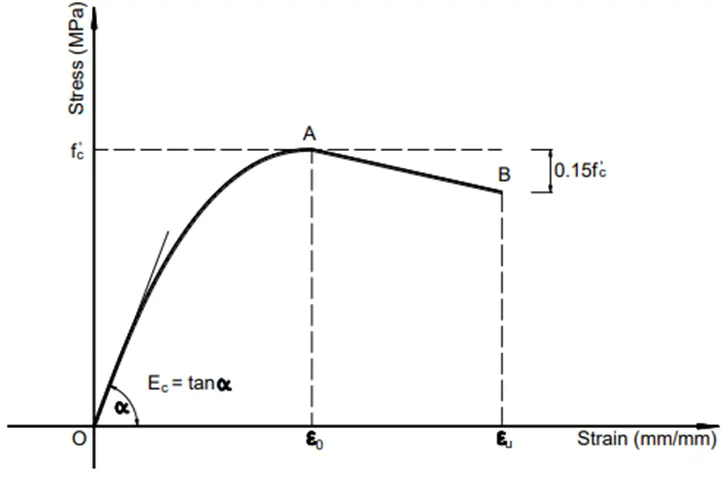
figure 4 :Modified Hognestad parabola
- It is noted that the ultimate compressive strain, εcu can be taken as 0.0038 with 0.85 fc.
- Region AB in figure 4: After the maximum stress, the relation between stress and strain is linear. The stress reduces 15% comparing to fc’ when the strain reaches its ultimate value of 0.0038
- Upto fc”, the curve is parabola and after that it follows a linear trend.
- The Hognestad model includes the damage parameter of concrete. The stress–strain curve before maximum stress reached is a parabola and then the falling branch behavior is adopted depending on the limit of useful strain.
- This model is capable of presenting the behaviour of concrete in compression (confined and unconfined).
- The extent of falling branch behaviour depends on the limit of useful concrete strain assumed. The slope of the line is affected by the amount of confinement, which terminates at a strain of 0.0038.
- One shortcoming of the model is that it ignores the level of confinement provided by the lateral reinforcement. The useful strain in concrete depends on the confinement of concrete.
- This may not be very important in the case of standard steel bar reinforced beams as the level of confinement is low, but for the externally wrapped beams this is a very important factor. It has been observed experimentally that the limiting longitudinal strain can be extended dramatically through external confinement.
Characteristics of stress strain curve of concrete as per IS 456-2000
- IS 456 adopts parabolic-linear stress strain curve for concrete
- Stress-strain relationship is parabolic for strain up to 0.002 and linear afterwards.
- IS code limits strain to 0.002 under direct compression and 0.0035 under flexure.
- The experimental or actual stress strain curve for concrete is very difficult to use in design. Therefore, IS code 456:2000 has simplified or idealized it.
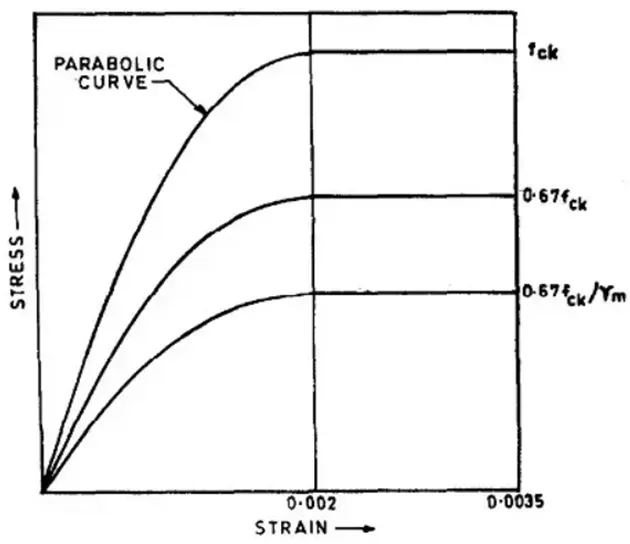
figure 5:stress strain curve as per IS 456-2000
From the curve,
fck is based on actual strength of concrete
- 67 fck based on approximate strength
- 67 fck / γm is the design stress strain curve as per IS 456
- For design purpose, the compressive strength of concrete in the structure in taken as 0.67 times the characteristic strength. The 0.67 factor is introduced to account for the difference in the strength indicated by a cube test and the strength of concrete in actual structure.
- The partial safety factor (γm) equal to 1.5 is applied in addition to this 0.67 factor.
- The initial portion of the curve is parabolic. After a strain of 0.002 (0.2%), the stress becomes constant with increasing load, until a strain of 0.0035 is reached and here the concrete is assumed to have failed.
Assumptions in the limit state of collapse in flexure
- Plane sections normal to the axis remain plane after bending.
- This implies that the bending is negligible as compared to the length of the beam, hence the beam deformations can be ignored.
- The maximum strain in concrete at the outer most compression fibre is taken as 0.0035 in bending.
- The relationship between the compressive stress distribution in concrete and the strain in concrete may be assumed to be rectangle. trapezoid. parabola or any other shape which results in prediction of strength in substantial agreement with the results of test.
- The stresses in the reinforcement are derived from representative stress-strain curve for the type of steel used.
- The maximum strain in the tension reinforcement in the section at failure shall not be less than
- The tensile strength of concrete is ignored
- This is because as soon as the concrete bends the portion of beam under tension develops micro cracks being a brittle material, thereby any contribution by it becomes zero at even very small values of loads.
- Hence the stress diagram for concrete below the Neutral Axis (tension zone) is completely ignored.