Challenge -1
Objective
Compare the results of traction motor power when there is increase in 50% of vehicle mass and 5% increase in Drag coefficent.
File Description
The 1D simulation was carried for Hybrid electric vehicle. The task was provided with 1D simulation file of P0P4 architecture Hybrid electric vehicle. Here two electric motors were coupled to the vehicle. One EM (Electric motor) is coupled directly to the front axle and second EM is coupled with IC Motor (Internal combustion engine / Motor) which is coupled with back axle of the vehicle. As discussed in lecture video, one EM is supporting Engine side (P0 architecture) and one axle is connected to IC engine and another axle connected to EM for traction (P4 architecture). For this reason, the given model is referred as HEV P0P4 architecture.
Mode of operation
As mentioned, file description, HEV draws traction power from both IC with toque assistance and EM. The amount of traction power extraction from motors are managed by SupervisoryController logic. Based on state of motors, the mode of operation is classified as follows
- Rest (Vehicle at rest; no power extraction)
- Electric mode (Vehicle in motion; traction power comes from EM)
- Torque assist (Vehicle in motion, traction power comes from EM and IC)
- Engine starting (vehicle in motion / Starts motion, traction power comes from rear EM)
- Rear Motor Assist Launch (vehicle in motion / Starts motion, traction power comes from rear EM and IC)
- Normal Drive Mode (vehicle in motion, traction power comes from rear EM based on charge available in Battery, IC)
The mode of operation is controlled by logic by user or designer preference considering various aspects such as charge availability, emission, torque request, design parameters, etc., This logic will control and select the mode of operation for the torque requestion by the driver. In the figure shown in below, list the logic considered for selection of mode operation.
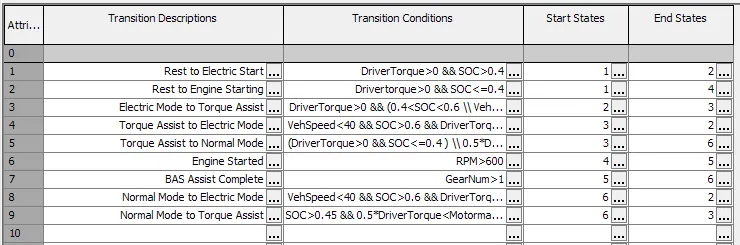
The fraction factor for initial state of charge of battery is consider as 0.65.
Motor traction study
As mentioned in the objective, the task is to compare how the traction power of motor changes for vehicle mass increase by 50 % from given mass 2721 kg and drag coefficient increase of 5% from given value of 0.308.
Such comparison should be run as different case setup / parametric simulation in order to compare the results simultaneously and to save time. The given case file already includes vehicle mass as parameter by keyword [VEHMASPARAM]. But vehicle drag coefficient is not defined as parameter. Therefore, it is converted to parameter with keyword [vehDragCoeff]. Thus, we setup two cases :
- Case 1 Vehicle mass = 2721 kg, Vehicle Drag coefficient = 0.308
- Case 2 Vehicle mass = 2721 kg x 1.5 = 4081.5 kg , Drag coefficient = 0.308 x 1.05 = 0.3234
The above cases were tested with drive cycle FTP75_kph, which comprises of speed data for 1874 seconds. But the simulation ran for 1500 seconds as per the simulation duration time setup in the simulation run wizard.
Result Analysis
The effect of change of vehicle mass and drag coefficient will be discussed in various aspects to understand the effect Brake power / traction power of motor.
Torque Requirement
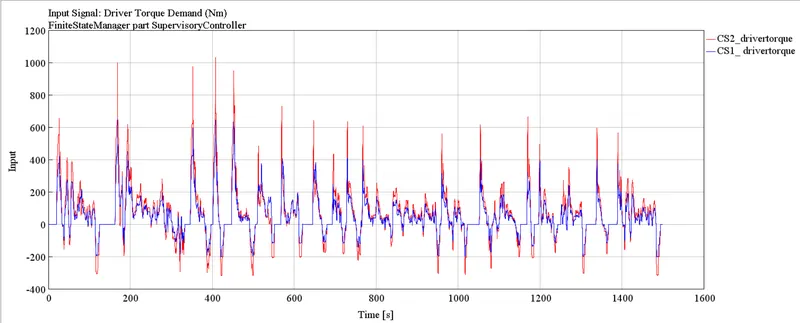
From the above figure it is obvious that the increase in vehicle mass and drag coefficient demand more Torque for given drive cycle. Roughly we can estimate the torque request demand is 66.6%.
Mode of Operation
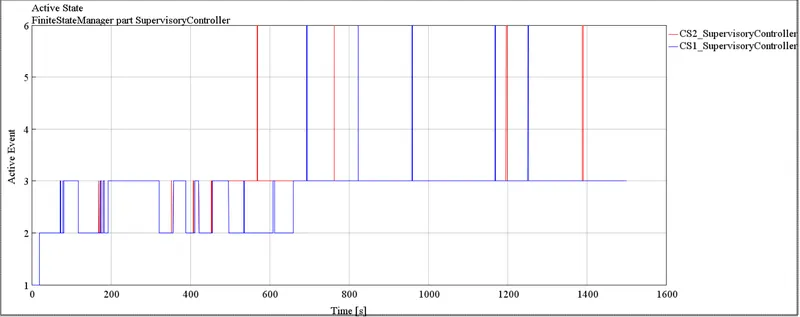
From the plot it is obvious that the change in vehicle mass and drag coefficient has effect on the mode of operation of vehicle.
State of Charge
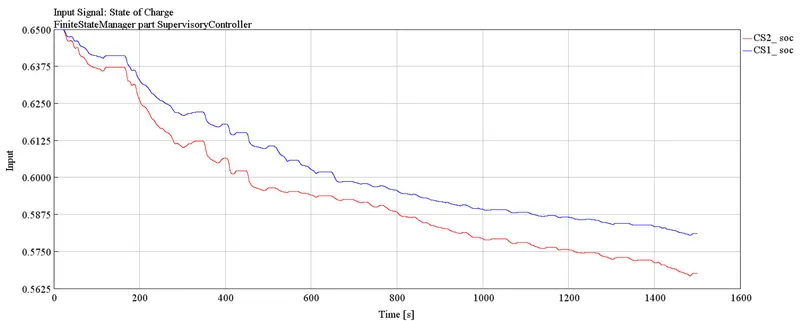
From the state of charge plot, we can infer that increased value of load and drag coefficient, SOC of battery decreases. In this case, it is 2% approximately.
Traction power Front Motor
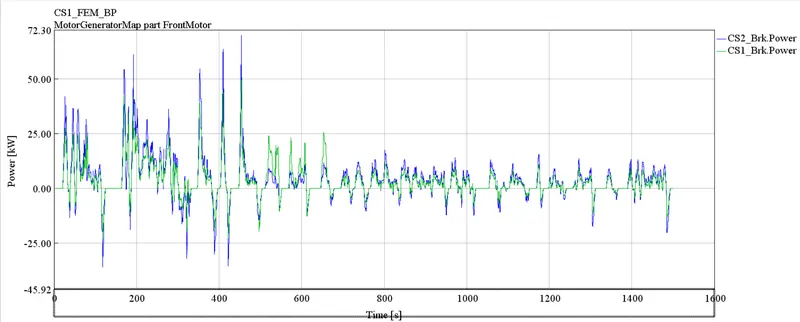
Data comparison of traction power of front motor shows that power cycle demands approximately 43% more torque at certain mode of operation.
Traction power Rear motor
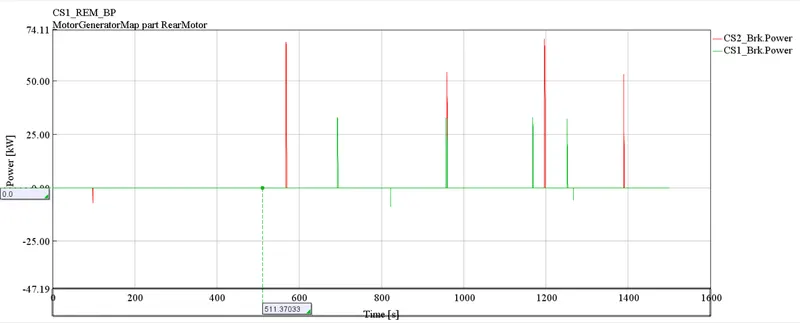
From the above plot we can infer that the Electric motor coupled with engine the brake power is more in case 2 than case 1.
Traction Power of IC
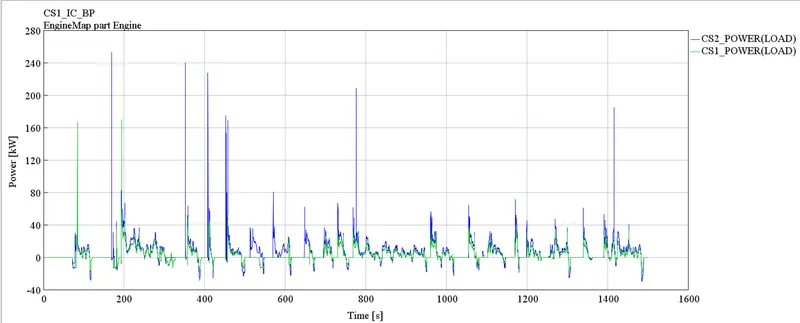
From the plot we can observe that the maximum traction power of IC for case 1 is 163 KW (approx.) and for case 2 is 243 KW (approx.)
However, the effect weight increase and drag coefficient increase on each parameters should be studied individually to predict the sensitivity of vehicle mass and drag coefficient on these parameters.
Based on the sensitivity study, the designer can work on Powertrain design if the sensitivity of drag coefficient is less. If the designer finds the sensitivity is high for drag coefficient also, he should work on aerodynamic design changes of vehicle. For clear data analysis, data should be averaged and then comparison should be made.
This report only discusses about comparison of output change between case 1 and case 2. With more time and data, one could analyse the behaviour of each motor under the resulted load condition and could evaluate detailed performance and functional study.
| Abbreviation | Description |
| EM | Electric machine / Electric motor |
| IC | Internal combustion Engine |
| HEV | Hybrid electric Vehicle |
| FTP | Federal Test Procedure |
| SOC | State of charge |
| CS1 | Case setup 1 / Case 1 |
| CS2 | Case setup 2 / Case 2 |
| KW | Kilowatt |
| approx. | approximate |