Centrifugal pump design and analysis
AIM :
To model the Centrifugal pump.
To perform flow simulation to obtain the pressure and mass flow rate at outlet
To obtain the performance diagram i.e relationship between Pressure ratio and mass flow rate
INTRODUCTION :
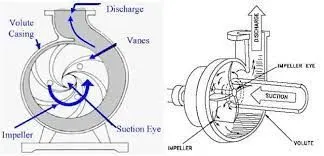
Centrifugal pump :
Centrifugal pumps are used to transport fluids by the conversion of rotational kinetic energy to the hydrodynamic energy of the fluid flow. The rotational energy typically comes from an engine or electric motor. They are a sub-class of dynamic axisymmetric work-absorbing turbomachinery. The fluid enters the pump impeller along or near to the rotating axis and is accelerated by the impeller, flowing radially outward into a diffuser or volute chamber (casing), from which it exits.
Common uses include water, sewage, agriculture, petroleum, and petrochemical pumping.
METHODOLOGY :
MODELLING :
The impeller,casing, inlet and oulet duct are designed as attached below :
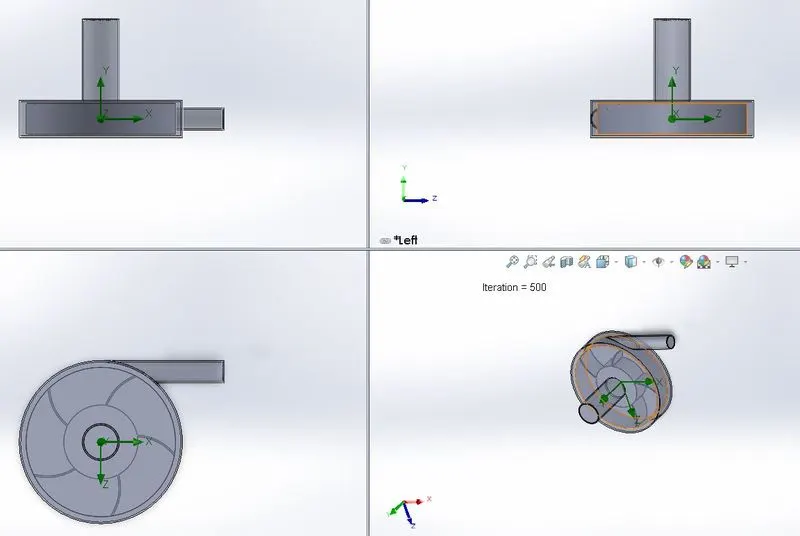
A region is created for installing it in the simulation which is viewed as solid view in the attachment while the other components are in transparent view.
FLOW SIMULATION :
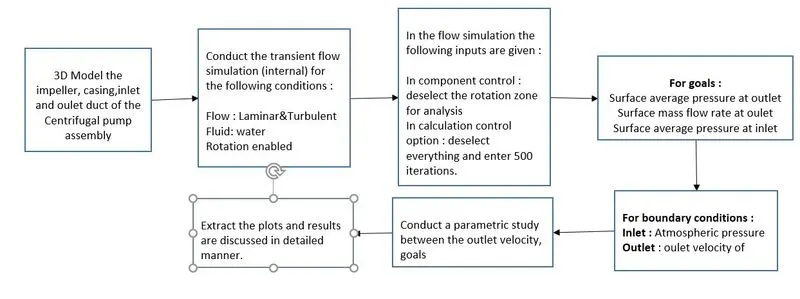
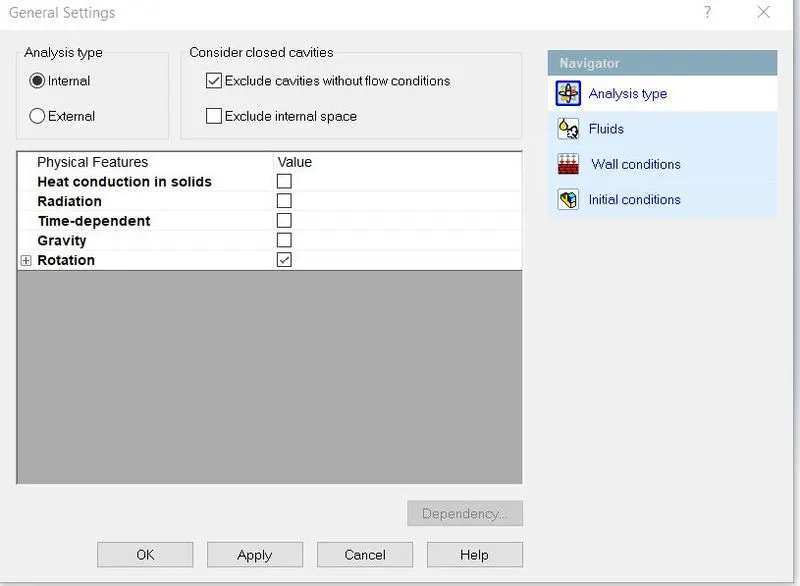
Flow simulation inputs are as follows :
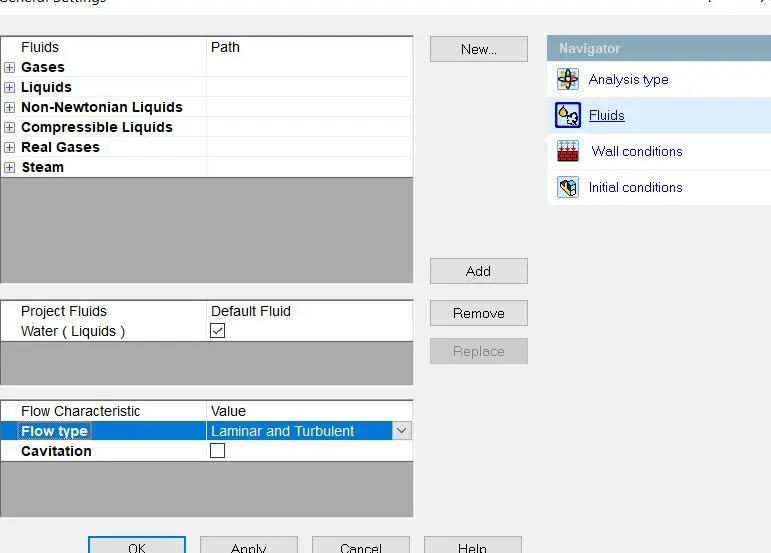
Type : Internal
Fluid : Water
Rotation input is given
Additional inputs :
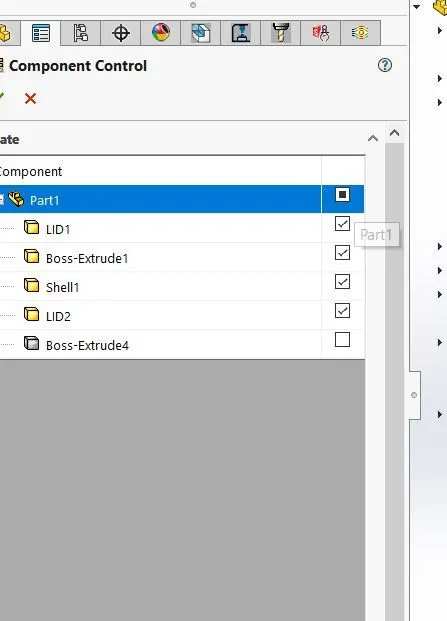
Input data > Component control : Extrude done for rotational zone is deselected.
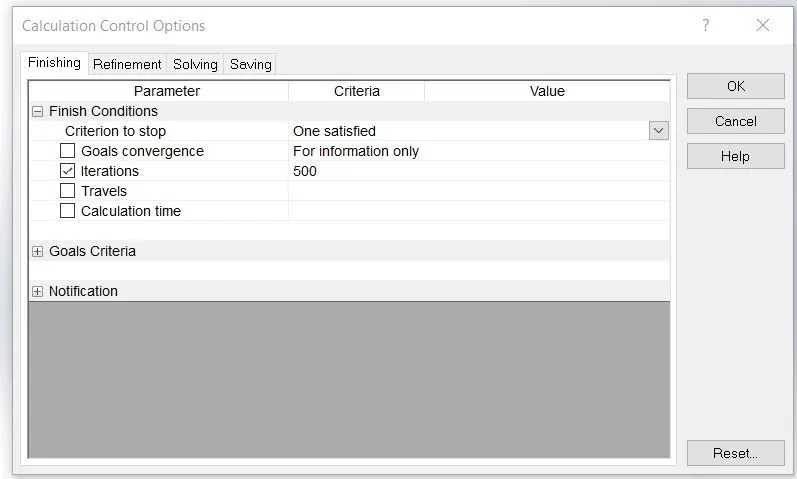
Input data > Calculation control : All conditions are deselected and iterations option is selected only with 500 iterations as input.
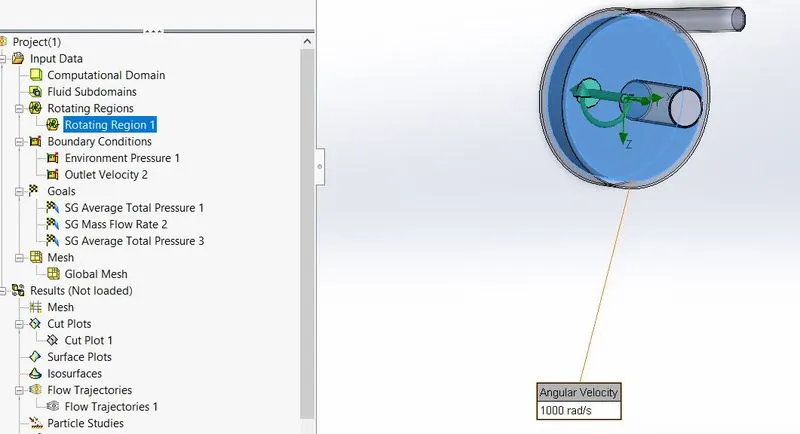
Roational Regions : Select the extrude and angular velocity of 1000 rad/s is given.
In Boundary conditions :
Inlet lid > Atmospheric pressure
Oulet lid > Outlet velocity > 10m/s
In Goals :
Goals > Surface Average Total pressure at oulet
Goals > Surface Average Total pressure at inlet
Goals > Mass flow rate at oulet
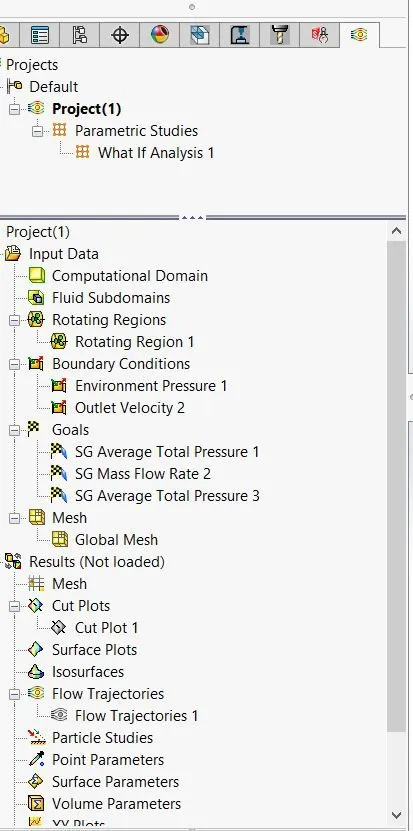
Parametric study between Outlet velocity, goals :
A parametric study is conducted between the outlet velocity, Surface Average Total pressure at outlet, Surface Average Total pressure at inlet, Mass flow rate at oulet
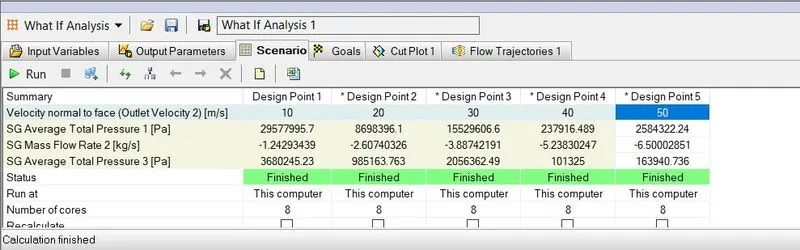
At outlet velocity of 10m/s :
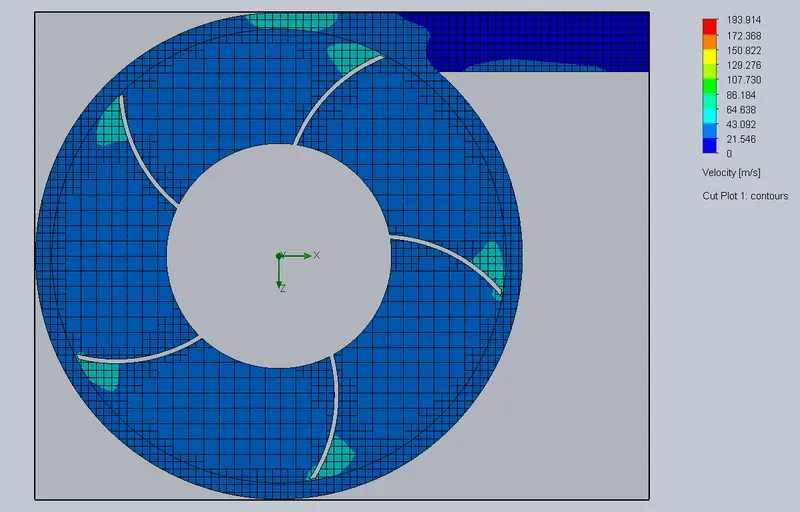
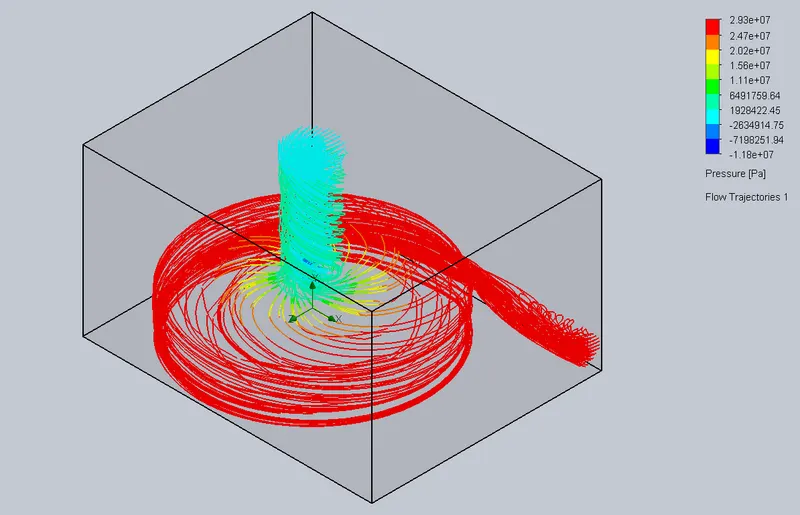
Velocity cut plot Flow trajectories
At outlet velocity of 20 m/s :
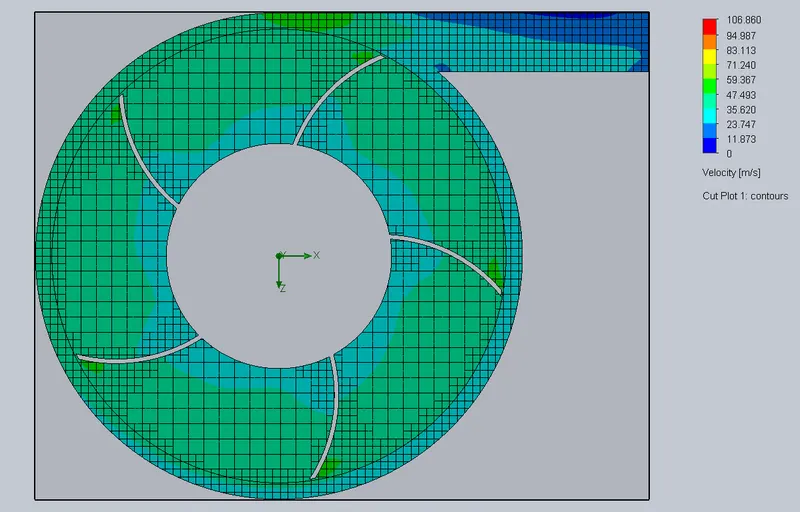
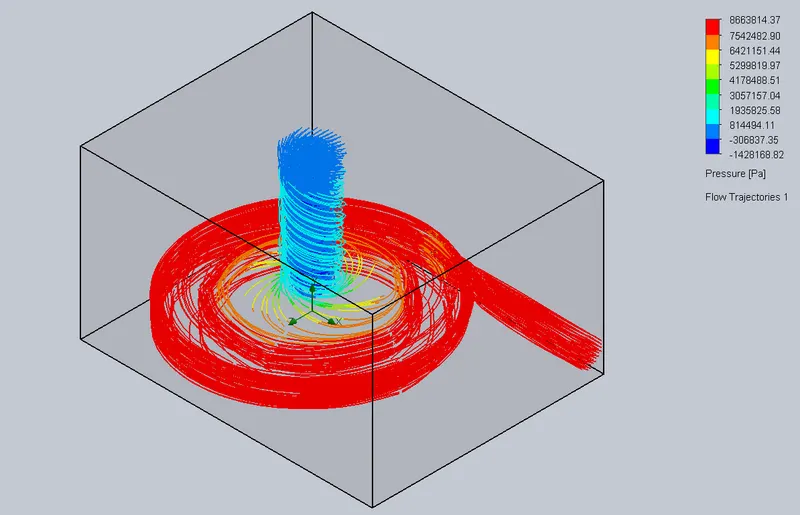
Velocity cut plot Flow trajectories
At outlet velocity of 30 m/s :
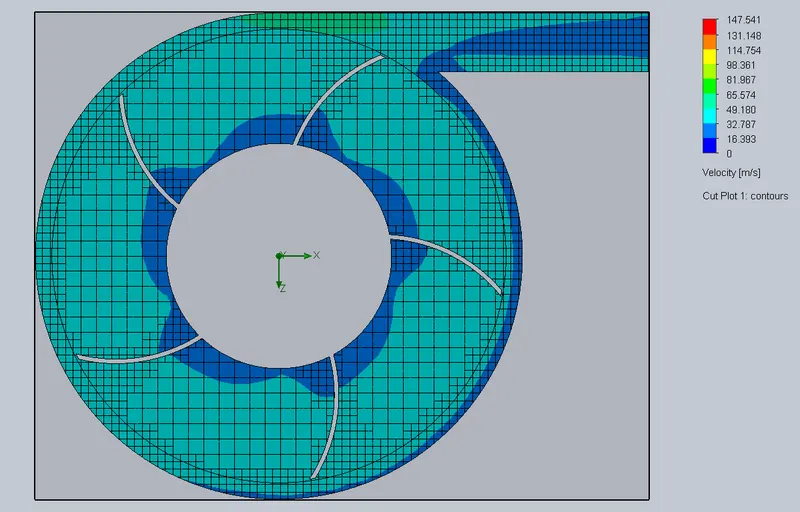
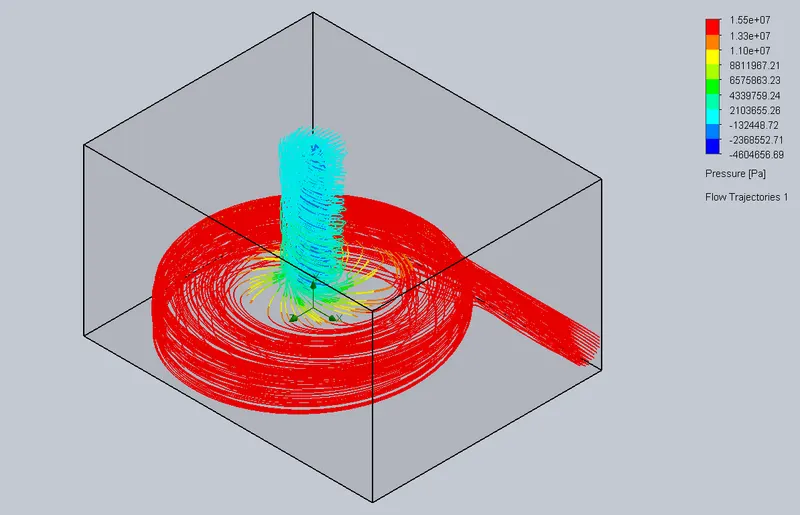
Velocity cut plot Flow trajectories
At outlet velocity of 40 m/s :
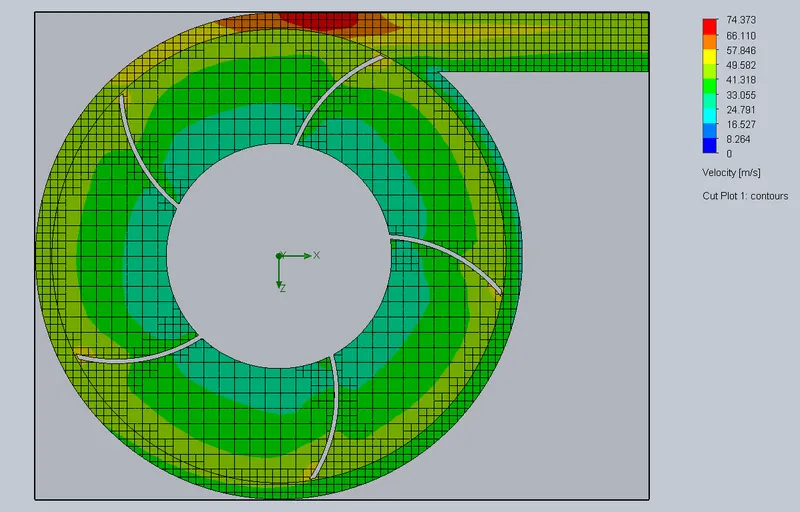
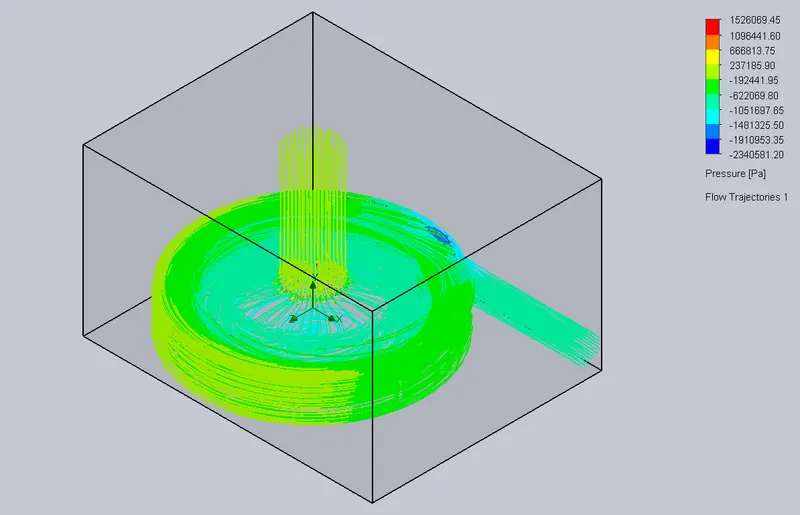
Velocity cut plot Flow trajectories
At outlet velocity of 50 m/s :
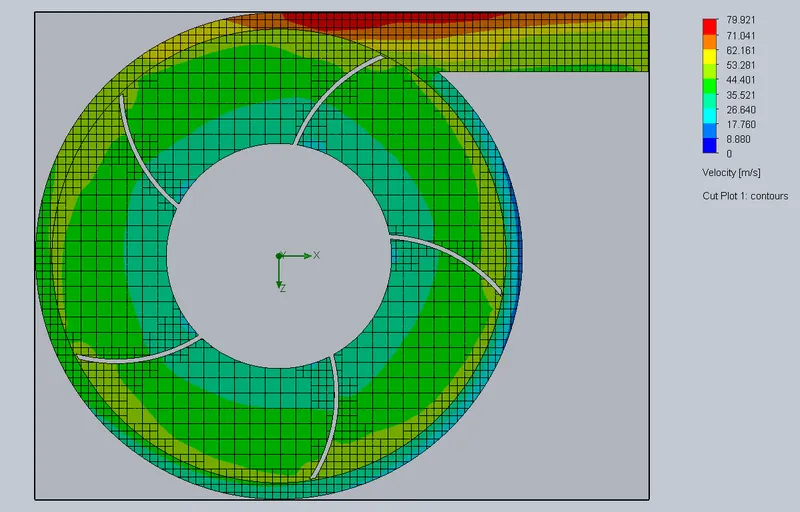
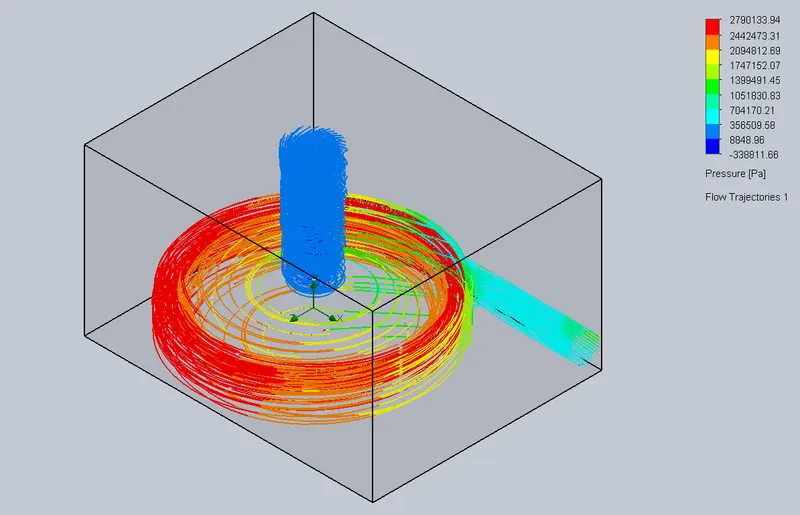
Velocity cut plot Flow trajectories
Results and discussions :
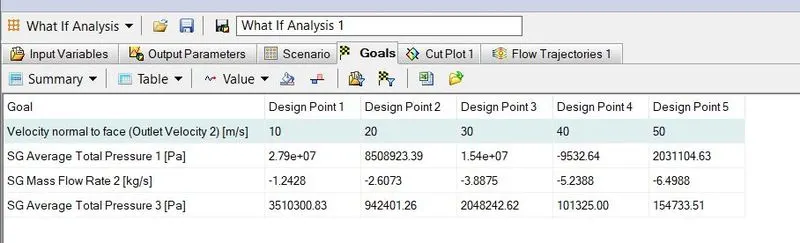
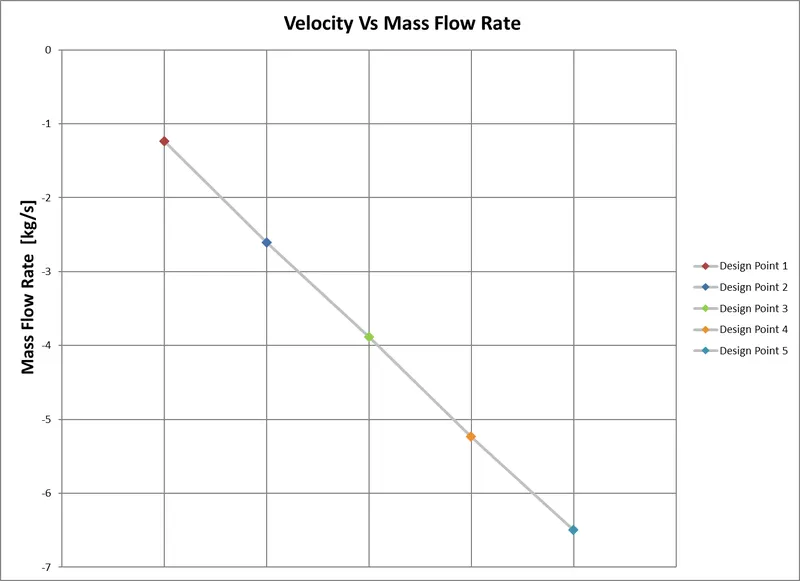
Velocity Vs Mass flow rate
Performance Curve :
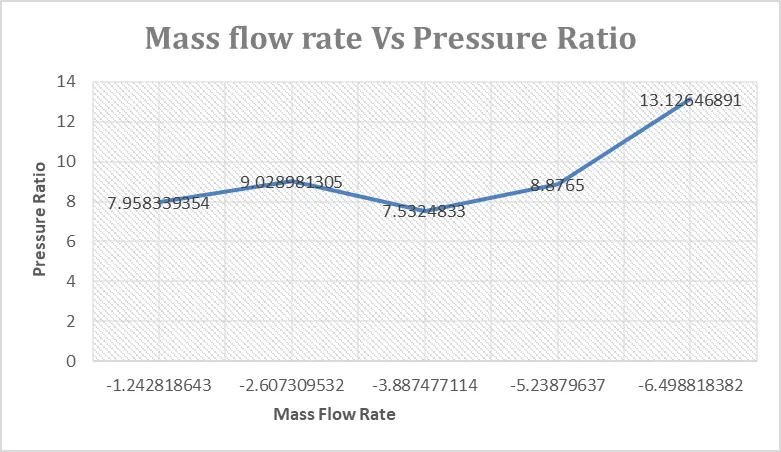
From the results and relations it is found that the increase in velocity increases the mass flow rate proportinally while the pressure ratio inversely and its is fully evident in the graphs attached.