Calculating Drag Force Flow Over Bicycle using Python
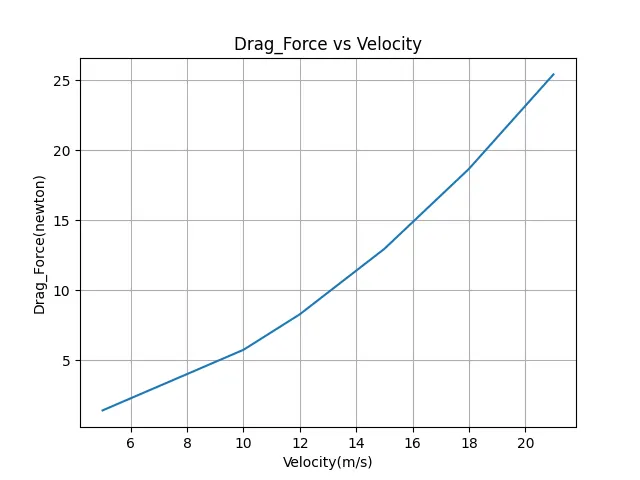
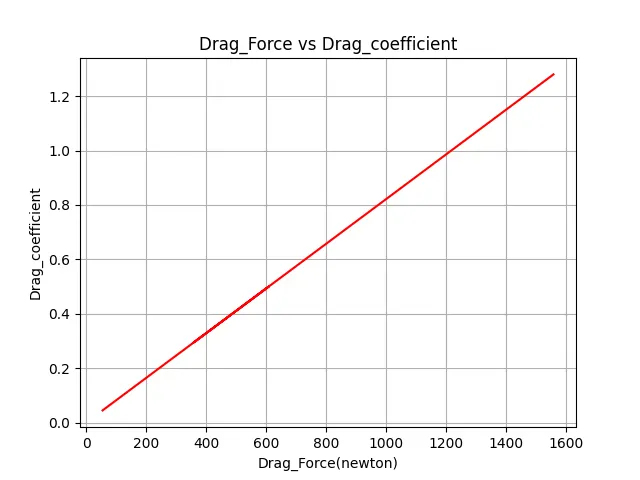
An object of the Project:- In this project, we are going to calculate the drag force over a bicycle using “Python” programming and draw the plot of Drag Force v/s Velocity and Drag Force v/s Drag Coefficient.
Definition of Drag Force: - A drag force is the resistance force caused by the motion of a body through a fluid, such as water or air. A drag force acts opposite to the direction of the oncoming flow velocity. This is the relative velocity between the body and the fluid. In other words, drag force is nothing but a type of resistance opposing the moving body.
The formula of Drag Force: -
`F_d = 1/2rhoAC_dV^2`
Where:-
``F_d = "Drag Force"``
`rho = "Density of Medium"`
`A = "Frontal Area"`
`C_d = "Drag Coefficient"`
`V = "Velocity"`
Main Program: -
#Calculating Drag_Force
#Formula F_d = 0.5*rho*A*C_d*V^2
import matplotlib.pyplot as plt

A = 0.12    #A = Frontal Area (m^2)
rho = 1.2   #rho = Density (kg/m^2)
C_d = 0.8   #C_d = Drag coefficient (Unit less)
V = [5, 10, 12, 15, 18, 21]  #List of Velocity(m/s)
F_d = []    #list of Drag Force (newton)
for a in V:
    Drag_Force = 0.5*rho*A*C_d*a**2
    F_d.append(Drag_Force)

#Create the plots between drag force against the velocity
plt.figure('Drag_Force vs Velocity')
plt.plot(V,F_d)
plt.xlabel('Velocity(m/s)')
plt.ylabel('Drag_Force(newton)')
plt.title('Drag_Force vs Velocity')
plt.grid()

#Different Drag-coefficient of Different Shapes
C_d_Bullet = 0.295
C_d_Sphere = 0.5
C_d_Airfoil = 0.045
C_D_Prism = 1.14
C_d_Plate = 1.28        #All the Drag_coefficient take form (https://www.grc.nasa.gov/www/k-12/airplane/shaped.html)
Drag_Coff = [C_d_Airfoil, C_d_Sphere, C_d_Bullet, C_d, C_D_Prism, C_d_Plate]    #List of drag coefficient
v = 130 #Velocity (m/s)
D_f = []    #List of darg_Force According to Differnt Drag_coefficient
for c in Drag_Coff:
    Drag_Force1 = 0.5*rho*A*c*v**2
    D_f.append(Drag_Force1)

#create plot between drag forces against the drag coefficient
plt.figure('Drag_Force vs Drag_coefficient')
plt.plot(D_f,Drag_Coff,color='red')
plt.xlabel('Drag_Force(newton)')
plt.ylabel('Drag_coefficient')
plt.title('Drag_Force vs Drag_coefficient')
plt.grid()
plt.show()
Problem Statement:-
- I faced problem in getting different values of Drag-coefficient.
- When I executed the program, I faced problem that both plots were shown in one figure window.
Solution: -
- I got different values of drag coefficient from https://www.grc.nasa.gov/www/k-12/airplane/shaped.html
- For plotting plots in different windows, got a solution from Skilllynce’s book – E-book for Python.
Result: -