Basics of Probability and Statistics Week 1 Challenge
Q.1 Why there is a difference in the formula of variance for population and sample
- Variance is calculated as the average sqaured deviation from the mean.
- variance of population calculates by using following formula
`sigma^2 = sum (X_i - mu)^2 div N`
where,
`sigma^2` = population variance
`X_i`= The value of the one observation
`mu`= population mean
`N`= population size
- variance of sample calculates by using following formula
`s^2 = sum(X_i - bar X)^2 div (n-1)`
where,
`s^2`= sample variance
`X_i`=The value of the one observation
`bar X`= sample mean
`n`= sample size
- We can see there is very little difference in calculation of variance , when we calculate population variance, we then divide sum of squared deviations from the mean by the population size(N).But for sample variance we divides sum of squared deviation from the sample mean by the sample size less one(n-1).
-
The purpose of doing this is to get a better and unbiased estimate of population's variance (by dividing by (n-1), we compensate for the fact that we are working only with sample not with whole population).
-
Actually, here we are trying to match our sample variance nearest to the population variance by lowering the denominator value, so that value of sample variance increases.
- Let us understand it by example
- population = 1,3,7,8,9,11,13,17,20,20
- populattion size (N)= 10
- Claculate population variance
- `u`=(1+3+7+8+9+11+13+17+20+20) / 10
`u`=10.9
- population variance
- `sigma^2 = (sum (1-10.9)^2+(3-10.9)^2+(7-10.9)^2+(8-10.9)^2+(9-10.9)^2+(11-10.9)^2+(13-10.9)^2+ (17-10.9)^2+(20-10.9)^2+(20-10.9)^2) div 10`
`sigma^2 =39.49`
- standard deviation =`sigma`=6.284 for population
- choose sample from above population = 3,8,11,13,20
- sample size (n)= 5
- calculating sample variance and standard deviation for sample
- `bar X = (3+8+11+13+20) div 5`
`bar X = 11`
- sample variance =`sigma^2 =((3-11)^2+(8-11)^2+(11-11)^2+(13-11)^2+(20-11)^2) div 5`
`sigma^2 =`31.58
- standard deviation = `sigma`=5.62 for sample when we take n in the denominator
- Now check the Variance for both cases, you will see sample variance is less than population
- Also standrad deviation for sample = 5.62 is far away from the standrad deviation for population= 6.284
- Now lets calculate standrad deviation of sample by taking (n-1) at the denomiator.
`(n-1)=4` and taking symbol `s` instead of `sigma`
`s^2 =((3-11)^2+(8-11)^2+(11-11)^2+(13-11)^2+(20-11)^2) div 4`
new standrad deviation for sample = `s`= 6.285 ----New S.D for sample
- Calculated new standard deviation = s= 6.285 which is almost simillar to standard deviation of population.
- logically, sample variance should be nearest to the population variance,so in order to achieve this researcher or scientist after so many experiments they have comes to the conclusion, when we devide sum of sqaured deviation by sample size less one.The resulting sample variance will be nearer to the population's variance.
- In this way to bring variance and standrad deviation of sample near to the variance and standard deviation of population we modify sample variance formula and we use (n-1) in the denominator instead of n.
Q.2 Difference between stratified and clustered sampling
- Stratified and cluster sampling both are probability sampling techniques.
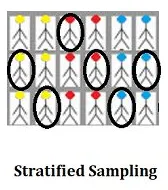
- Stratified sampling:-In this method we split the a population into groups(stratas),then randomly select some members from each strata(group) to be in the sample.
- example
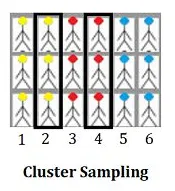
- cluster sampling :-In this method we split the population into clusters,then randomly select some the clusters and includes all members from those clusters in the sample.
- example:-
- Simillarity between stratified and cluster sampling :-
- Both methods are example of probability sampling methods -Every member in the population has an equal chance(probability)of being selected to be in the sample.
- In both the method we divides the population into distinct groups(either stratas or clusters)
- both the methods are quick ,easier and cost effective for obtaining samples from population as compared to simple random sampling .
- Differences between stratified and cluster sampling :-
- Stratified sampling divides the population into groups(stratums),then includes some members of all of the groups.
- cluster sampling divides the population into groups(clusters),then includes all the members of some randomly chosen groups.
- When to use stratified and cluster sampling:-
- (i) if population is heterogeneous(i.e there is natural differences between individuals)then its best way to use stratified sampling.(ii) If population is homogeneous (i.e there is no noticeable differences between individuals, then its best way to use cluster sampling.
Q.3 How many different samples can be created out of population of size n
- let population size is N and samples of size n
- number of samples of size n created out of population can be calculated as follow
- number of possible samples that can be drwan from population (with replacement)= `(N)^n`
- number of possible samples that can be drawn from population(without replacement) = `(N!)/(n! (N-n)!`
Q.4 What is the probability of drawing 2 jacks from a pack of card
explaination :
- There are 52 card in the pack of card and 2 card are drawing so
total outcomes `n(s)`= `52C_2`
there are 4 jacks in the pack of cards so
Favourable outcomes `n(E)` = `4C_2`
probability of drawing 2 jacks from pack of card = Favourable outcomes /total number of outcomes
`p(E) = (4 times 3) div (52 times 51)`
`p(E) = (4times3)/(52times51) = 1/221`
Q.5 What is the probability that both the numbers on dice are same while rolling 2 dice
- explaination :when two dice are thrown at same time ,
Total outcomes n(S)=`6^n`=`6^2 = 36`
Favourable outcomes i.e getting same number on both the dice
Favourable outcomes = (1,1) (2,2) ,(3,3) (4,4) (5,5) (6,6)= n(E) = 6
Probabilty of geeting same number on both dice `P(E)`= Favourable outcomes / total number of outcomes
`P(E) = 6/36=1/6`
Q.6 Why standard deviation when variance can measure the dispersion in data
- Variance is nothing but average of squared of deviation and standard deviation is the square root of variance.
- Variance is expressed in Squared units and Standard deviation is expressed in the same units of the data available.
- suppose we want to analyse of heights of student, we calculate mean, variance and standard deviation.standrad deviation gives more imformation about data height not variance ,if the measurements are in centimetres we want a measure of spread to be in centimetres not in sqaure of centimeters.
- So the biggest reason to user the standard deviation over the variance is that it has the same units as the original statistic.
- Variance helps us to find the distribution of data in the population from mean, and standard deviation also helps to know the disribution of data in population but standard deviation gives us more clarity about the deviation of data from a mean.