Basics of Probability and Statistics Week 1 Challenge
1. Why there is a difference in the formula of variance for population and sample
The main difference between population variance and sample variance relates to the calculation of a variance. i.e.; There is a difference in the formula in the denominator, (N-1) is used in the denominator to reduce the bias. There are two types of sample variances, Biased & Unbiased variances, we use (N-1) in the denominator to reduce the variation of the sample variance from the true mean (Population mean).
Th variance of the population is σ2=∑(Xi−μx)2Nσ2=∑(Xi-μx)2N
Where Xi=ithXi=ith Number
μxμx = Mean
NN = Number of items
The variation of sample is S2=∑(Xi−μx)2N−1S2=∑(Xi-μx)2N-1
As a result, both variance and standard deviation derived from sample data are more than those found out from population data.
2. Difference between stratified and clustered sampling?
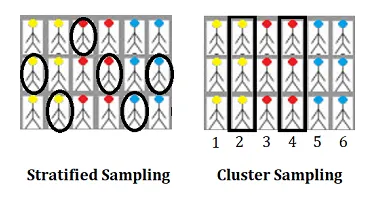
The main difference between stratified sampling and cluster sampling is that with cluster sampling, you have natural groups separating your population. For example, you might be able to divide your data into natural groupings like city blocks, voting districts or school districts. With stratified random sampling, these breaks may not exist, so you divide your target population into groups (more formally called "strata").
- In stratified sampling, a sample is drawn from each stratum (using a random sampling method like stratified random sampling or systematic sampling). In the image below, let's say you need a sample size of 6. Two members from each group (yellow, red, and blue) are selected randomly. Make sure to sample proportionally: In this simple example, 1/3 of each group (2/6 yellow, 2/6 red and 2/6 blue) has been sampled. If you have one group that's a different size, make sure to adjust your proportions. For example, if you had 9 yellow, 3 red and 3 blue, a 5-item sample would consist of 3/9 yellow (i.e. one third), 1/3 red and 1/3 blue.
- In cluster sampling, the sampling unit is the whole cluster; Instead of sampling individuals from within each group, a researcher will study whole clusters. In the image below, the strata are natural groupings by head colour (yellow, red, blue). A sample size of 6 is needed, so two of the complete strata are selected randomly (in this example, groups 2 and 4 are chosen).
3. How many different samples can be created out of a population of size n?.
If the population has nn elements in it, Then the no. of samples that can be created is
If we don't consider null set it would be `2^n -1`
For example:
If A {11, 13, 17} is the population containing three elements then the all possible sunsets of A are {}, {11}, {13}, {17}, {11,13}, {11,17}, {13,17}, {11, 13, 17}.
Therefore, the no. of possible subsets of A is 8, which is equal to including the null set.
4. What is the probability of drawing 2 jacks from a pack of cards?
Getting two cards out of 52 cards is
52C2=(52⋅512⋅1)=132652C2=(52⋅512⋅1)=1326
Getting 2 jacks out of 4 jacks is
4C2=(4⋅32⋅1)=64C2=(4⋅32⋅1)=6
The probability of getting 2 jacks out of 52 cards is given by,
P=favorable outcomes/total outcomes =
5. What is the probability that both the numbers on dice are the same while rolling 2 dice?
Total no.of favourable outcomes = ({1,1}, {2,2},{3,3},{4,4},{5,5},{6,6})
Total no.of possible outscomes =
Probality = 636=16636=16
6. Why standard deviation when variance can measure the dispersion in data?
Variance is an intermediate stage to obtain standard deviation. Variance can measure the dispersion of data, but the units are in the second power which does not match the original units of data.
Variance, σ2=∑(Xi−μx)2Nσ2=∑(Xi-μx)2N
Standard Deviation, S.D=√∑(Xi−μx)2NS.D=∑(Xi-μx)2N
For example, if we are calculating the standard deviation of the speed and variance of the speed for a set of data. The units of variance do not match with the original data units, whereas S.D will have the same units of the original data, in this instance, it will be km/h which is the same units system of the original data.