Basics of Probability and Statistics Week 1 Challenge
1st question answer:
Reason for Difference in the formula of variance for population and sample :
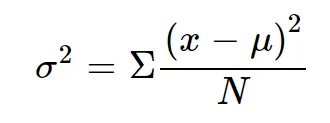 ...for population
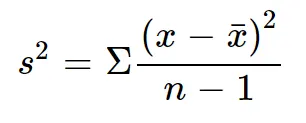 ....for sample
Here the difference is the denominator.
I will explain this by taking one example, Suppose a population that has a mean of 9.
Now I am selecting one sample from the population which is 3,8,11,12.
for this, the sample mean is 8.5
now, case(1): calculate the variance numerator value by using the sample mean
case (2): similarly calculate the variance numerator value by using population mean
In the first case, the sum is less than the second case, which means we are getting some error when we are using the sample mean.
Whatever sample we select and calculate the variance numerator, it always results in a lesser value than variance numerator which is calculated using population mean.
To compensate for the error, we need to decrease the denominator value in the sample variance formula. so that we are reducing 1 from the no. of observations.
but Why n-1....? Why not other...?
to know this we should aware of DOF (no. of critical values means their impact affects the final calculation). In the case of population, every item is critical. if we change the one item which changes the variance of the population but in the case of sample one item is redundant.
we have one mathematical equality in the case of sample i.e.,(x1−μ)+(x2−μ)+(x3−μ)+(x4−μ)+(x5−μ)=0, here, no need for all the items because all items are used in calculating mean so one is redundant.
this leads to DOF is n-1. but in the case of population, this is not satisfying.
2nd question answer:
Difference between stratified and clustered sampling:
Stratified sampling: This method consists of two steps. 1)Separating similar characteristic items from a population and forming groups called stratas,
2) And taking some items from every stratum and making a sample
Clustered sampling: This method also consists of two steps. 1)Randomly picking items from the population and forming groups called clusters,
2)Now, picking a sample from the group of clusters (any cluster or picking some items from some clusters).
| Sl.no. | Stratified sampling | Clustered sampling |
| 1 | Homogeneity within a group | Heterogeneity within a group |
| 2 | Heterogeneity across the group | Homogeneity across the group |
| 3 | Gives best results | Compared to stratified, it will give moderate results |
| 4 | Risky process | Easy process |
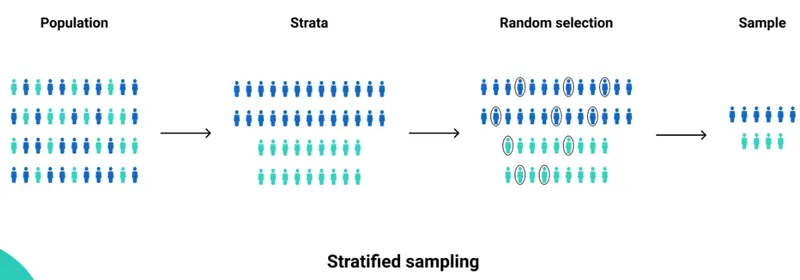
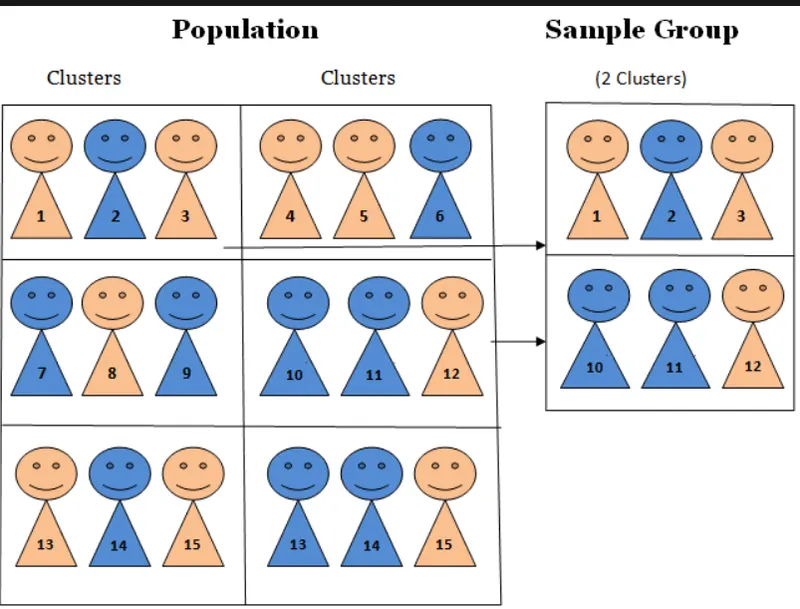
fig.Clustered sampling
3rd question & answer:
How many different samples can be created out of population of size n:
Let us take one simple example, population size of 4.. i.e., {1,2,3,4}
from this the samples are {1},{2},{3},{4},............=4C1
{1,2},{2,3,}{3,4}{1,3},{1,4}, {2,4},.................=4C2
{1,2,3},{2,3,4},{1,3,4},{1,2,4},.................=4C3
{1,2,3,4},.................=4C4
means population size of 4 gives 4C1+4C2+4C3+4C4 =15 no. of samples. simillary n sized population gives nC1+nC2+nC3+.....nCn= (2^n)-1
4th question answer:
What is the probability of drawing 2 jacks from a pack of card....?
Probability =(no.of favourable outcomes)/(total no. of outcomes)
total no. of cards = 52
total outcomes=52C2
total jacks present in pack of cards = 4
favourable outcomes = 4C2
probability = (4C2)/(52C2)=1/221 is the answer.
5th question & answer:
What is the probability that both the numbers on dice are the same while rolling 2 dice....?
favourable outcomes = {1,1}, {2,2}, {3,3}, {4,4}, {5,5}, {6,6}=6
total outcomes=6*6=36
probability=6/36=1/6.... is the answer.
6th question & answer:
Why standard deviation when variance can measure the dispersion in data:
... variance formulae
which indicates the dispersion or spread of the data corresponding to the mean. in the variance formula, there is a square value which is to ensure the spread value should always be positive. but it also squaring the units of the items, so in order to take these units to their original state, we have introduced one more formula which is standard deviation which is the square root of variance. the physical meaning of both variance and standard deviation leads spread or dispersion of items from their mean.