Basics of Probability and Statistics Week 1 Challenge
****************************** 😍 Welcome 😍 ****************************************
1. Why there is a difference in the formula of variance for population and sample
Ans:
The difference in the formula for calculating the variance of a population versus a sample arises due to the method of estimation used to calculate the variance.
Population Variance (σ^2):
- When calculating the population variance, you're working with the entire population, meaning you have data for every individual in the population.
The formula for population variance is:

where:
- N is the total number of observations in the population.
- xi represents each individual value in the population.
- μ is the population mean.
Sample Variance (s^2):
- In contrast, when you're dealing with a sample, you typically have data for only a subset of the population.
- The formula for sample variance is adjusted to account for the fact that you're working with a sample rather than the entire population. It uses n−1 in the denominator instead of N to provide an unbiased estimate of the population variance. This correction factor is known as Bessel's correction.
The formula for sample variance is:

where:
- n is the number of observations in the sample.
- xi represents each individual value in the sample.
- xˉ is the sample mean.
The reason for using n−1 instead of n in the denominator of the sample variance formula is to adjust for the fact that you're using the sample mean (xˉ) to estimate the population mean (μ). Dividing by n−1 instead of n helps correct for the potential bias that can arise when estimating the population variance from a sample. This adjustment ensures that the sample variance provides an unbiased estimate of the population variance.
**********************************************************************************
2. Difference between stratified and clustered sampling
Ans:
Stratified Sampling: Divides the population into groups based on certain characteristics, then randomly samples from each group. Example: Selecting households from different neighborhoods (A, B, C) and income levels within each neighborhood.
-
Clustered Sampling: Divides the population into clusters (blocks or streets) and randomly selects entire clusters to sample. Example: Randomly selecting blocks in a city and surveying all households within those blocks.
***********************************************************************************
3. How many different samples can be created out of population of size n
Ans:
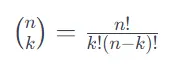
the number of different samples that can be created from a population of size n without replacement is given by the number of combinations of n items taken k at a time, denoted as(nk), where k is the size of the sample being chosen. The formula to calculate this is:
**********************************************************************************
4. What is the probability of drawing 2 jacks from a pack of card
Ans:
To determine the probability of drawing 2 Jacks from a standard deck of 52 playing cards, we can use the concept of combinations. A standard deck has four suits (hearts, diamonds, clubs, and spades), and each suit has one Jack. Therefore, there are a total of 4 Jacks in the deck.
The probability of drawing 2 Jacks from the deck can be calculated as follows:
Number of ways to choose 2 Jacks from 4: This is a combination problem, and it's denoted as , which represents the number of ways to choose 2 items from a set of 4.

Total number of possible 2-card combinations from a deck of 52 cards: This is , as we're choosing 2 cards from a deck of 52.

Probability:
(drawing 2 Jacks)=Number of ways to choose 2 JacksTotal possible 2-card combinationsP(drawing 2 Jacks)=
(Number of ways to choose 2 Jacks )/(Total possible 2-card combinations)
P(drawing 2 Jacks)=6/1326 ≈0.0045
So, the probability of drawing 2 Jacks from a standard deck of 52 playing cards is approximately 0.0045 or 0.45%.
***********************************************************************************
5. What is the probability that both the numbers on dice are the same while rolling 2 dice
Ans:
When rolling two six-sided dice, each die has 6 possible outcomes (1, 2, 3, 4, 5, or 6). To find the probability that both numbers on the dice are the same, we need to determine the number of favorable outcomes (i.e., when the numbers on both dice are the same) and divide it by the total number of possible outcomes.
-
Favorable Outcomes:
- There are 6 possible outcomes where both dice show the same number: (1, 1), (2, 2), (3, 3), (4, 4), (5, 5), and (6, 6).
-
Total Possible Outcomes:
- Each die has 6 possible outcomes, and since we're rolling two dice simultaneously, the total number of possible outcomes is 6×6=366×6=36.
-
Probability: �(both numbers on dice are the same)=Number of favorable outcomesTotal possible outcomesP(both numbers on dice are the same)=
 P(both numbers on dice are the same)=6/36 = 1/6
 -
So, the probability that both numbers on two six-sided dice are the same is
16
1/6 or approximately 0.16670.1667 (or 16.67%16.67%).
************************************************************************************
6. Why standard deviation when variance can measure the dispersion in data
Ans: standard deviation is better than variance because it gives a clearer idea of how spread out the data is in the same units we're measuring, making it easier to understand and compare. Variance, being in squared units, is less straightforward to interpret directly.
************************************ 💕Thank You✌️ *************************************