Basics of ML & AL Week 2 Challenge
Question 1)Calculate all 4 business moments using pen and paper for the below data set?
Answer For Question 1:
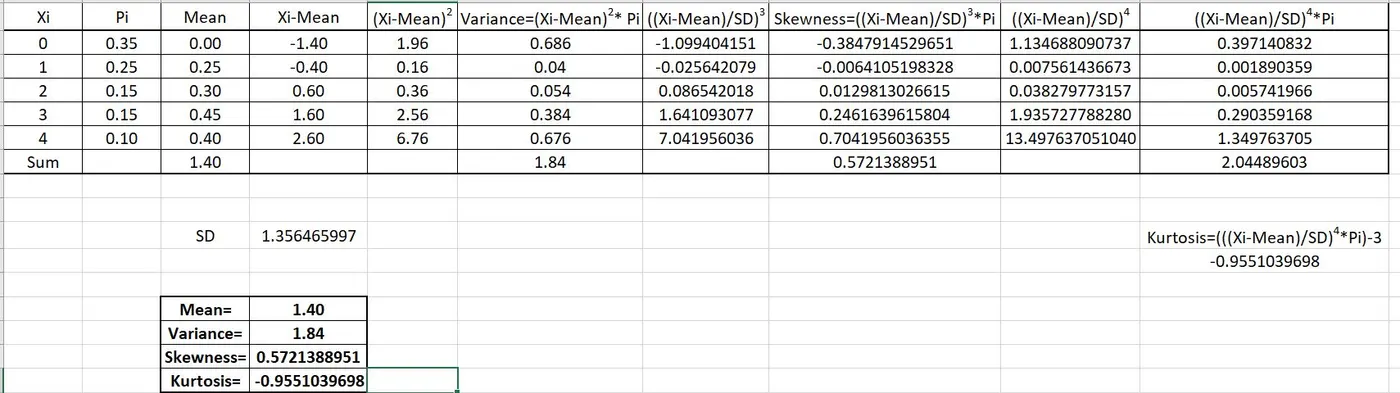
Question 2)What is the significance of expected value when simple mean (Sum of all observations/number of observations) is already in place?
Answer for Question 2:
Expected Value is a long run average value of random variable. it also indicates the probability weighted average of all possible values.
Expected Value is the anticipated value for an investment at some point in the future.
so, Expected Value EV = P(x) X n
Where P(x)=Probability of the event.
n=number of the reptitions of the event.
so for the multiple events, EV= `sum`P(Xi) * Xi
Example:
Project A=0.4 Probability with the value of $2million.
=0.6 Probability with the value of $500,000.
Project B=0.3 Probability with the value of $3million.
=0.7 Probability with the value of $200,000.
so the Expected Value,
EV(Project A)=[0.4*20,00,000]+[0.6*500,000]=$11,00,000.
EV(Project B)=[0.3*30,00,000]+[0.7*200,000]=$10,40,000.
from the above EV we need to choose the Project A.
But the Mean will show only the average of given data set.
Question 3)Having skewness in the curve considered to be bad in the analysis?
Answer for Question 3:
Definition: Skewness is a measure of the asymmetry of the probability distribution of a real valued random variable about its mean. The Skewness value will be positive, negative, Zero or undefined.
Yes, the Skewness in the curve is considered to be bad in the analysis because,
a) Skewness range form negative infinity to positive infinity and it sometimes for an investor to predict the trend in data set.
b) An analyst in forecasting the future performance of an assest using the financial model which usually assumes that data is normally distributed but if the distribution of the data is skewed then the model will not reflect actual result in the assumption.
But it is used in the statistics as it helps in understanding how much data is asymmetry from the normal distribution.
so the Skewness does not provide any useful information beyond that already Given by the measure of locations and dispersion.
Question 4)Evaluate the probabilities for continuous normal distribution with given mean = 680 and standard deviation = 31
a)P(X<711)
b)P(X>740)
c)P(600<X<720)
d)P(X=720)
Answer for Question 4:
Mean `mu`=680
Standard Deviation SD `sigma`=31
a) P(x<711)=P(x-`mu`<711-680)
=P((x-`mu`)/`sigma`<(711-680/31))
=P(z<1)
P(x<711)=0.8413 (From z-tables)
b) P(x>740)=P(x-`mu`>740-680)
=P((x-`mu`)/`sigma`>(740-680/31))
=P(z>1.94)
P(x>740)=0.0262 (From z-tables)
c) P(600<x<720)=P(600-680< x-`mu` <720-680)
=P((600-680/31)< (x-`mu`)/`sigma` <(720-680/31))
=P(-2.58<z<1.29)
P(600<x<720)=0.8966 (From z-tables)
d) The Normal distribution calculation is for the Particular range of area in the curve. we cannot find the normal distribution for the Pointed values or a line entity. so the Probability P(x=720) is equal to zero.
P(x=720)=0
Question 5)Explain the curve on the right side
Answer for Question 5:
The above curve is nothing but the Standard normal Distribution curve. To bring the different scales of the normal distribution we need to use the standard normal distribution.Standard normal distribution makes sure all the data following normal distribution will have the same Mean & Standard deviation.
a) The 34.1%+34.1%=68.2% area falls in the -1`sigma` to +1 `sigma` range. so the 68.2% of the possible values will lie in these area of the curve. These area is symmetry about the mean.
b) The 34.1%+34.1%+13.6%+13.6%=95.4% area falls in the -2`sigma` to +2 `sigma` range. so the 95.4% of the possible values will lie in these area of the curve. These area is symmetry about the mean.
c) The 34.1%+34.1%+13.6%+13.6%+2.1%+2.1%=99.6% area falls in the -3`sigma` to +3 `sigma` range. so the 99.6% of the possible values will lie in these area of the curve. These area is symmetry about the mean.
That's these curve is also called as the 3`sigma`curve. so almost all the data will fall in these curve area.