Basics of ML & AL Week 2 Challenge
1)Calculate all 4 business moments using pen and paper for the below data set?
1. First Business Moment-Mean
`mu=Sigma_(i=0)^5(X_i*P(x))`
`mu=(0*0.35)+(1*0.25)+(2*0.15)+(3*0.15)+(4*0.10)`
`mu=1.4`
2. Second Business Moment-Variance
`sigma^2=Sigma_(i=0)^5((X_i-mu)^2*P(x))`
`sigma^2= ((0-1.4)^2*0.35)+((1-1.4)^2*0.25)+((2-1.4)^2*0.15)+((3-1.4)^2*0.15)+((4-1.4)^2*0.10)`
`sigma^2=1.84`
`sigma=root 2 1.84=1.356`
3.Third Business Moment-Skewness(Sk)
`"Sk"=Sigma_(i=0)^5(((X_i-mu)/sigma)^3*P(x))`
`"Sk"= (((0-1.4)/1.356)^3*0.35)+(((1-1.4)/1.356)^3*0.25)+(((2-1.4)/1.356)^3*0.15)+(((3-1.4)/1.356)^3*0.15)+(((4-1.4)/1.356)^3*0.10)`
`"Sk"=0.569=0.57`
4.Fourth Business Moment-Kurtosis(Kt)
`"Kt"=Sigma_(i=0)^5(((X_i-mu)/sigma)^4*P(x))-3`
`"Kt"= (((0-1.4)/1.356)^4*0.35)+(((1-1.4)/1.356)^4*0.25)+(((2-1.4)/1.356)^4*0.15)+(((3-1.4)/1.356)^4*0.15)+(((4-1.4)/1.356)^4*0.10)-3`
`"Kt"=2.0233-3=-0.976`
2)What is the significance of expected value when simple mean (Sum of all observations/number of observations) is already in place?
In simple we assume that the probability of each event occuring is equal and hence we calculate by summing them and dividing by total number of events. In expected value we are given with the probability of each event occuring. Hence we have to consider the probability of each event occuring and thus we get expected value. When probability of event is given is when the significance of expected value is more tham that of simple mean.
3)Having skewness in the curve considered to be bad in the analysis?
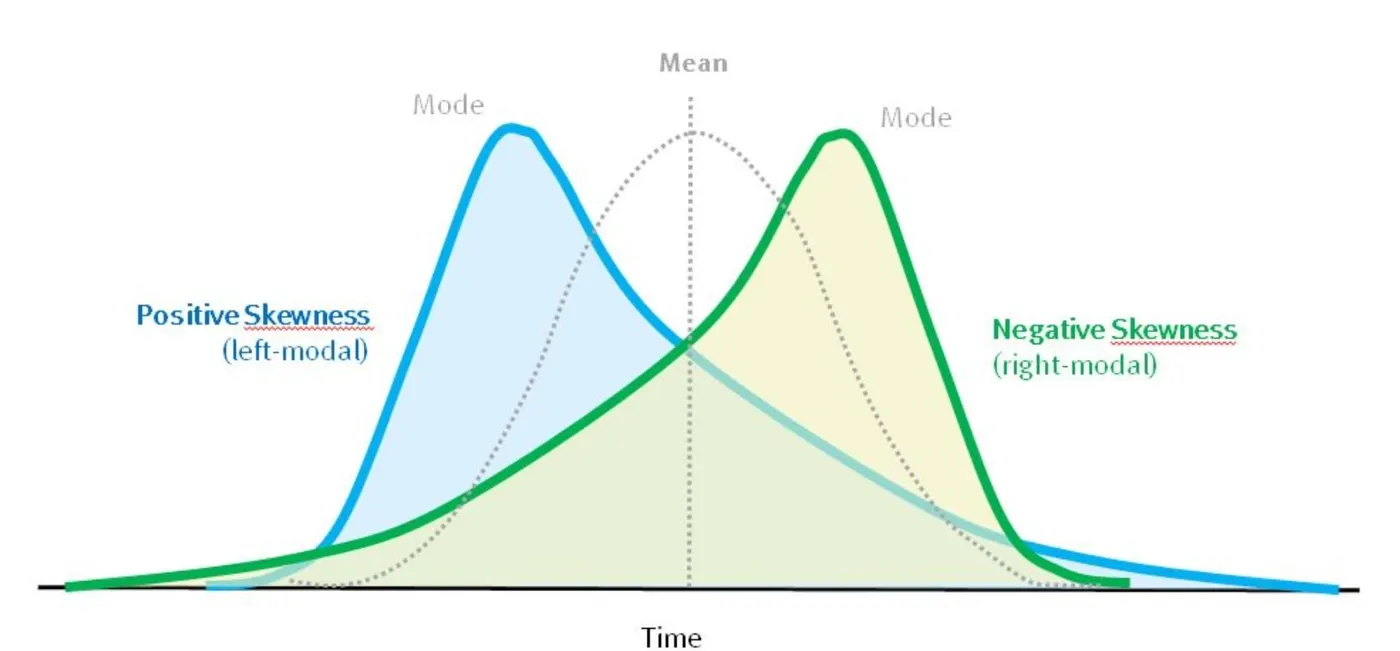
Having skewness in data is neither good nor bad. Skewness varies according to each data type. For example number of cars in each household will be a positivally skewed curve while the amount of runs scored by batsmen in an easy pitch would be negatively skewed distribution.
3)Having skewness in the curve considered to be bad in the analysis?
4)Evaluate the probabilities for continuous normal distribution with given mean = 680 and standard deviation = 31
a)P(X<711)
First Z score has to be calculated
`"Z"=(711-680)/31 = 1`
The probability value has to be checked in z table
Probabilty =84.134%
b)P(X>740)
`"Z"=(740-680)/31 = 1.93`
`P("X"<"740")=0.9732`
`P(X>740)=1-0.9732=0.0268=26.8%`
c)P(600<X<720)
`Z=(720-680)/31=1.29`
`Z=(600-680)/31=-2.58`
`P=0.90147-0.00475=0.89672=89.672%`
d)P(X=720)
`Z=(720-680)/31 =1.29`
`P(720)=P(Z>720)-P(Z<720)=0.90147-0.90147=0`
5)Explain the curve on the right side
This curve is the normal distribution of data points. It gives us a probability of data under 1,2,3,4 data points. In this 68.2% of data ranges z=-1 to +1 and 95.4% from z=-2 to +2.
Example for this type of data would be marks scored in a test. With most students scoring average marks with very few at both extremes.