Basics of ML & AL Week 2 Challenge
- Calculate all for business movements using pen and paper for the below data set
|
X(Random variable= Number of toys ) |
P(x)= Probability of selling x toys in a day |
|
0 |
0.35 |
|
1 |
0.25 |
|
2 |
0.15 |
|
3 |
0.15 |
|
4 |
0.10 |
|
Business moments |
Formula |
Value |
|
First business moment-Mean |
`μ=∑▒〖(x_i*p(x))〗` |
`μ=1.4` |
|
Second Business moment-Variance |
`σ^2=∑▒〖(x_i-μ)〗^2 *p(x)` | `σ^2=1.84` |
|
Third Business moment-Skewness |
`Sk=∑▒〖(〖(x_i-μ)/σ)〗^3*p(x)〗` | `sk=0.57` |
|
Forth Business moment-Kurtosis |
`ku=∑▒〖(〖(x_i-μ)/σ)〗^4*p(x)-3〗` | `ku=-0.98` |
What is the significance of expected value when sample mean (sum of all observation/ number of observations) are already in place?
Sample mean is defined as the sum of individual observation divided by the number of observations
`Mean is given by (∑▒x_i )/n`
Expected value: probability of an event multiplied by the amount of times the event happens`p(x)*n`
Expected value gives more clarity of an event than mean for example if we toss a coin ten times the probability of getting head or tail is 0.5 the total number of trial =10 so we can expect out of 10 trials 5 trails we can expect head
|
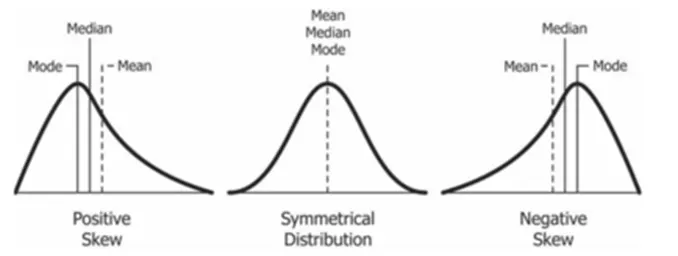
Having skewness in the curve considered to be bad in the analysis? |
Having skewness in the curve is not considered to be bad in the analysis. It depends on types of data to be analyzed.
Skewness is a measure of how much the probability distribution of a random variable deviates from the normal distribution
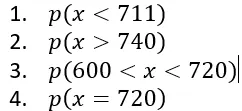
Evaluate the probabilities for continues normal distribution with given mean =680 and standard deviation =31
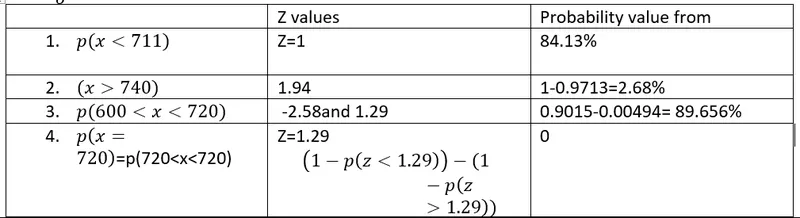
To evaluate the probabilities for continues and normal distribution we use ‘z- formula’ and ‘z-table’
`z=(x-μ)/σ`
Explain the curve
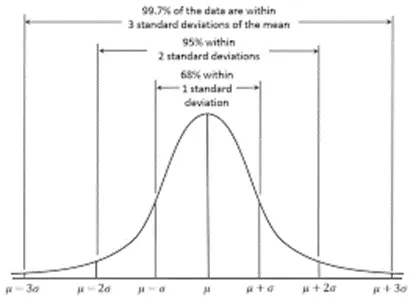
It gives us the percentage of data falling under every 1,2,3 standard deviation from mean value. In the figure 68 % data falls from z value -1 to +1 , 95% from -2 to +2 and 99.6% from -3 to 3
Explain kurtosis
Kurtosis is a statistical measure used to describe the degree to which scores cluster in the tails or the peak of a frequency distribution. The peak is the tallest part of the distribution, and the tails are the ends of the distribution.
There are three types of kurtosis: mesokurtic, leptokurtic, and platykurtic.
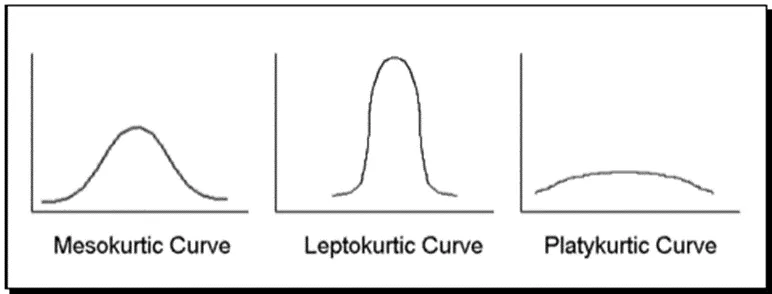
- Mesokurtic: Distributions that are moderate in breadth and curves with a medium peaked height.
- Leptokurtic: More values in the distribution tails and more values close to the mean (i.e. sharply peaked with heavy tails)
- Platykurtic: Fewer values in the tails and fewer values close to the mean (i.e. the curve has a flat peak and has more dispersed scores with lighter tails).