Basics of ML & AL Week 2 Challenge
Ans 1. Solved in excel sheet and uploaded.
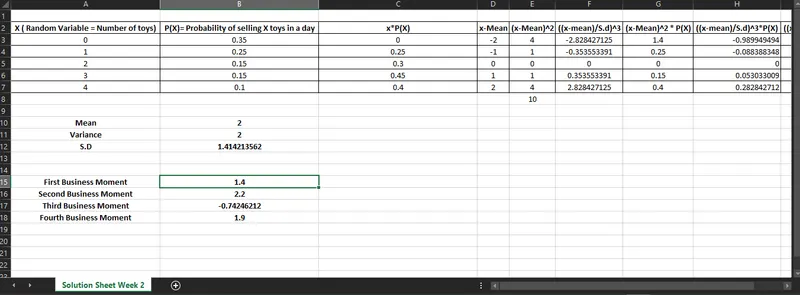
Ans.2
The expected value and Mean are essentially the same. When considering non-uniform probability, the expected value formula is used to represent the weighted average, i.e. `E(X) = P(X i) * X i`, used in the probability distribution, when the same table is represented in frequency distribution we calculate mean.
E.g. Given that an outcome of dice can be {1,2,3,4,5,6)} having an equal probability of 1/6.
the E(X)= `1*(1/6)+2*(1/6)+3*(1/6)+4*(1/6)+5*(1/6)+6*(1/6)` = 3.5
Mean(`mu`)=`(1+2+3+4+5+6)/6`=3.5
Ans.3
Skewness is the degree of distortion from the normal distribution. It measures the lack of symmetry in the distribution of data.
The skewness of a symmetric curve =0.
Why is skewness bad of analysis?
Depending on the value of skewness, we can determine the deviation from symmetry of distribution, if the tail is on the right side of the mean then it is called positive skewness and if the tail is on the left of mean then it is called negative skewness. If the skewness is between -0.5 to 0.5 then it is fairly symmetrical, if it is less than -1 or greater than 1 then it is highly skewed.
Now skewness affects the basic mean, median, and mode calculation as the data is not symmetric in nature and we need to break down the data set to make it more symmetrical.
Ans.4
Given a normal distribution curve with Mean(`mu`) = 680 and Standard Deviation (`sigma`)=31.
Now , a. P(X<711)= P(X<`mu+sigma`)=84% (approx.).
b. P(X>740)=P(X>`mu+sigma*2`)=2.3% (approx.)
c. P(600<X<720) = use formula `z=(x-mu)/sigma`
p(-2.58<z<1.29)=0.4951+0.4015=89.66% approx.
d. P(X=720)=0 (Since it is the area under the curve, so one line has zero area)
Ans.5
The graph represents a standard bell curve or the Normal Distribution Curve.
There the central line that divides the curve into two symmetric halves is called the mean and the deviation from the centre is represented using sigma or standard deviation. Now since the bifurcation is given we can say that in a standard normal distribution curve the area under `mu -sigma and mu + sigma` = 68.2% approximately which implies that 68.2% of the sample or population lies within this range, similarly, the area of the curve between `(mu-2*sigma) and (mu+2*sigma)`= 95.4% approximately.
Highly used in generalizing population study and also in determining the quality of products etc.