Basics of ML & AL Week 2 Challenge
***************************** 😍 Welcome 😍 ****************************************
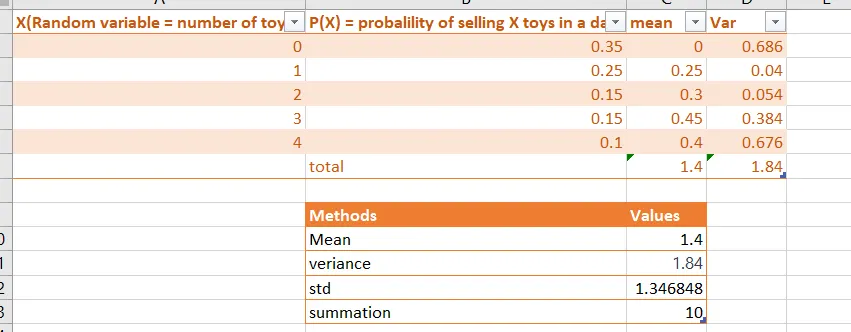
Q1 in Excel File file
***********************************************************************************
Q2. What is the significance of expected value when simple mean (Sum of all observations/number of observations) is already in place
The simple mean calculates the average of observed data, while the expected value considers probabilities in a probabilistic scenario. The simple mean is a descriptive statistic, summarizing observed values, while the expected value is a concept from probability theory, predicting average outcomes. In situations involving randomness, the expected value provides a comprehensive understanding of average outcomes, incorporating probabilities. Both measures are used in different contexts: simple mean in descriptive statistics and expected value in probability theory. While the simple mean is straightforward to calculate, the expected value requires knowledge of probabilities associated with different outcomes. Despite their differences, both measures offer valuable insights into central tendency and average outcomes.
***********************************************************************************
Q3. Having skewness in the curve considered to be bad in the analysis?
Having skewness in the curve is not necessarily "bad" in analysis; it depends on the context and the goals of the analysis. Skewness is a measure of asymmetry in the distribution of data points around the mean.
Here's a simplified breakdown:
-
Negative Skewness: The left tail of the distribution is longer or more pronounced than the right tail. It means that the distribution has a larger number of lower values compared to higher values.
-
Positive Skewness: The right tail of the distribution is longer or more pronounced than the left tail. It indicates that the distribution has a larger number of higher values compared to lower values.
-
Zero Skewness: The distribution is perfectly symmetric around the mean.
***********************************************************************************
4)Evaluate the probabilities for continuous normal distribution with given mean = 680 and standard deviation = 31
a)P(X<711)
b)P(X>740)
c)P(600<X<720)
d)P(X=720)
A) Given data : mean(μ�) = 680, standard deviation (σ�) = 31
a)P(X<711) = P(680 + 31)
= P(μ+1σ�+1�)
In normal distribution the area under the curve which has the probability of outcomes is 0.5
The area under the curve from origin to 1σ1� is 0.34
Then P(X<711) = P(μ+1σ�+1�)
= 0.5 + 0.34
= 0.84
b)P(X>740)
We know that
Z=X−μσ�=�-��
Z = 740−68031740-68031
= 1.935
By using Z table : P(Z<1.35) = 0.9744
Then P(X > 740) = 1 - P(X<740)
= 1 - 0.9744
= 0.0256
c)P(600<X<720)
For 600:
Z = 600−68031600-68031
= -2.58
For 720:
Z = 720−68031720-68031
= 1.29
Then we can write : P(-2.58 < Z < 1.29)
By using Z table : P(Z < -2.58) = 0.00494
P(Z < 1.29) = 0.9015
P(-2.58 < Z < 1.29) = P(Z < 1.29) - P(Z < -2.58)
= 0.9015 - 0.00494
= 0.89656
d)P(X=720)
Z = 720−68031720-68031
Z = 1.29
The Probability of X = 720 is equal to the area under X = 720 which is very small. we need to subtract area on the left as well as the right side of the curve from the total area.
Therefore P(X = 720) = 0
***********************************************************************************
5)Explain the curve on the right side
A)
For the diagram shown above is the Probability distribution curve for the Normal Distribution.
The total data is centered into 50 % above mean and 50 % below mean.
We consider the standard deviation of the data is σ� then,
68.2% (34.1 + 34.1) of the data will lie between (μ−1σ)(�-1�) to (μ+1σ)(�+1�)
95.4% (47.7 + 47.7) of the data will lie between (μ−2σ)(�-2�) to (μ+2σ)(�+2�)
99.7% (49.85 + 49.85) of the data will lie between (μ−3σ)(�-3�) to (μ+3σ)(�+3�).
******************************* 😍 Thank You ✌️*******************************************