Basics of ML & AL Week 2 Challenge
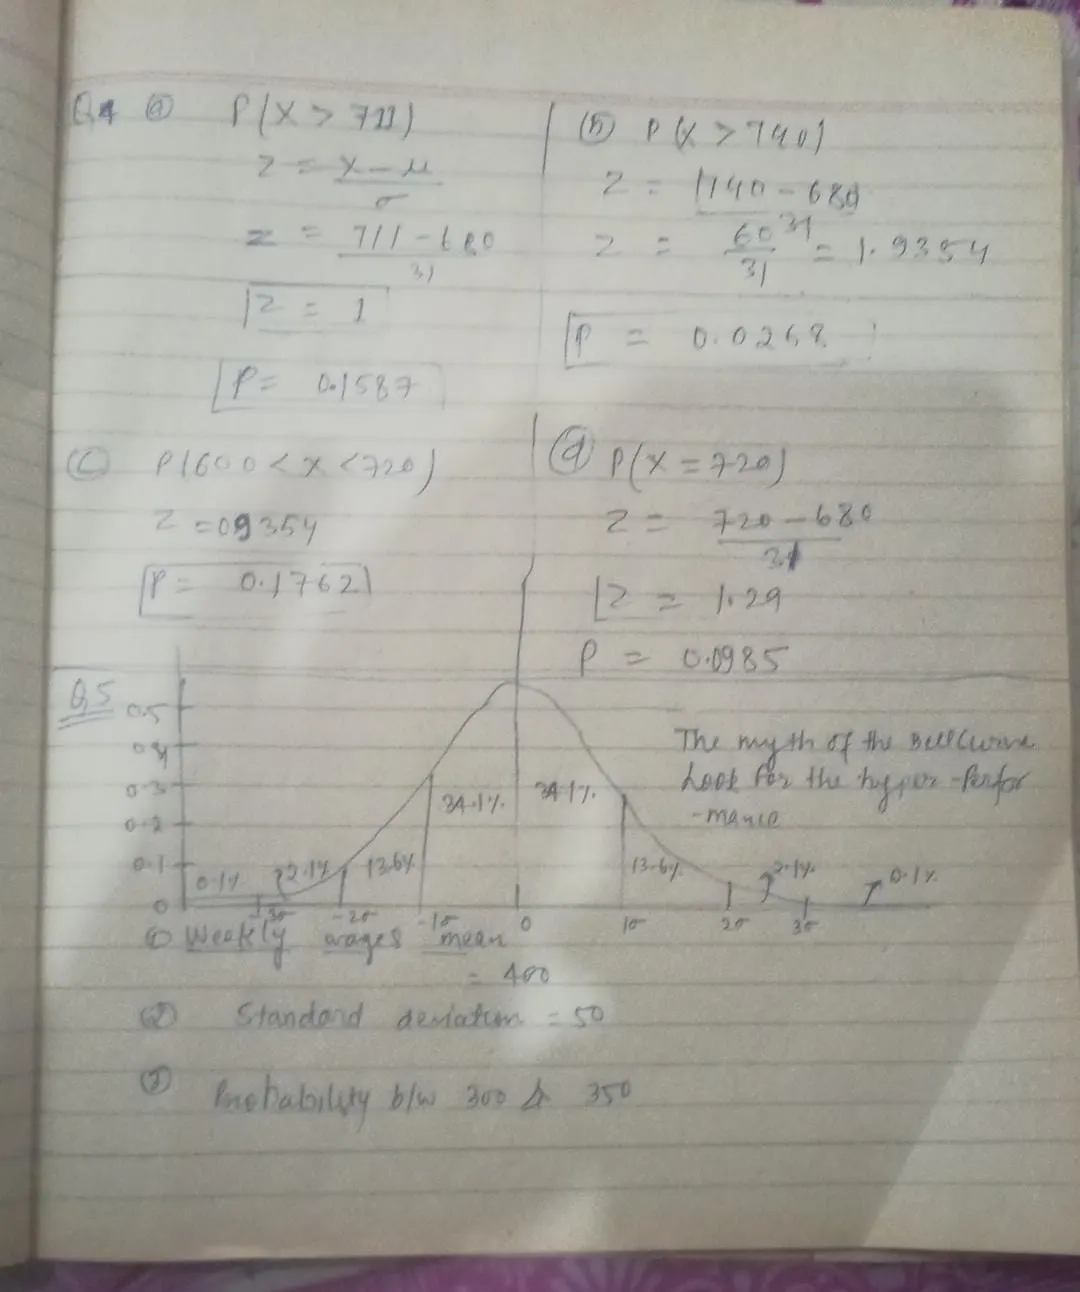
5)Explain the curve on the right side
Answer 2 The expected value is a measure of the center of a probability distribution, while the simple mean is a specific calculation for observed data. The expected value is particularly useful when dealing with probability distributions, providing a theoretical average in a probabilistic sense.
answer 3
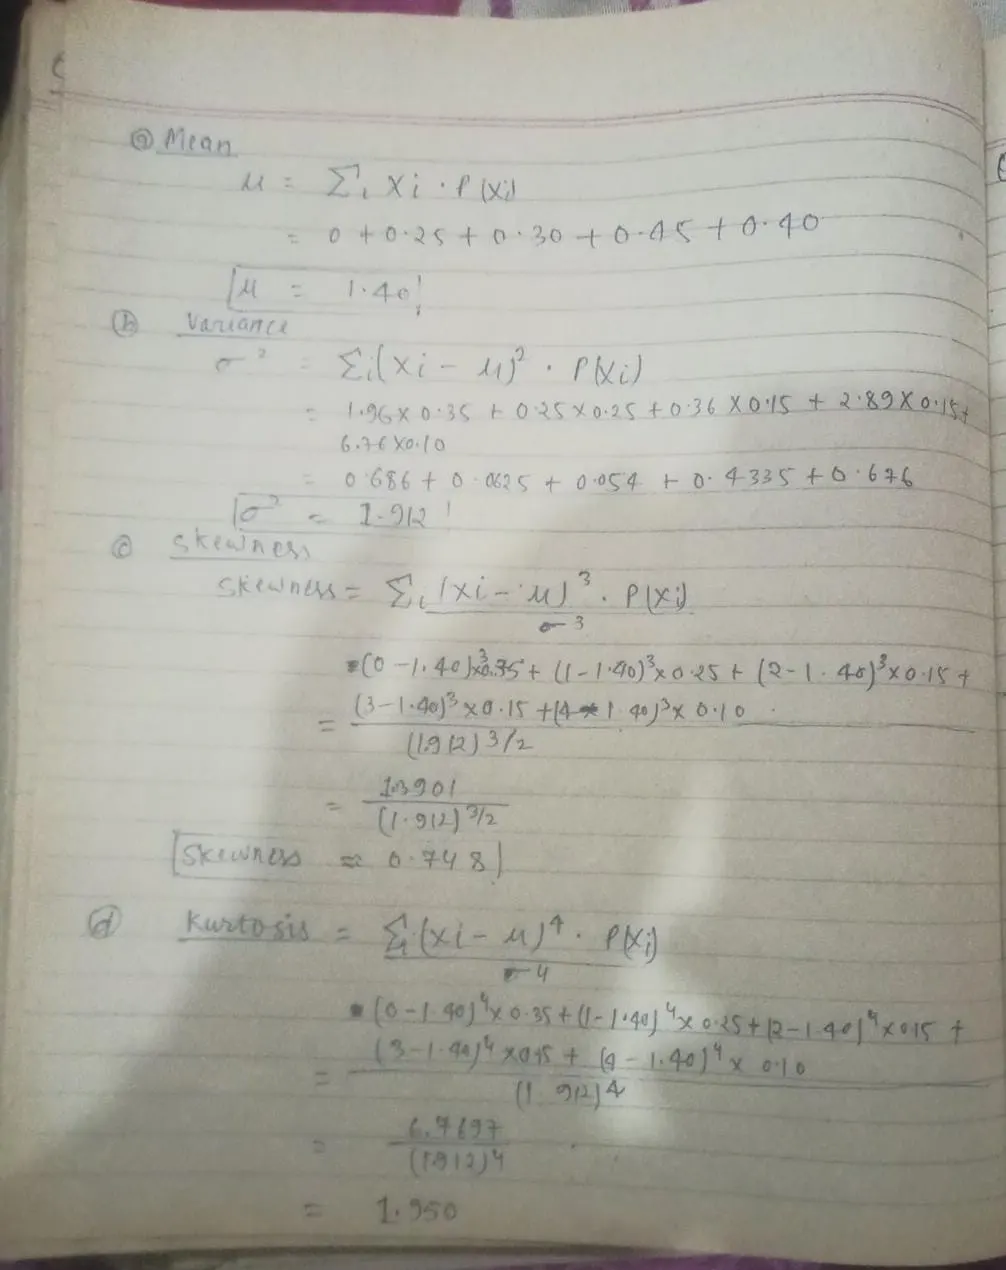
Skewness in a curve indicates a lack of symmetry. In some cases, skewness might be considered undesirable, as it can suggest an imbalance in the data. However, whether it's "bad" depends on the context of the analysis and the specific goals of the study.
Your Answers