Basics of ML & AL Week 2 Challenge
Ans1.
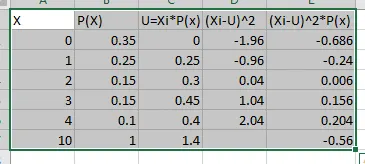
Mean(U)= 0*0.35+1*0.25+2*0.15+3*0.15+4*0.10
= 1.4
Variance =-0.56
Skewness
Sk=17.97
Kurtosis
K+=33.92
| X | P(X) | U=Xi*P(x) | (Xi-U)^2 | (Xi-U)^2*P(x) | (Xi-U)Varance^3 | (Xi-U)Varance^4*P(x)-3 |
| 0 | 0.35 | 0 | -1.96 | -0.686 | 2.790178571 | -2.65 |
| 1 | 0.25 | 0.25 | -0.96 | -0.24 | 2.992984694 | -6.308901239 |
| 2 | 0.15 | 0.3 | 0.04 | 0.006 | 3.195790816 | -7.120681487 |
| 3 | 0.15 | 0.45 | 1.04 | 0.156 | 4.195790816 | -9.25602223 |
| 4 | 0.1 | 0.4 | 2.04 | 0.204 | 4.797193878 | -8.594241983 |
| 10 | 1 | 1.4 | -0.56 | 17.97193878 | -33.92984694 |
===================================================================================
Ans2
Expected Value is the probability of an event multiplied by the amount of time the events happen. a probability function defines the
relative frequency outcomes of a random variable's expected value.
in the case of an infinite number of observations, it is very difficult to note each and every outcome. In such cases, each outcome is determined using this probability.
the formula is U=∑x⋅P(x)
=========================================================================================================
Ans 3
A Skewnes- it s a measure os asymmetry of the probability desnity funcyion of a real-valued random variable about its mean
There are 2 tyes of skewness:
Positive or Right Skewness: When the tail on the right side of the distribution is longer or fatter. The mean and median will be greater than the mode.
2) Negative or Left Skewnwss: When the tail on the left side of the distribution is longer or fatter.The mean and median will be less than than mode.
i) If the skewness is between -0.5 and 0.5, the data are fairly symmetrical.
ii) If the skewness is between -1 and – 0.5 or between 0.5 and 1, the data are moderately skewed.
iii) If the skewness is less than -1 or greater than 1, the data are highly skewed.
Having skewness in the curve is not considered to be bad in the analysis, Skewness is the attribute to describe the distribution.
==========================================================================================================================
Ans4
(A)P(X<711) = P(680 + 31)
= P(
In normal distribution the area under the curve which has the probability of outcomes is 0.5
The area under the curve from origin to
Then P(X<711) = P(
= 0.5 + 0.34
= 0.84
b)P(X>740)
We know that
Z =
= 1.935
By using Z table : P(Z<1.35) = 0.9744
Then P(X > 740) = 1 - P(X<740)
= 1 - 0.9744
= 0.0256
c)P(600
For 600:
Z =
= -2.58
For 720:
Z =
= 1.29
Then we can write : P(-2.58 < Z < 1.29)
By using Z table : P(Z < -2.58) = 0.00494
P(Z < 1.29) = 0.9015
P(-2.58 < Z < 1.29) = P(Z < 1.29) - P(Z < -2.58)
= 0.9015 - 0.00494
= 0.89656
d)P(X=720)
Z =
Z = 1.29
The Probability of X = 720 is equal to the area under X = 720 which is very small. we need to subtract area on the left as well as the right side of the curve from the total area.
Therefore P(X = 720) = 0
==========================================================================================================================
Ans5
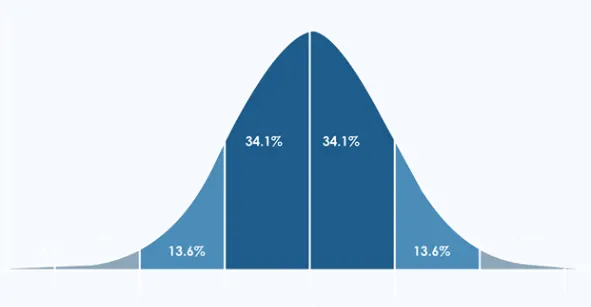
The curve shown in the figure represents a normal distribution. The peak of the curve divides the curve and the area is symmetric about the y-axis with the mean or expected value located at the origin. The right side of the curve is divided using the standard deviation as follows:
The area under the curve between the mean and 1 standard deviation is 34.1% of the total area. This means that 34.1% of the outcomes lie in this region.
- Also, the area between
μ + 1 σ and μ + 2 σ
�=∑�⋅�(�)