Basics of ML & AL Week 2 Challenge
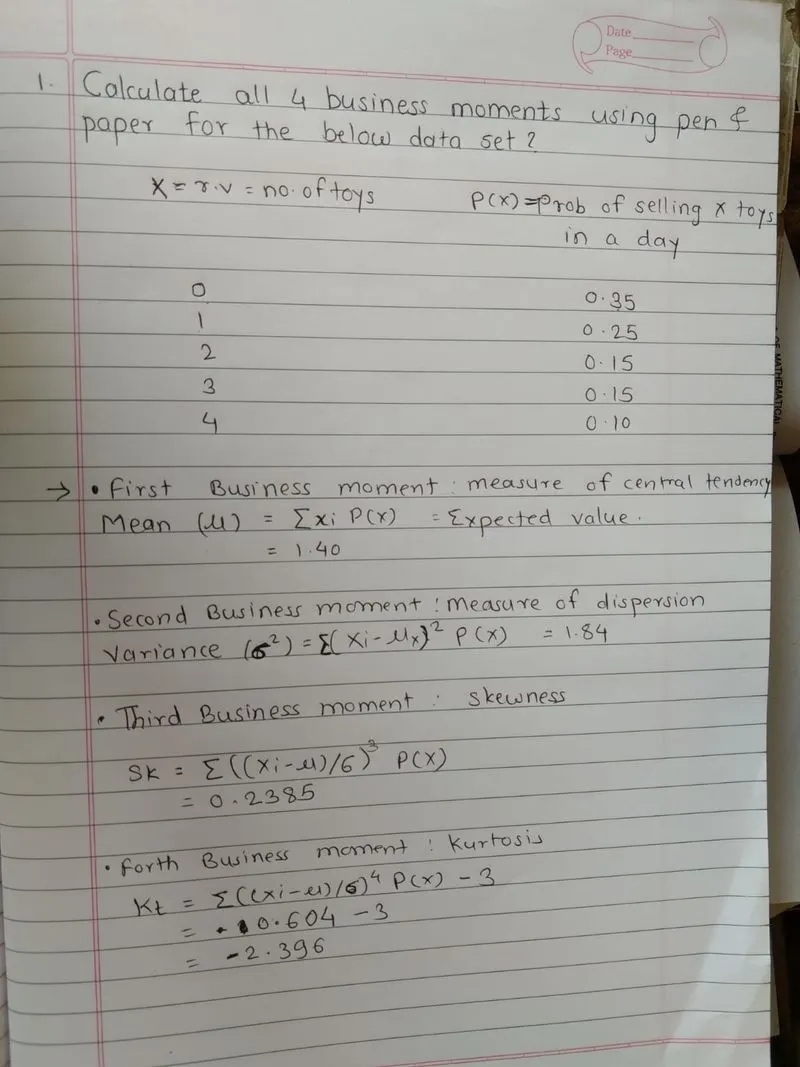
2.The expected value of a discrete random variable X, symbolized as E(X), is often referred to as the long-term average or mean (symbolized as μ). This means that over the long term of doing an experiment over and over, you would expect this average
3. Its not bad or good. Skewness may be a violation of assumptions of a test, in which case either figure out a way to fix it, or use a different test.
4.
Given data : mean(μ) = 680, standard deviation (σ) = 31
a)P(X<711) = P(680 + 31)
= P(μ+1σ)
In normal distribution the area under the curve which has the probability of outcomes is 0.5
The area under the curve from origin to 1σ is 0.34
Then P(X<711) = P(μ+1σ)
= 0.5 + 0.34
= 0.84
b)P(X>740)
We know that
Z=X−μ/σ
Z = 740−68031740-68031
= 1.935
By using Z table : P(Z<1.35) = 0.9744
Then P(X > 740) = 1 - P(X<740)
= 1 - 0.9744
= 0.0256
c)P(600<X<720)
For 600:
Z = 600−68031600-68031
= -2.58
For 720:
Z = 720−68031720-68031
= 1.29
Then we can write : P(-2.58 < Z < 1.29)
By using Z table : P(Z < -2.58) = 0.00494
P(Z < 1.29) = 0.9015
P(-2.58 < Z < 1.29) = P(Z < 1.29) - P(Z < -2.58)
= 0.9015 - 0.00494
= 0.89656
d)P(X=720)
Z = 720−68031720-68031
Z = 1.29
The Probability of X = 720 is equal to the area under X = 720 which is very small. we need to subtract area on the left as well as the right side of the curve from the total area.
Therefore P(X = 720) = 0
5.
For the diagram shown above is the Probability distribution curve for the Normal Distribution.
The total data is centered into 50 % above mean and 50 % below mean.