Basics of ML & AL Week 2 Challenge
2. It is the Probability of an event multiplied by the amount of time the event happens.
In the case of an infinite number of Observations, it is very difficult to note each and every outcome. In such cases, the probability of each outcome is determined using this probability. The formula is :
μ=∑x⋅P(x)
3.
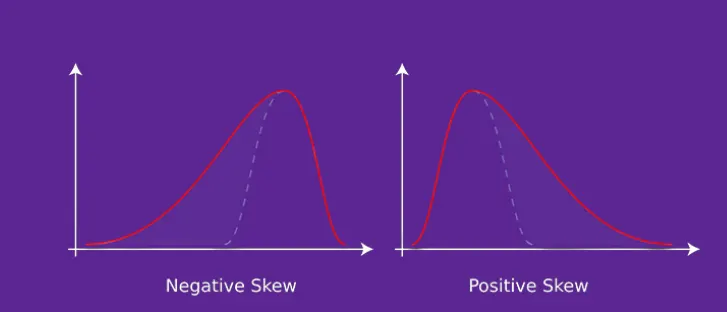
It is a measure of the asymmetry of the probability density function of a real-valued random variable about its mean.
There are two types of Skewness:
1) Positive or Right Skewness: When the tail on the right side of the distribution is longer or fatter. The mean and median will be greater than the mode.
Negative or Left Skewnwss: When the tail on the left side of the distribution is longer or fatter. The mean and median will be less than the mode.
Having skewness in the curve is not considered to be bad in the analysis, Skewness is the attribute to describe the distribution.
4.
A) Given data : mean(μ) = 680, standard deviation (σ) = 31
a)P(X<711)
The z-score of this would be = (711-680)/31 = 1.
Hence, it is one standard deviation away from the mean in the positive x-axis.
In the z-table, the probability value for z = +1 is 0.8413 which is 84.13%.
2. P(X>740)
The z-score of this would be = (740-680)/31 = 1.93.
Hence, it is 1.9 times the standard deviation away from the mean in the positive x-axis.
In the z-table, the probability value for z = +1.93 is 0.9732.
But it is asked for a probability greater than 740. Hence, we get the value until 740 and subtract it from 1.
So, the final probability value = 1 - 0.9732 = 0.0268 or 2.68%.
3. P(600
In this case, we need to find the value of probability at X<720 and X<600 and subtract both values.
When X = 720, z = 1.29 and probability value is 0.9015
When X = 600, z = -2.58 and probability value is 0.00494
Final probability value = 0.9015 – 0.00494 = 0.89656 or 89.656%.
4. P(X=720)
Z = 720-680/31
Z = 1.29
The Probability of X = 720 is equal to the area under X = 720 which is very small. we need to subtract area on the left as well as the right side of the curve from the total area.
Therefore P(X = 720) = 0
5.
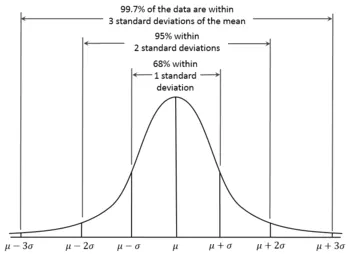
The diagram shown above is the Probability distribution curve for the Normal Distribution.
The total data is centered into 50 % above the mean and 50 % below the mean.
We consider the standard deviation of the data
68% (34. + 34.1) of the data will lie between (μ−1σ) to (μ+1σ)
95.4% (47.7 + 47.7) of the data will lie between (μ−2σ) to (μ+2σ)
99.7% (49.85 + 49.85) of the data will lie between (μ−3σ) to (μ+3σ)