Basics of ML & AL Week 2 Challenge
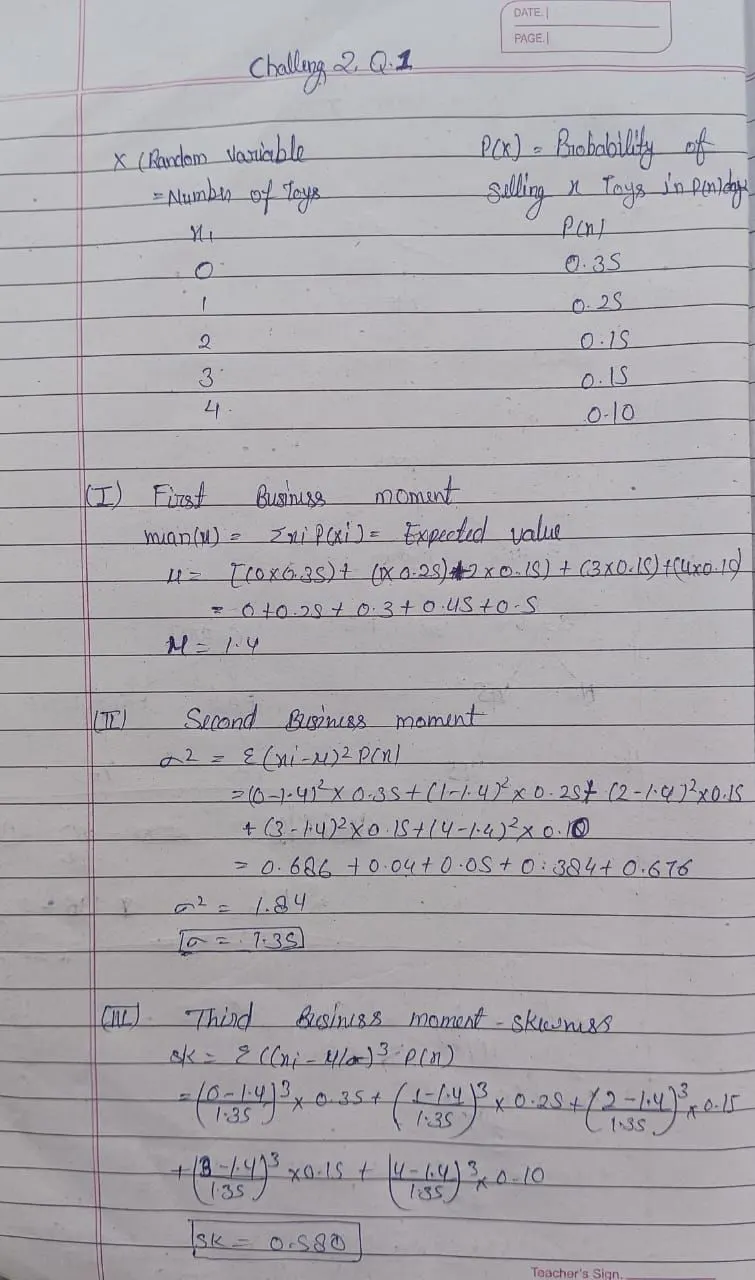
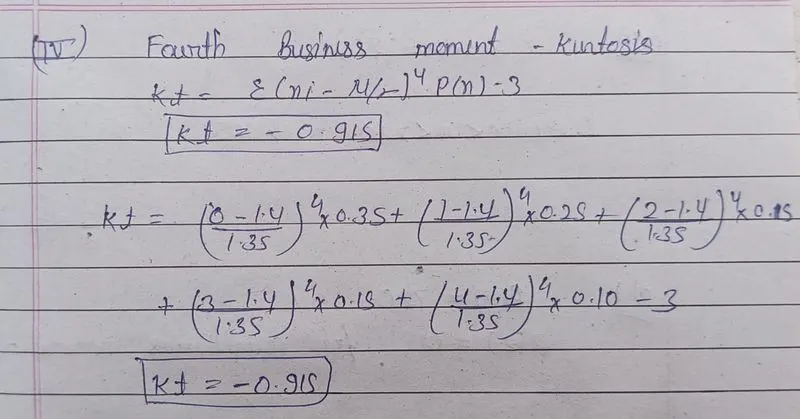
Q.1:- Please find the attached images for the answer
Q.2:-
Expected value is used when we want to calculate the mean of a probability distribution. This represents the average value we expect to occur before collecting any data. Mean is typically used when we want to calculate the average value of a given sample. This represents the average value of raw data that we've already collected.
Q.3:-
Skewness describes how much statistical data distribution is asymmetrical from the normal distribution, where distribution is equally divided on each side. If a distribution is not symmetrical or Normal, then it is skewed, i.e., it is either the frequency distribution skewed to the left side or to the right side. So if we having a skewness in the curve considered, if there's too much skewness in the data, then many statistical models don't work effectively, the tail region may act as an outlier.
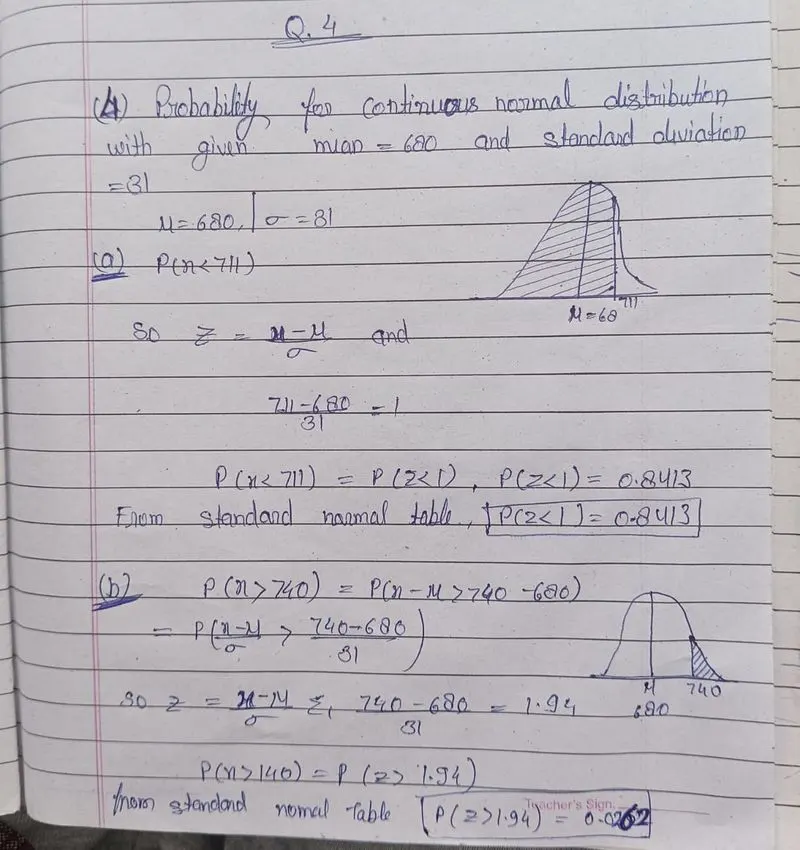
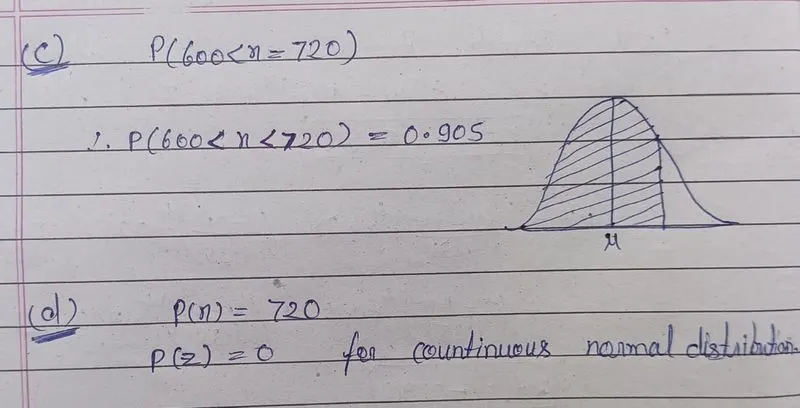
Q.4:- Please find the attached images for the answer
a)P(X<711)
b)P(X>740)
c)P(600x720)
d)P(X=720)
Q.5:-
from the above normal distribution we can say that
Aprroximately 68.3% of the values fall within 1 standard deviation of the mean
Approximately 95.5% of the values fall within 2 standard deviation of the mean
Approximately 97.7% of the values fall within 3 standard deviation of the mean