Optimization of IC-Engine - IC-Engine Calibration Using GT-Power and GT-Suite.
IC-Engine Calibration Using GT-Power and GT-Suite
Assingment:10 (Optimization Of IC-Engine)
Objectives:
- To explore the example- "Diesel_4cyl_DIpulse_injratemap" and write a detailed report.
Considering the Parameters-SOI, Rail Pressure and Response- NO and bsfc minimum.
- To run all designs for a case and find the optimum values and commenting on the observations.
Model Description:
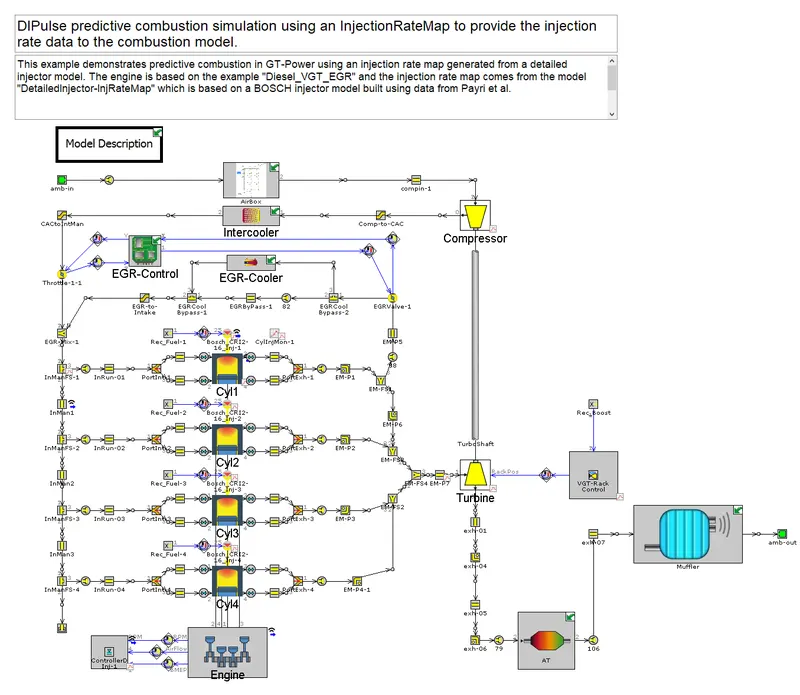
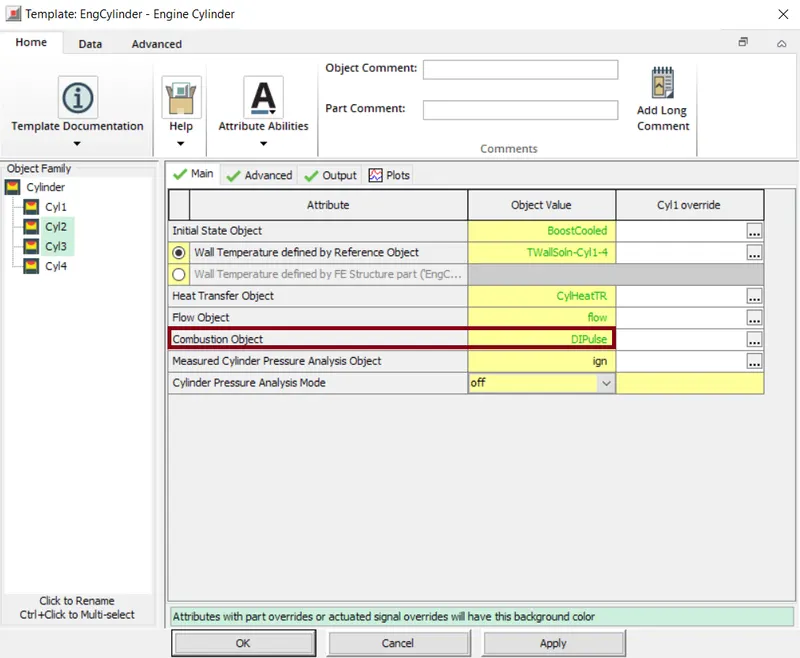
The above engine model is a 4-cylinder, four stroke, DirectInjection,2L diesel engine. Here in this model the combustion model is predictive.In predictive combustion burn rate is an output. The combustion is modeled by the DIPulse method.
Design Optimizer:
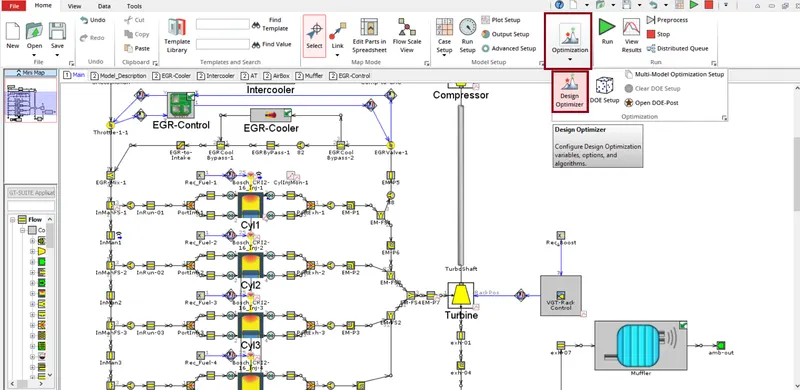
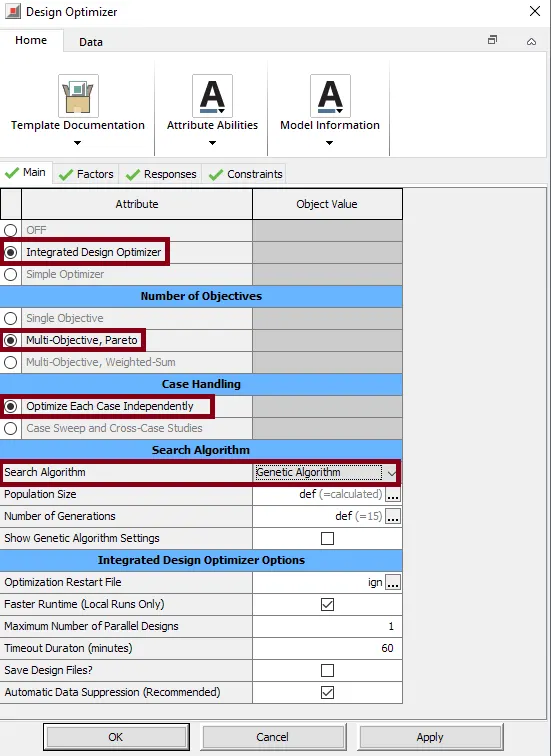
Here in design optimizer select "Integrated Design Optimizer". On selecting this it enables the Integrated Design Optimizer. On running the simulation it will launch a interface that monitors the complete optimization study.For this case we select number of objectives as "Multi-Objectie Pareto", this helps to maximize,minimize or target a single model output and study there competing objectives. Also we select for case handling we select "Optimize Each Case Independently". This is selected only when if each active case in the case setup should be optimized independently and hides all the sweep cases are hidden from solving. The search algorithm is set to 'Genetic Algorithm'And rest of the factors are left default. We use genetic algorithm because it is recomended for all the problems having medium to high complexity, also prefered when we have one or more constraints.
For this case the main factors or parameters we consider is Start of Injection(SOI) and Rail Pressure(P_Rail). Generally the range for start of ignition is -10deg before TDC and 10deg after TDC. Also the rail presure is considered in the limit of 1200-1600.
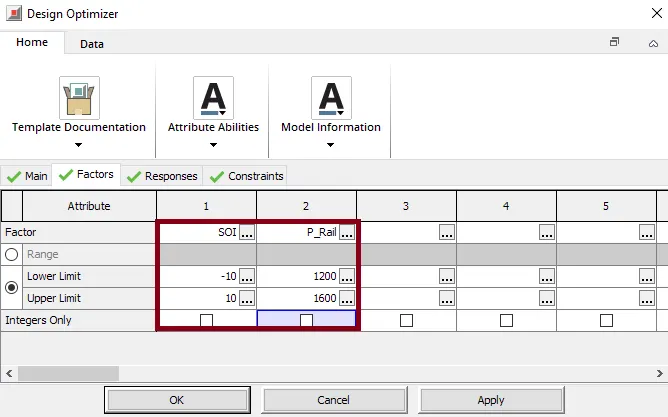
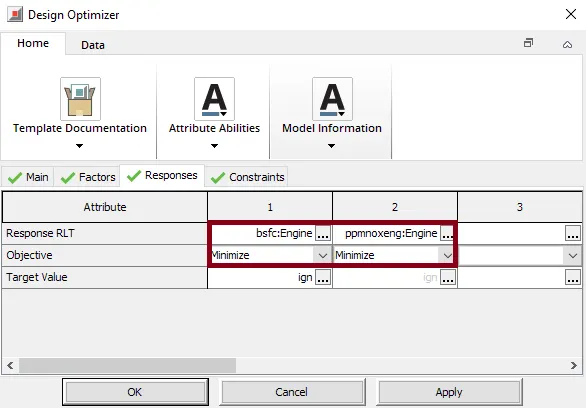
For Response=BSFC, we take response from Engine CrankTrain > Engine > Performance > select 'BSFC'. The main objective of BSFC is to 'Minimize'.
For the second i.e. Response=NO, we we take response from Engine CrankTrain > Engine > Emissions > select 'NO_Concentration(ppm)'. The main objective of NO is to 'Minimize'.
Case Setup:
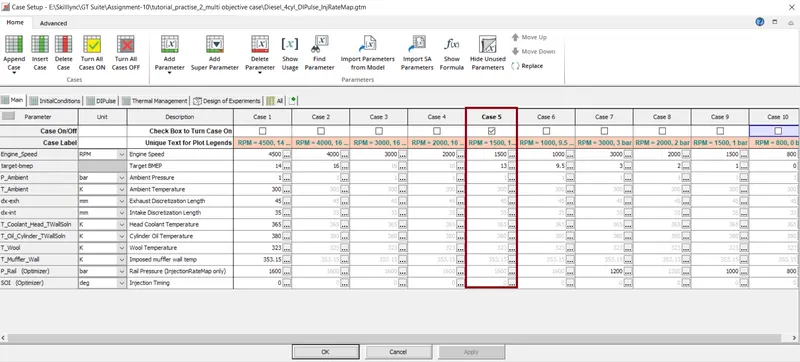
For this simulation there are totally 10 cases but to undeestand the outcomes we consider case:5 i.e. RPM-1500 & 13bar as target BMEP.
Result:
The below Pareto plot shows the relation between NO and BSFC. These both are not directly praportional to each other i.e. if we try to control BSFC, the NO increases and if we try to control NO, the BSFC increases. Based on our requirement we need to select from the possible outcomes in that range. The 2D-Pareto is called as the frontal Pareto which is indicated with blue colour is the most optimized casethat the algorithm has achieved.
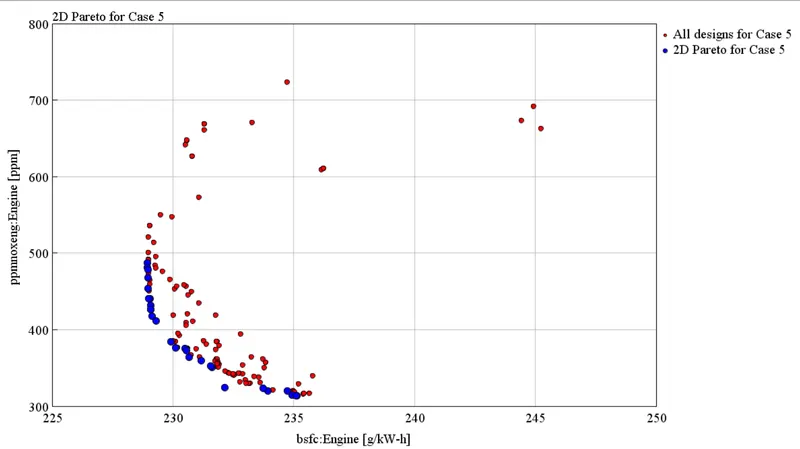
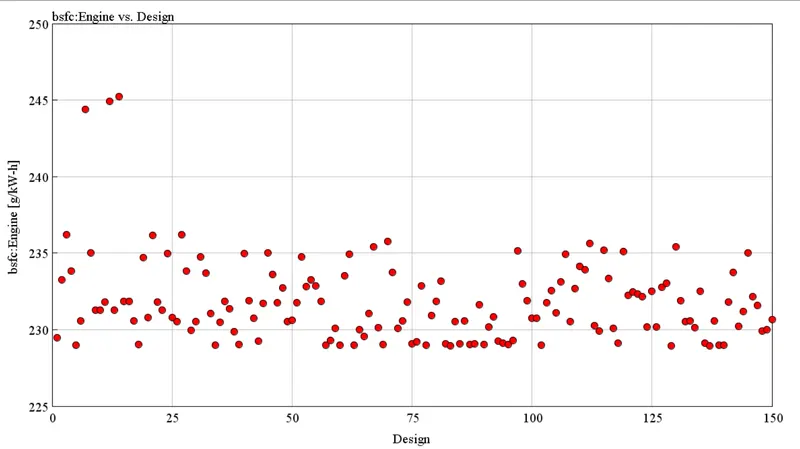
Here the plot clearly shows that, in the initial cases of running the simulation the BSFC has reached close to 245 g/kW-hr which is very high. Then immediately predicts the data and the algorithm is used to lower down the BSFC values i.e. in later stages it is restricted to 235 g/kW-hr. Hence the BSFC value is lowered.
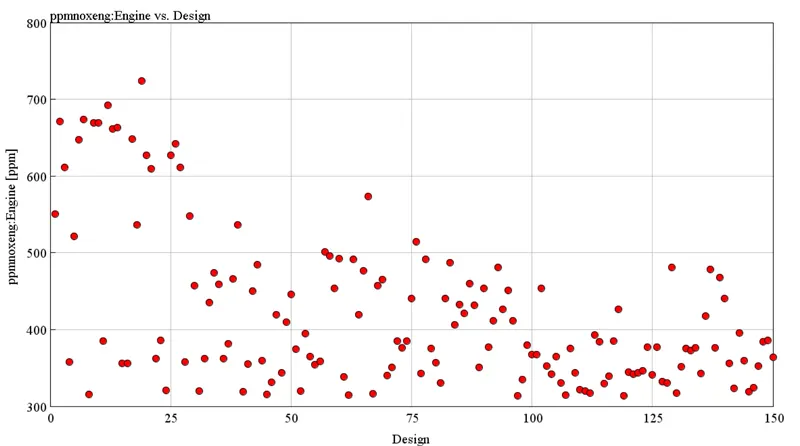
The main target here is to lower the NO, similar to the BSFC in the initial cases the NO content is very high i.e. reached till 700ppm then immediately predicts the data and the algorithm is used to lower down the NO values i.e. in later stages it is restricted to 500ppm.From then the NO is maintained below 500ppm only. Hence the NO value is lowered. It is also observed that if we start advancing the timing, we can predicit the higher NO, which is not good.
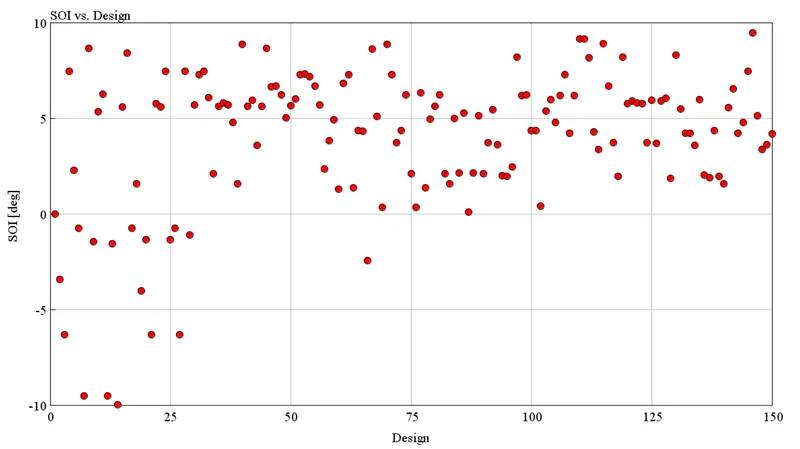
From the algorithm we can observe that most of the points at initial design it has advanced i.e under the range of 0 to -10. Later as it progresses, it has learned that if are advancing the NO values are going high and hence retarded the timing i.e. for all the next designs it did not consider the advancing zones but only considered the retarding zones.
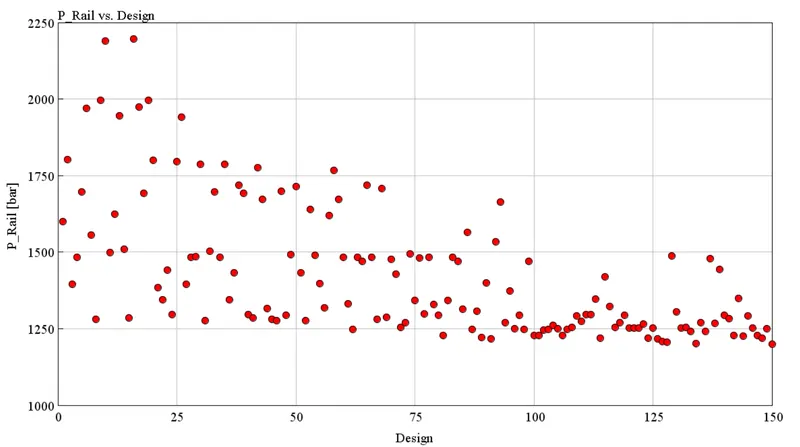
Here, we can observe that initially it considered a very high pressure upto 2250rpm. Hence initially the NO is on higher side. As it progressed, it is undertood that high pressure leads to higher NOx. So it lowered the rail pressure and maintained between 1200bar and 1500bar.
Contours:
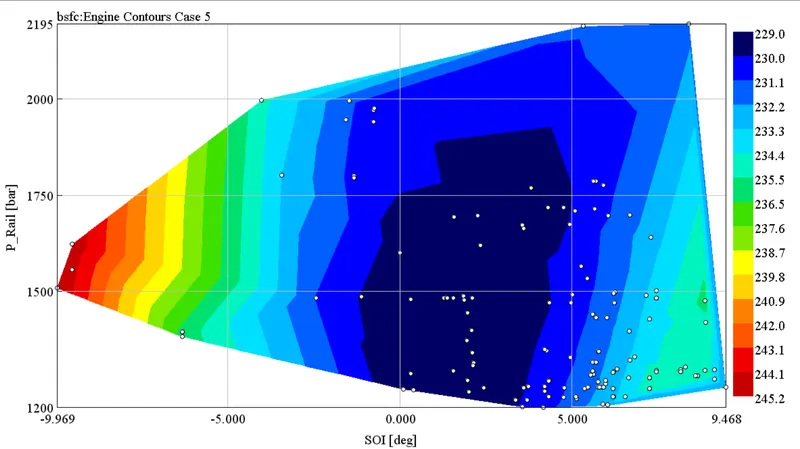
The BSFC contour shows the start of injection on x-axis and the rail pressure on y-axis. In the scale blue is the minimum value and red is the maximum value. Hence the below contour shows the minimum and maximum BSFC.
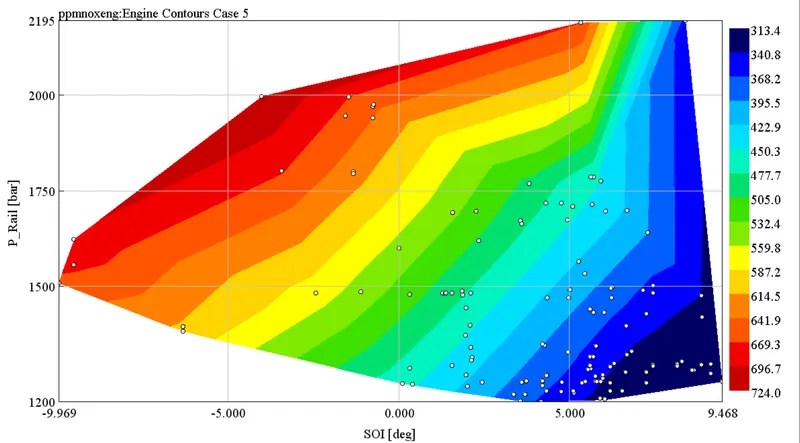
The NO contour shows the start of injection on x-axis and the rail pressure on y-axis. In the scale blue is the minimum value and red is the maximum value. Hence the below contour shows the minimum and maximum NO.
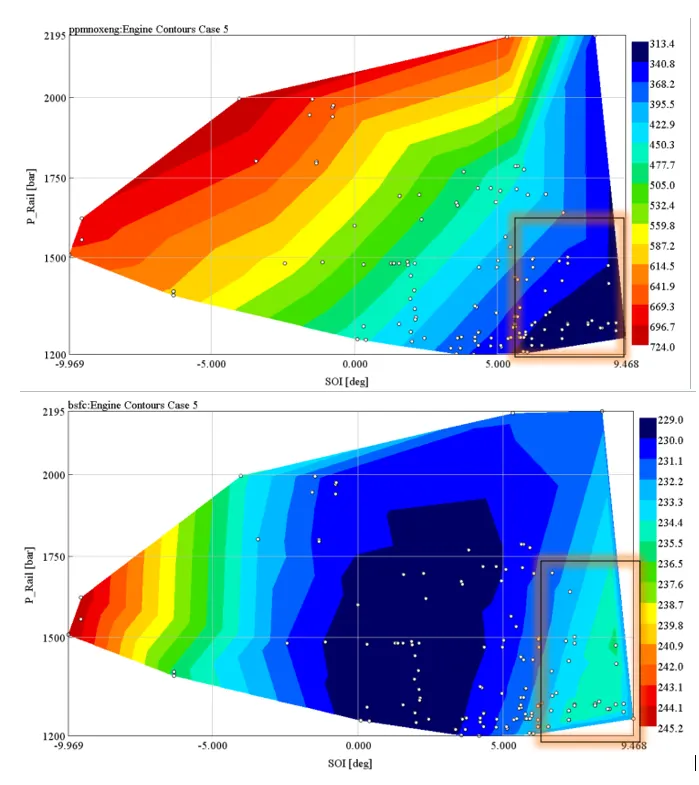
On comparing both the contours at the hilighted zones, we can observe that for NO it is minimum and for BSFC in the same zone it is increasing. Based on the final required targets we need to modify with the necessary changes.
Hence from the above plots and contours we need to choose the most optimal point from the obtained results and these values are used inorder to run for the better BSFC and NOx. In the similar way we can select various parameters and optimisation is carried out. The main import consideration here is sensitivity of the parameter to the response i.e. it should have high sensitivity for the better optimizaion.
Conclusion:
- The "Diesel_4cyl_DIpulse_injratemap" is explored and the procedure for optimization is studied using this example.
- Considering various parameters and responses, the optimum points are identified and plotted for various conditions.