Assignment 7-Side Pole Crash Simulation Challenge
Objective:
To simulate a side crash of the given BIW with a cylindrical pole and analyse the results for the various important result points of the side part of the car.
Step 1: Setting up the Simulation - Hypermesh
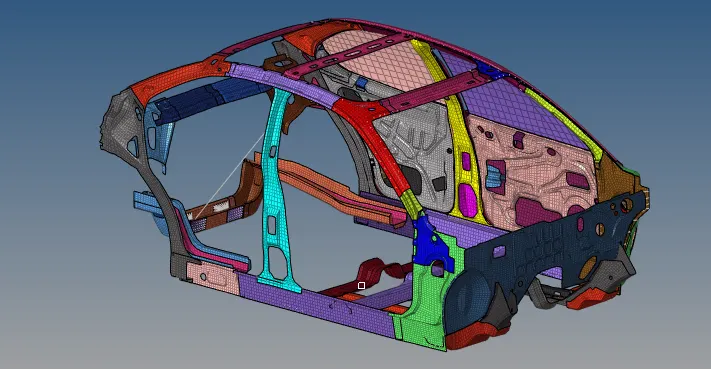
The given file is imported into Hypermesh and the various components of the model can be viewed as shown below.
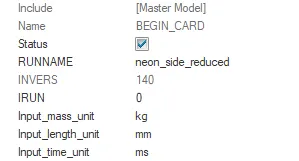
The unit system used in the model can be viewed using the BEGIN card. The units are kg-mm-ms.
Interface creation for self contact - Type 7
The type 7 contact is defined for all surfaces as shown below.
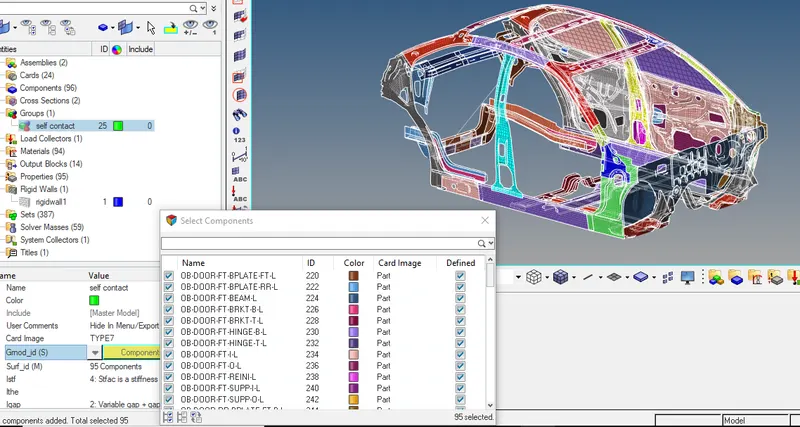
The type 7 card is defined with all recommended parameters as seen earlier.
Istf = 4
Igap = 2
Idel = 2
Stmin = 1.0
Fric = 0.2
Gapmin = 0.5
Inacti = 6
Iform = 2
Rigid wall creation
A rigid wall simulating the side pole is created normal to the side plane of the car with the given parameters as shown below.
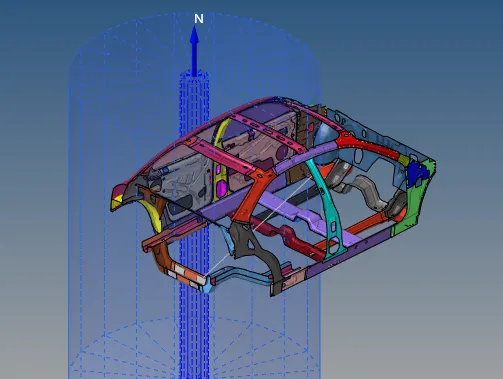
The search distance Dsearch = 1000 and the friction value FRIC is specified as 0.1, as given in the problem statement.
Mass and centre of gravity
The initial mass and the cg location of the model can be viewed using Tools --> Mass details.
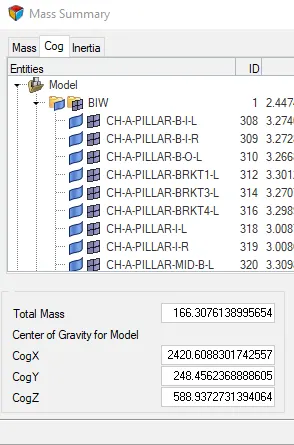
The initial mass is 166.30 kg and the CG location can be viewed according to the co-ordinates specified as shown below.
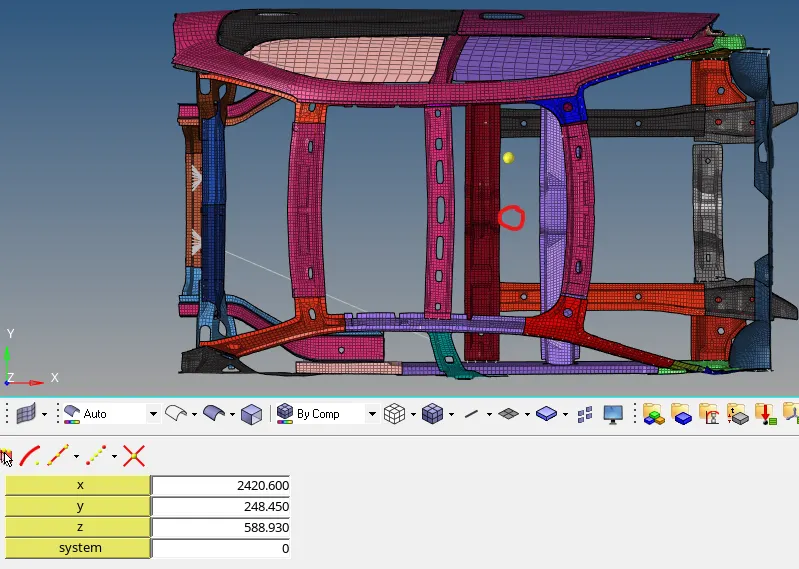
The node specifies the initial CG location. This needs to be moved to the point (approx) specified by the red circle, and the mass needs to be increased to meet the target mass of 700 kg.
This can be done by using added mass to increase the mass at the right portion of the model as shown below.
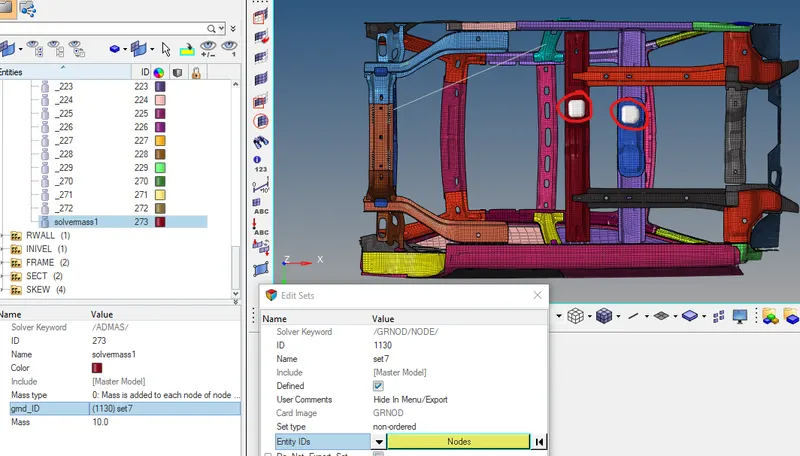
A mass of 10 kg is added to each node for a total of 53 nodes as shown above. Therefore the total mass added is 530 kg.
The final mass and the CG location of the model after the added mass of 510 kg is 696.30 kg as shown below.
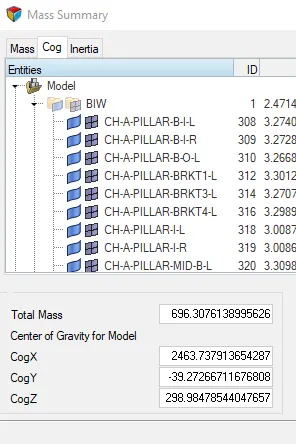
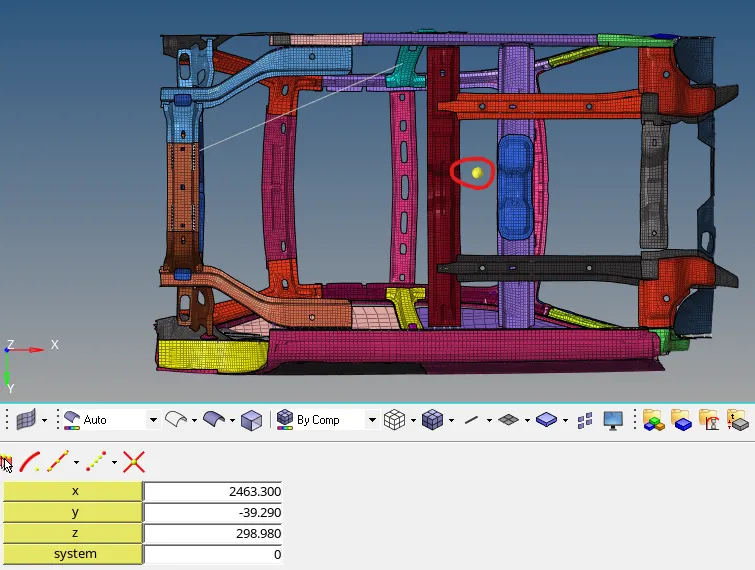
The CG is now at the required location.
Initial velocity
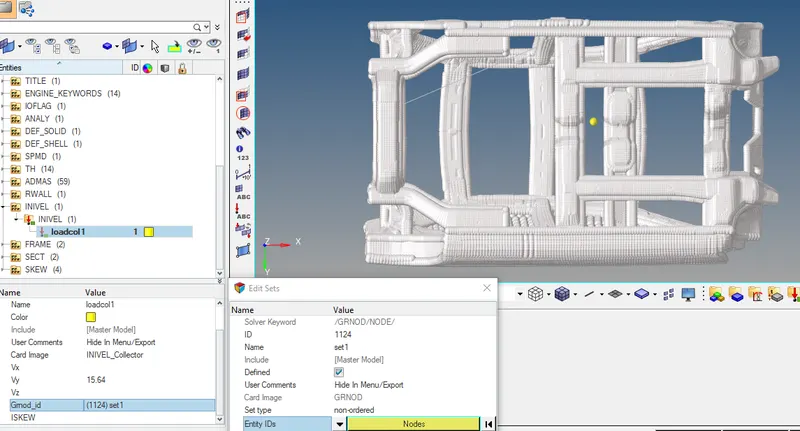
An initial velocity of 35 mph is assigned to all nodes of the model as shown below. Since the unit system used is kg-mm-ms, the velocity is 15.64 mm/ms along the Y-direction.
Cross - sections
In order to view the forces at important points across the body, cross sectional planes are created at 2 locations as shown below. These are
Cross member 1
Cross member 2
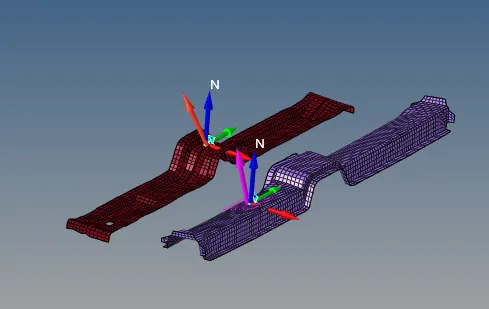
The local frame of the cross-sections, located at the centre of gravity of each section can be seen in the figure above.
Intrusions
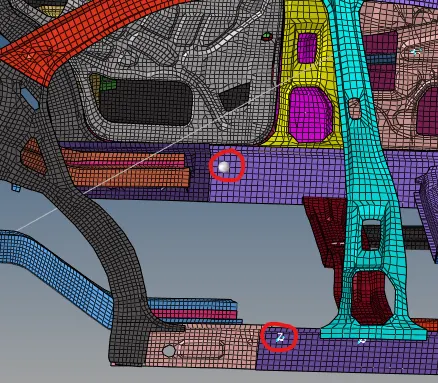
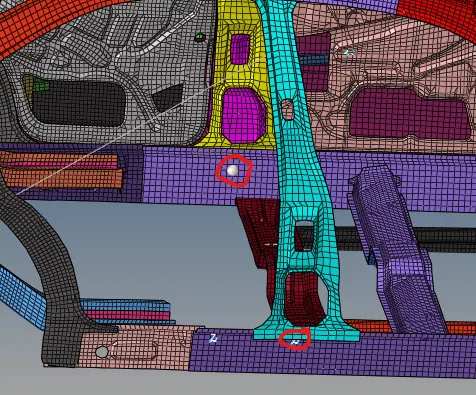
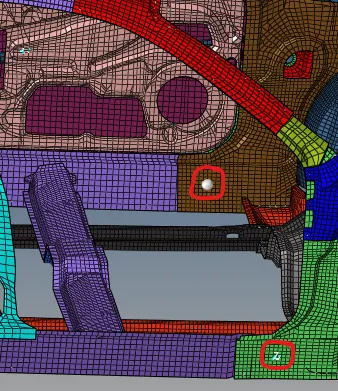
Intrusions are to be measured at three locations namely the Fuel tank, Hinge pillar and the B-pillar as shown below.
The following images show the skew frames and the corresponsing nodes at all the three locations.
Fuel tank
B-pillar
Hinge pilllar
Peak velocity - Inner node of door
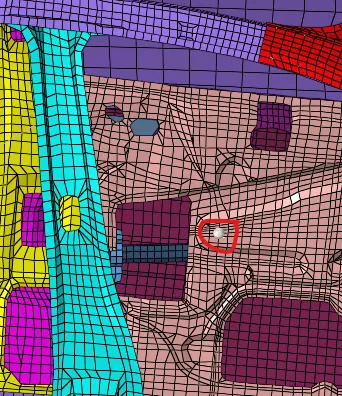
The skew and the node needed in order to obtain the peak velocity at the inner part of the door is shown in the image below.
The model setup is now complete and it can now be simulated to view the results.
The runtime is 80 ms and the frequency of animation plots is 5 ms.
Step 2: Simulation results
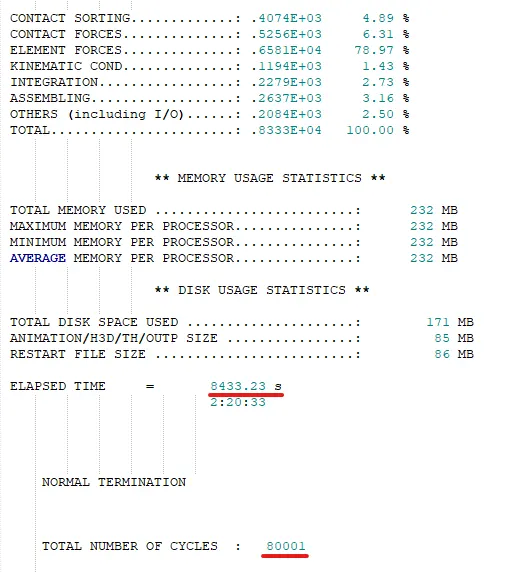
The simulation is completed and the key run parameters such as number of cycles and simulation time can be viewed in the 0001.out file.
Mass and energy error
The final mass error and energy error as given in the 0001.out file is shown below.
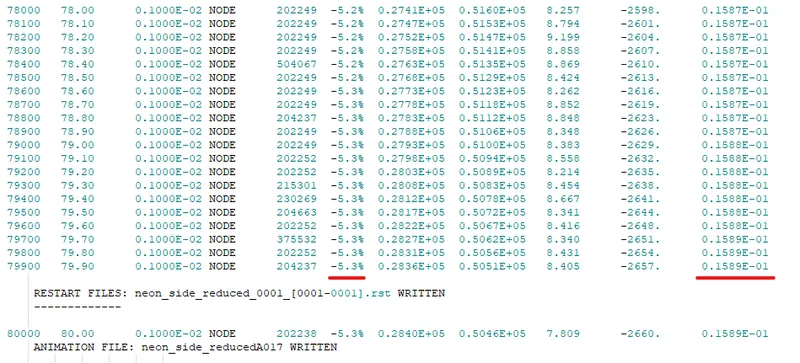
The final energy error is -5.3% and the final mass error is 0.1589e-1 or 1.5%, which is less than the error threshold of 5%.
Therefore, both the mass and the energy error are within acceptable limits.
Displacement and Von mises stress
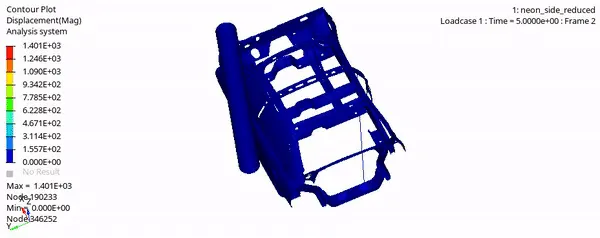
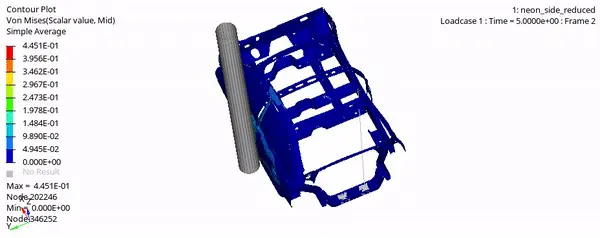
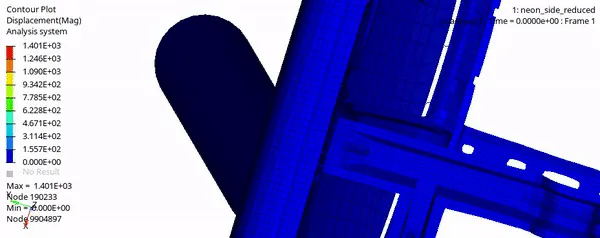
The displacement and von mises stress values can be observed in Hyperview using the h3d file as shown below.
Energy plot
The energy conservation can be checked by plotting data from the time history T01 file in Hypergraph 2D as shown below.
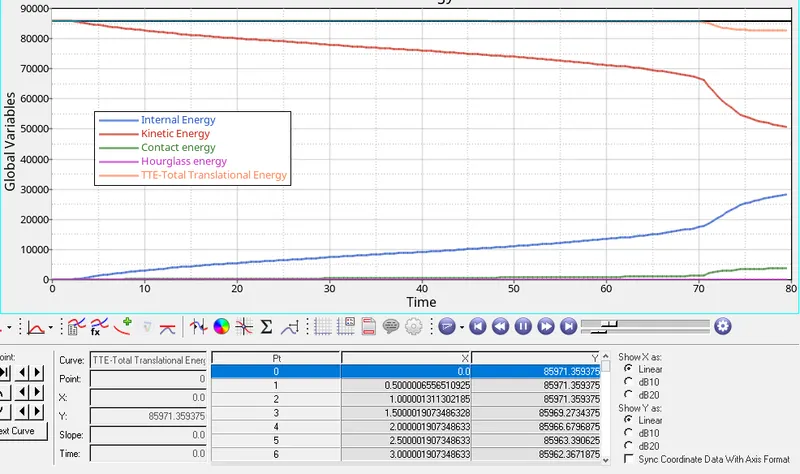
As the simulation proceeds, the kinetic energy decreases and the internal energy, which is representative of the energy absorbed during the crash, increases. The total translational energy TTE, which is the sum of all the energies has a peak value of 85971.39.
Sectional forces
The cross member in red is Cross section 1 and that in purple is Cross section 2.
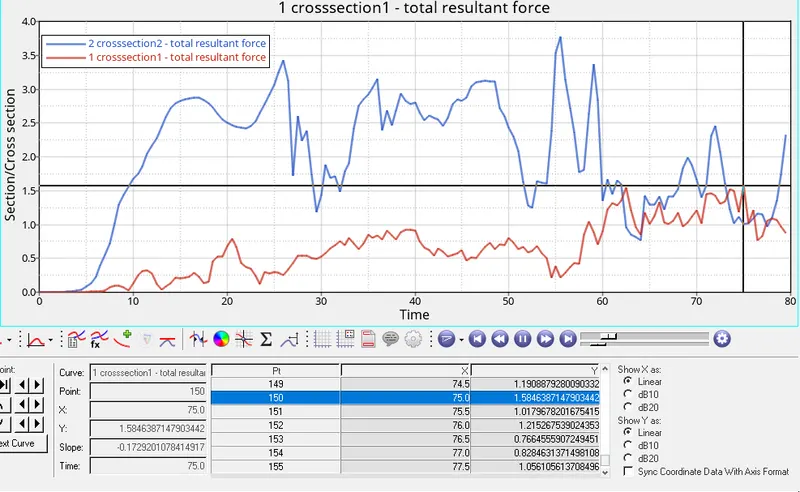
The image below shows the cross sectional forces at both cross sections.
Cross section 1
Cross section 2
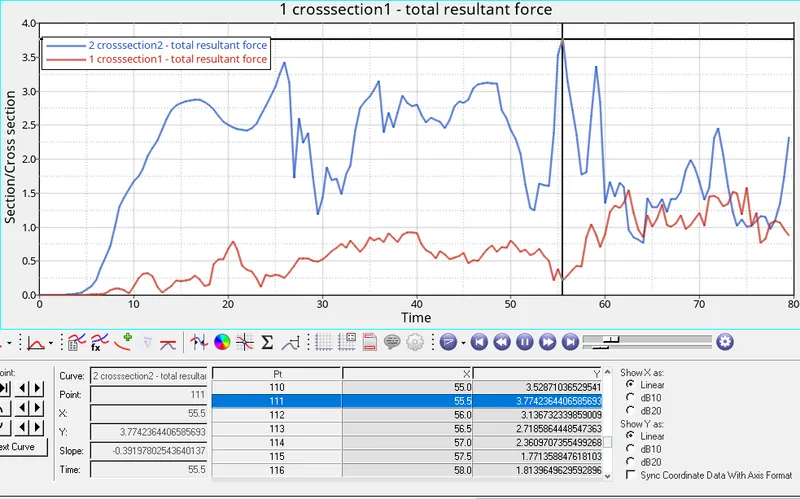
The forces on the cross section 2 are considerably higher than section 1, mainly due to the fact that it is on the side closer to the side pole and it experiences impact before section 2. The peak force is experienced at around 5 ms The forces on section 2 on the other hand, increase gradually and reach a peak at around 75 ms, right before the end of the simulation.
The peak forces are
Cross section 1 - 1586 N
Cross section 2 - 3774 N
Intrusions
The intrusions on the given nodes can be viewed in the plots shown below.
1. Fuel tank
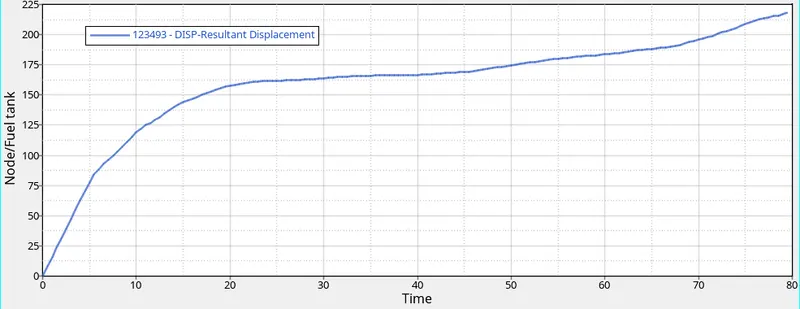
The displacement is 218.14 mm
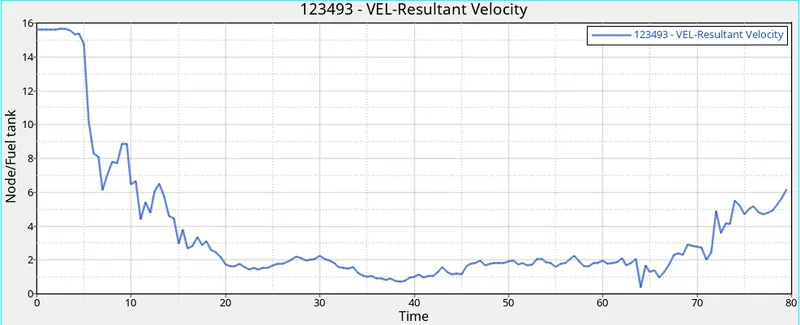
The velocity plot shows the resultant velocity decreasing from an initial value of 15.64 mm/ms to around 6.15 mm/ms at the end of the crash event. There is a slight increase in velocity towards the end of the simulation, which is due to one of the cross members impacting the fuel tank location and pushing it towards the side pole again, after it has rebounded from the initial contact with the side pole.
This behaviour can be visualized in the animation below.
2. B-pillar
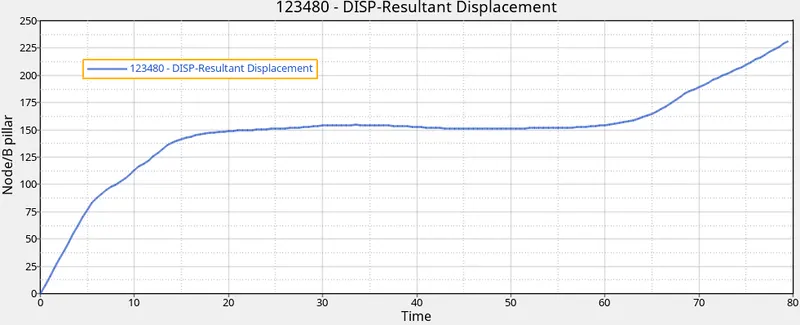
The displacement is 231.43 mm
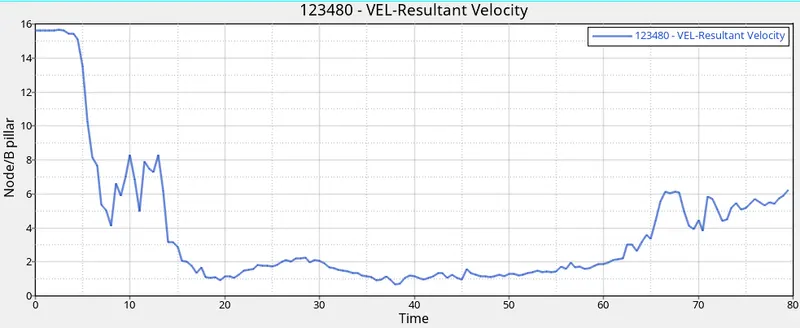
The velocity plot shows the resultant velocity decreasing from an initial value of 15.64 mm/ms to around 6.22 mm/ms at the end of the crash event. There is a slight increase in velocity towards the end of the simulation, which is due to one of the cross members impacting the B-pillar location and pushing it towards the side pole again, after it has rebounded from the initial contact with the side pole.
2. Hinge pillar
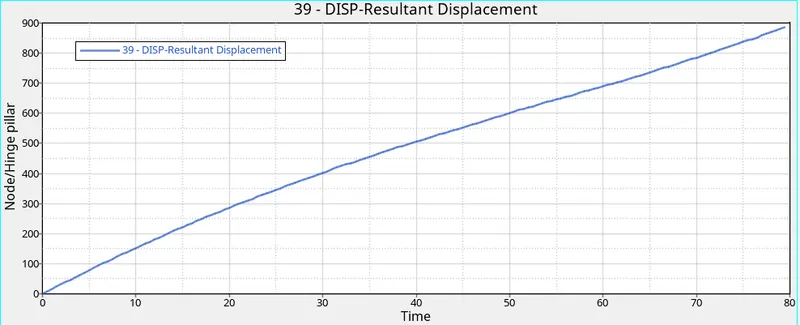
The displacement is 885.72 mm
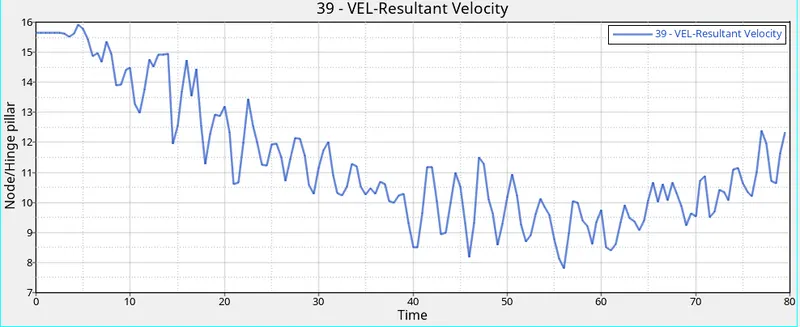
The velocity plot shows the resultant velocity decreasing from an initial value of 15.64 mm/ms to around 12.32 mm/ms at the end of the crash event. There is a slight increase in velocity towards the end of the simulation, which is due to one of the cross members impacting the hinge pillar location and pushing it towards the side of the impact, after the initial contact with the side pole.
This behaviour can be visualized in the animation below.
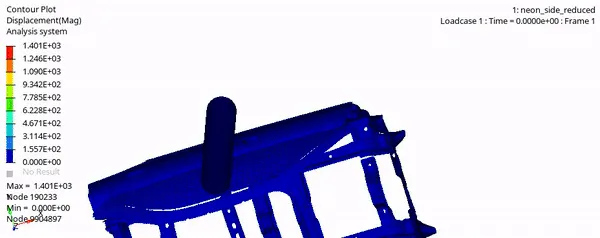
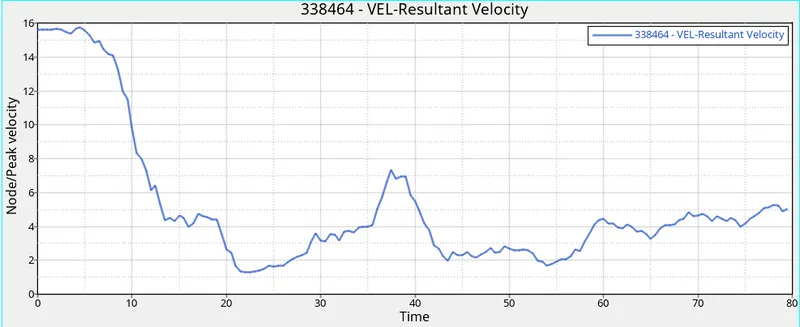
Peak velocity - Door inner
The door inner node has a peak velocity at the beginning of 15.64 mm/ms. As the simulation proceeds, a peak of 7.34 mm/ms appears at 37.5 ms as shown in the image below.
Conclusion
The model has been simulated for a side impact against a cylindrical pole and the key results have been discussed. It can be observed that the right placement of masses and components plays a huge role in deciding the extent of stress, deformation and forces and energy absorbed in the crash.
Simulation of the original (300K) model would result in more accurate simulation results.
The time history file is unable to be uploaded in the challenge assets. It can be found under the link below
https://drive.google.com/drive/folders/1ZValR8xgy-tP7wO-nPQqh-BCC_oKZMjI?usp=sharing