Assignment 7
Neon side crash -BIW
- Check unit system and either follow [Mg mm s] or [Kg mm ms].
- Create an appropriate interface, friction 0.2 and recommended parameters.
- Make sure of no penetration and intersections.
- Create a rigid wall with friction 0.1 as per reference model.
- Compare the model weight with the reference model and use added masses to reach target weight 700kg while getting CG about the required range.
- Initial velocity as shown in the picture.
- Use model checker to ensure good quality.
- Timestep :0.5 to 0.1 microseconds.
- Run 80ms.
Output requests:
- Sectional force in the cross member.
- The intrusion at B pillar, hinge pillar and fuel tank region. Provide recommendation on what can help to reduce Fuel tank intrusion.
- Peak velocity of the inner node of the door.
Note:
- Submit your simulation files including time and h3d files.
- Plot energies and notice any difference.
- Explain your errors and how to rectify?
Solution:
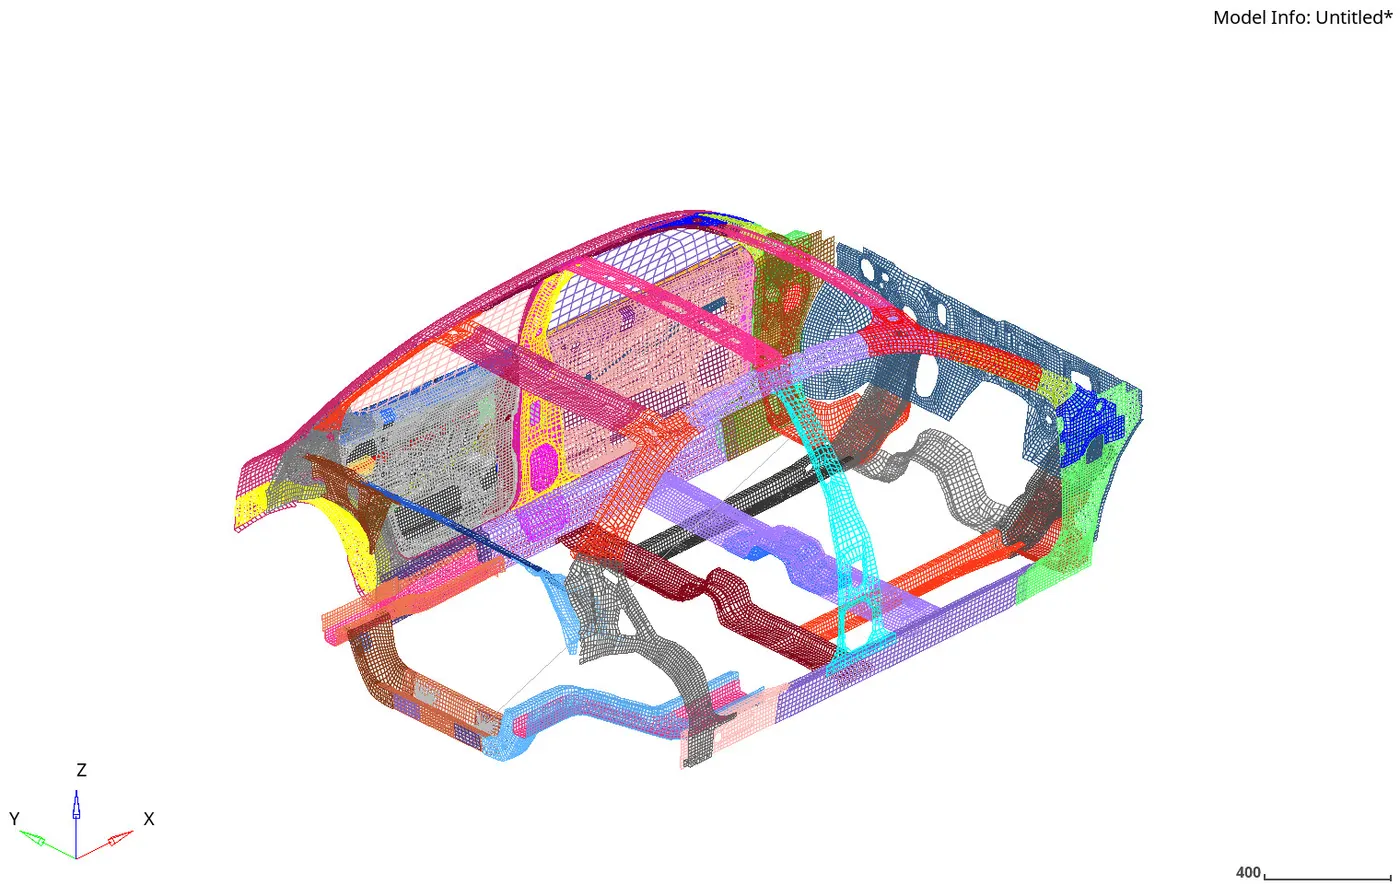
Figure-1 illustrates the side impact assembly under review.
 |
Units
For this assignment, the unit system kg mm ms is followed.
Interface
The existing interfaces are deleted and a new Type 7 interface is created using the recommended parameters defined in Table-1.
| gap | 3 |
| Gapmin | 0.5 |
| Inacti | 6 |
| Istf | 4 |
| Stmin | 1000 |
| Idel | 2 |
| Iform | 2 |
| nu | 0.2 |
Penetration and Intersection Check
The model was checked for any penetration and intersection using the Penetration Check Tool. The tool reported zero collisions.
Rigid Pole
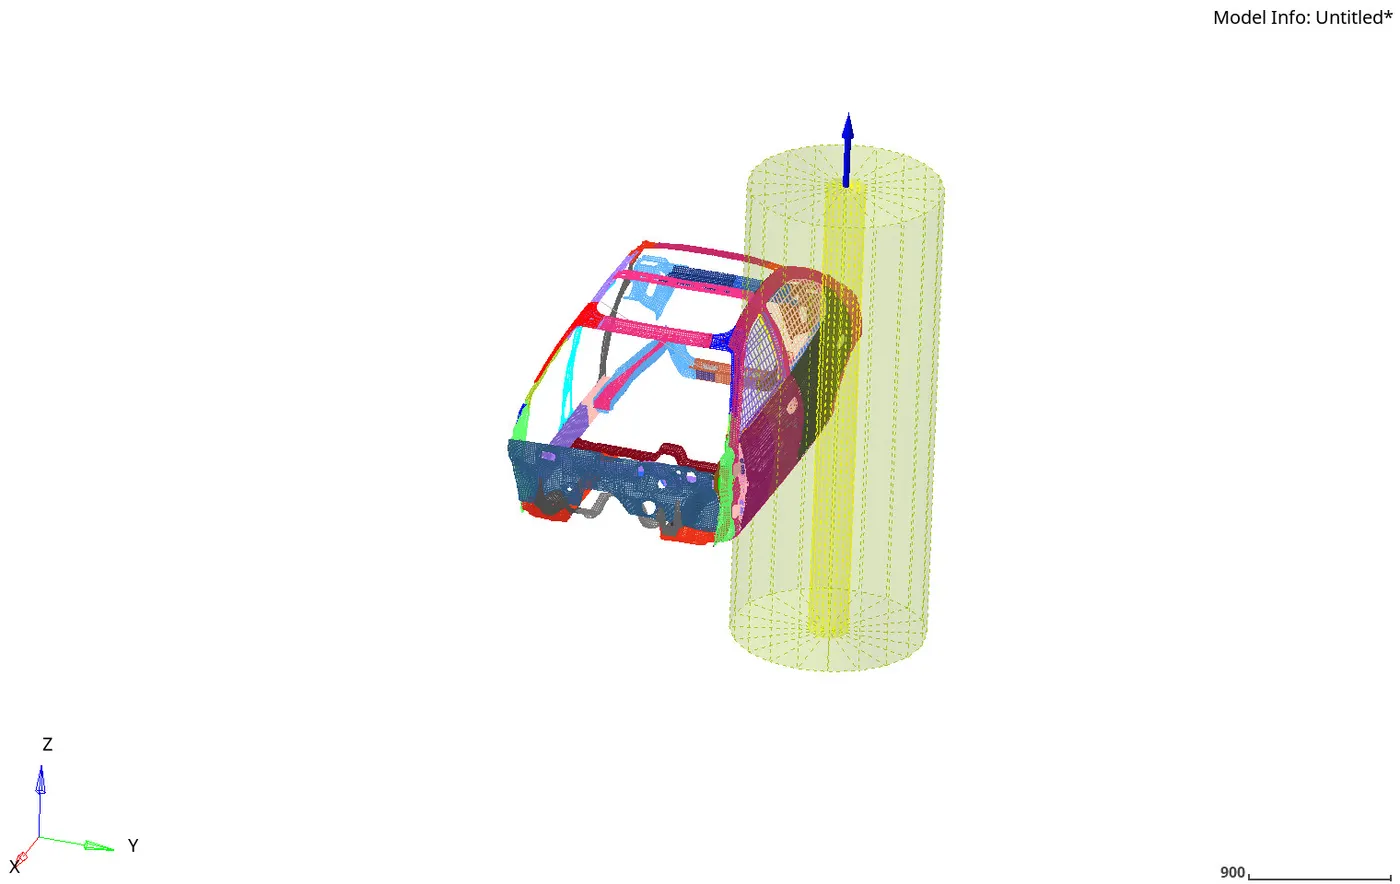
To simulate a crash pole, a rigid cylindrical wall is inserted into the model using /RWALL/CYL. The dimension and the position fo the crash pole is approximated using a crash pole standard FMVSS No. 214, DYNAMIC SIDE IMPACT PROTECTION. A friction coefficient of 0.1 and a dsearch value of 500 was considered. Figure-2 describes the rigid pole definition.
 |
COG and Target Weight
To meet a target weight of 700 kg and the COG value from the full-scale model, around 500Kg of mass was added to the model using ADDMASS. The COG was matched to the full-scale model with less than 10% error considering the XY plane.
Initial Velocity
An initial velocity of 8.75 mm/ms is described in the side pole impact standard which is added to the model using /INIVEL.
Model Checker
Model checker is run to obtain a good quality model. The errors are identified and were rectified.
Run Time
A run time of 80ms is defined.
Sectional Force
cross-sections are defined at the lower rails and seat reinforcement cross member in order to measure the sectional forces.
Intrusions
To measure the driver head, fuel tank and B Pillar intrusions, the appropriate nodes and skew's are defined.
Inner Door Velocity
To measure the inner door velocity, again appropriate node and skew is defined.
Results
A maximum energy error of 1% and a mass error of 1.04% was recorded, which is within the acceptable limits of deviation.
Animation
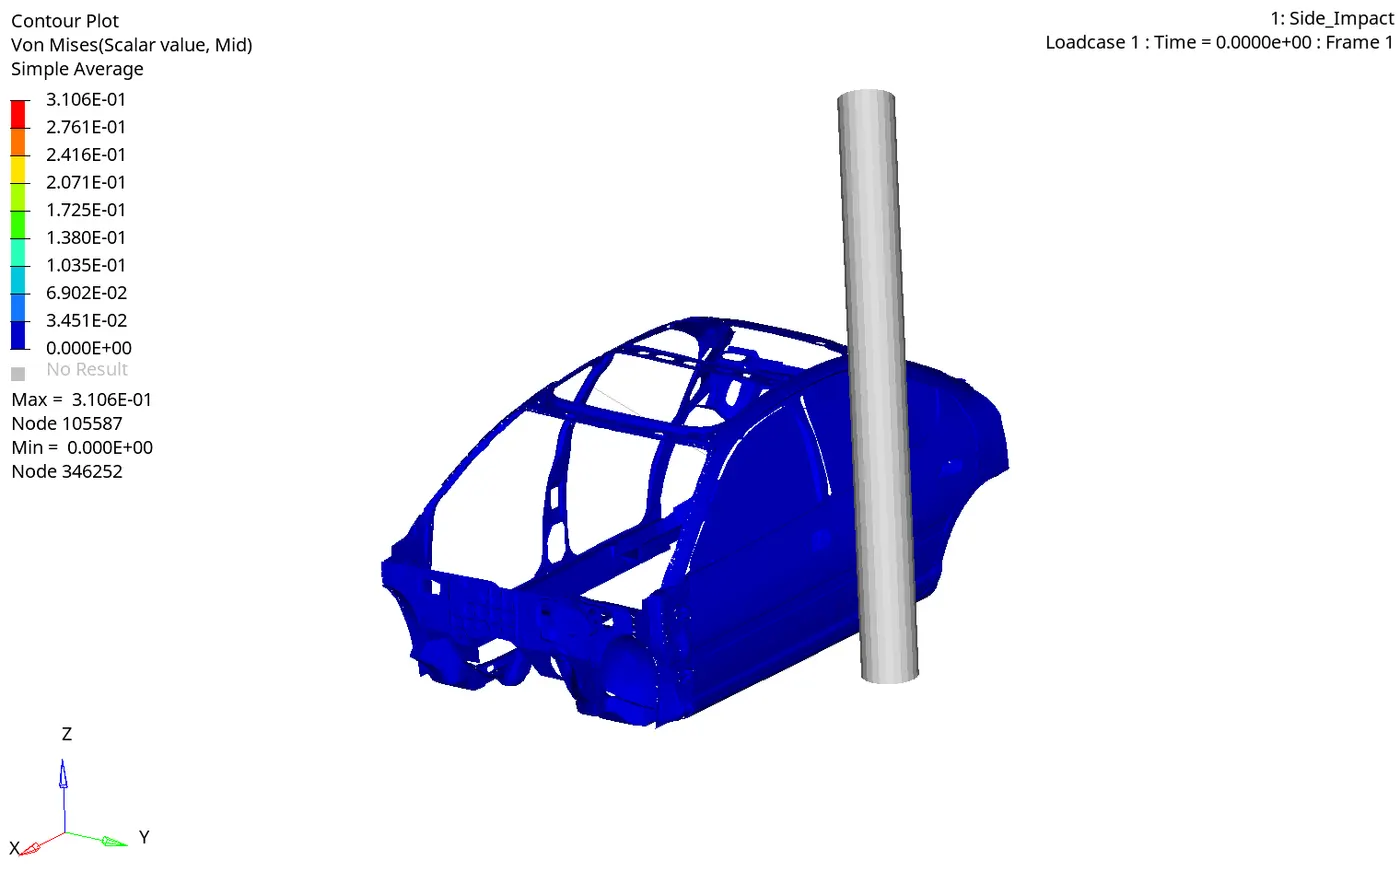
Video-1 describes the variation of von-mises stress River the side crash assembly. It is observed that with increasing intrusion the stress initiates at the joint of contact and translates towa the other side of the assembly the means of the roof and follow cross-members.
 |
Global Energies
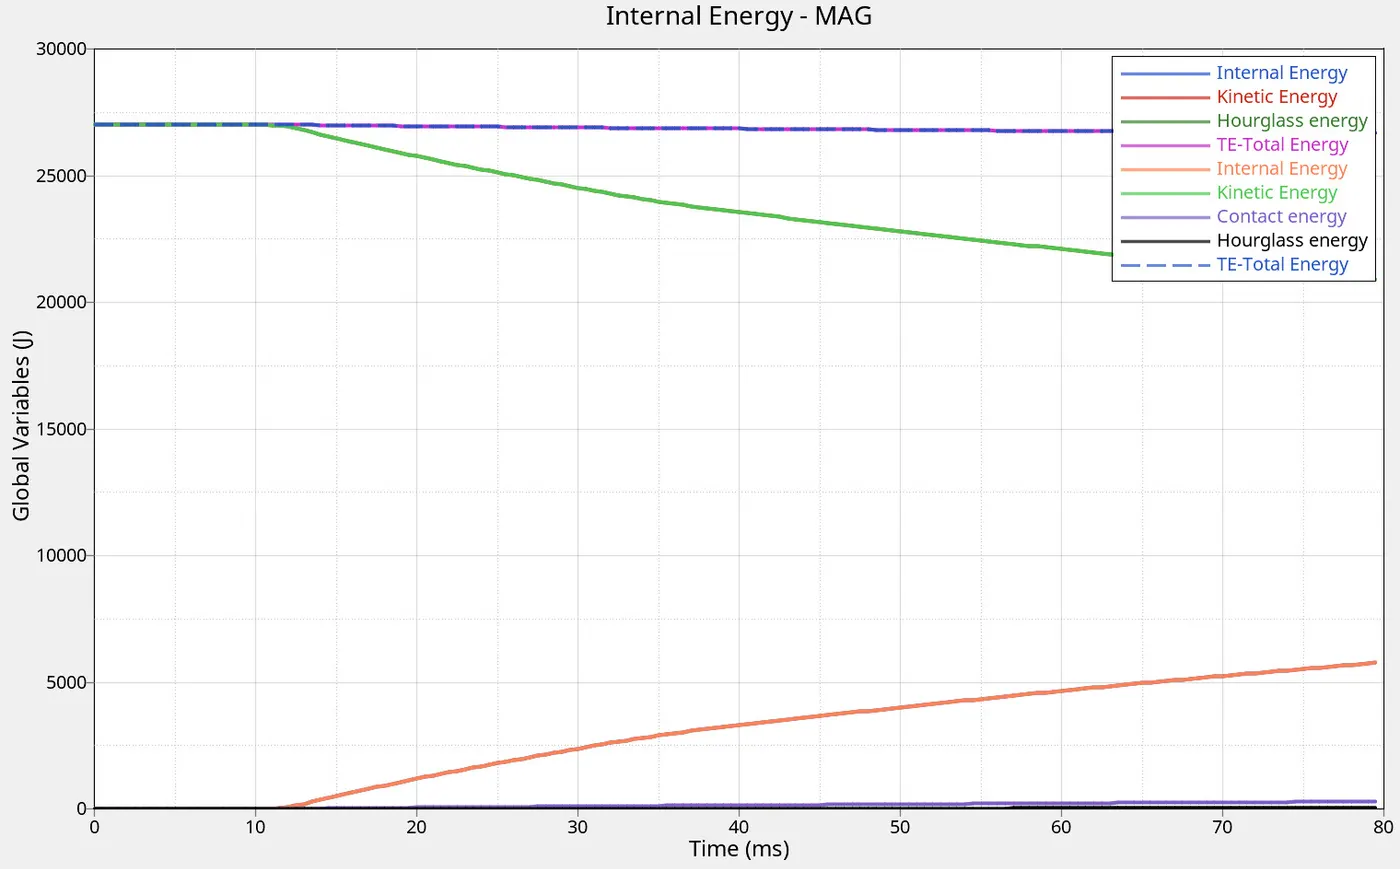
Figure-3 illustrates the variation of internal, kinetic, hourglass and total energy. It is observed that the contact entry is less than 5% of the total energy which is expected. Also, with hourglass energy is observed to be under acceptable limit.
 |
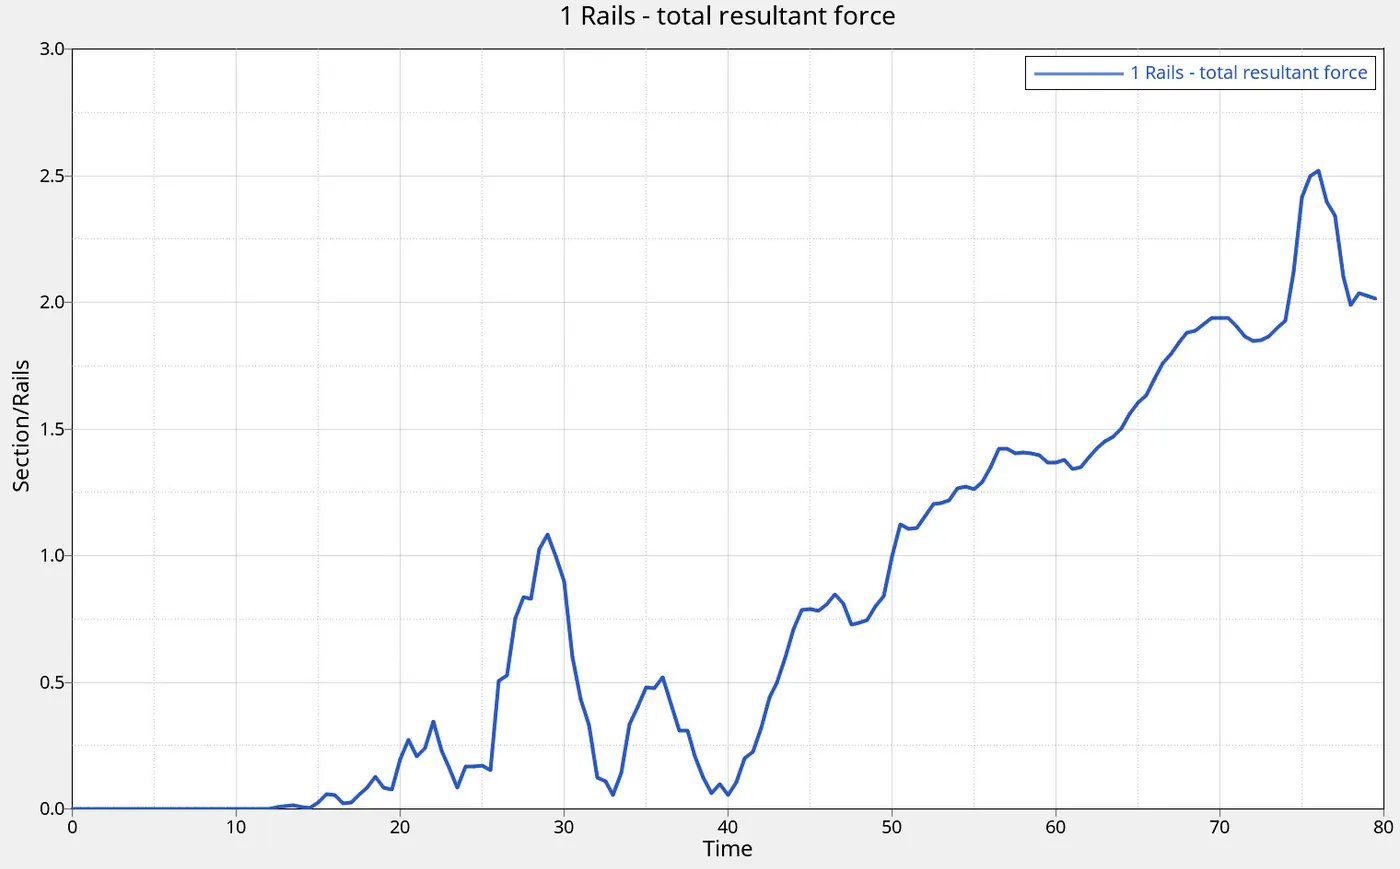
Lower Rails Sectional Force
Figure-4 illustrates the variation of the sectional force of the lower rail component, It is observed that the section force increases with time.
 |
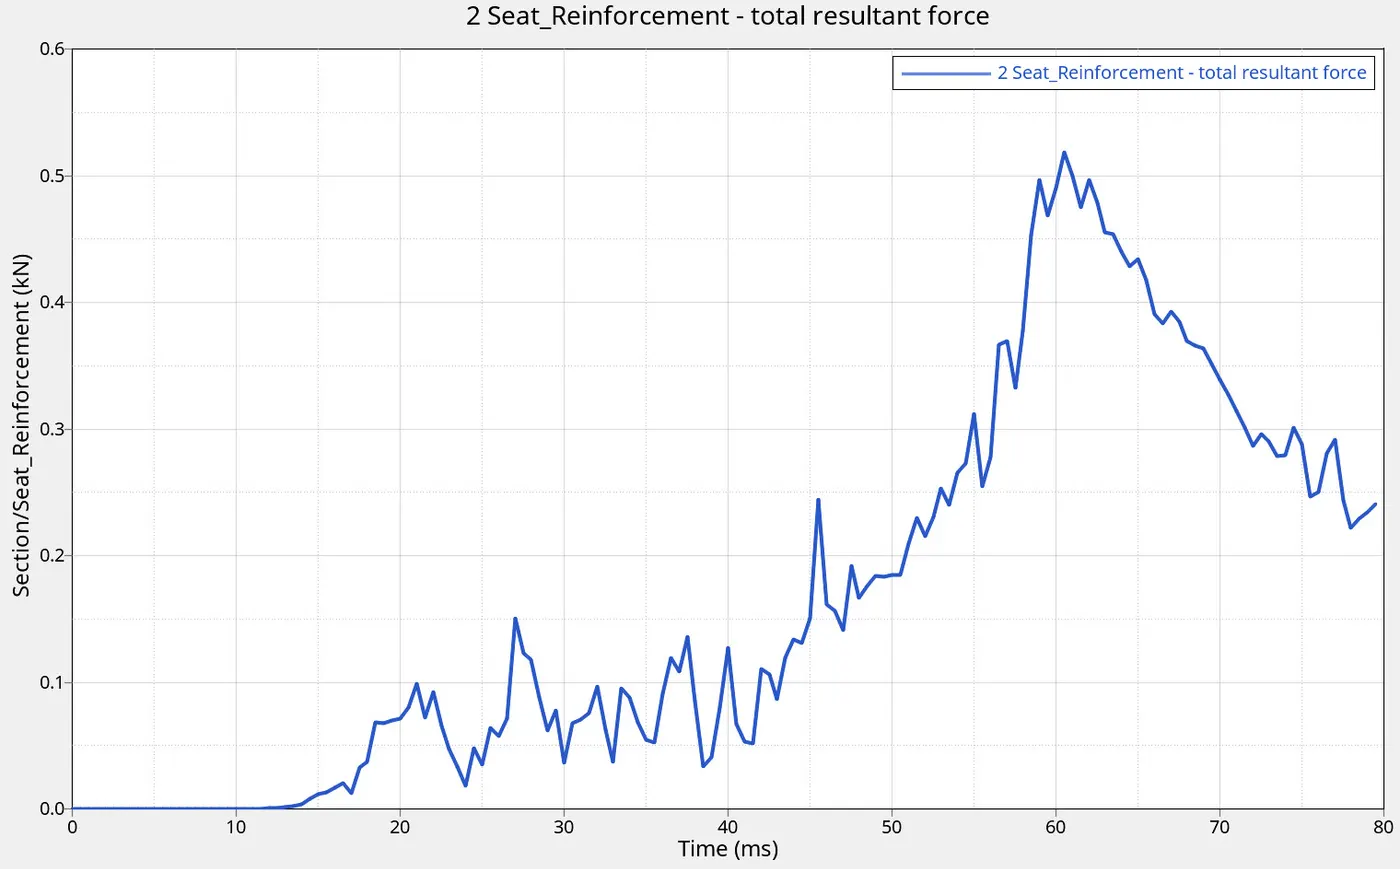
Seat Reinforcement Sectional Force
Figure-5 illustrates the variation of the sectional force in the seat enforcement cross member with time. It is observed that with force reaches its peak at 60ms. Also, the sectional force carried by the lower rails is approximately 5 times higher than the sectional force carried by the seat reinforcement rail.
 |
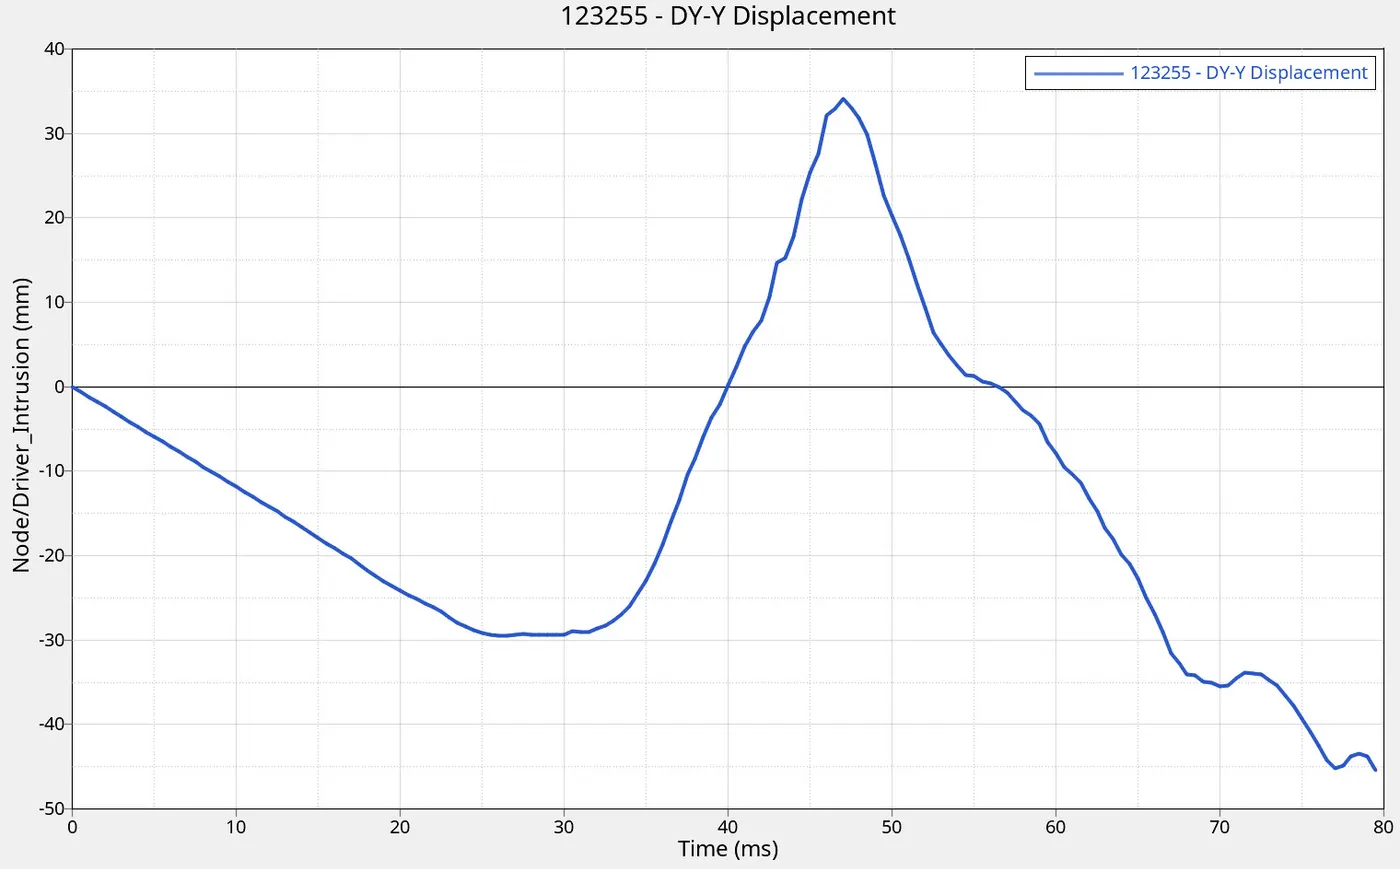
Driver Head Intrusion
Figure06 illustrates the variation of the intrusion of the lower cross member of the driver side compartment relative to the passenger side lower cross member. A maximum intrusion of 45mm is observed.
 |
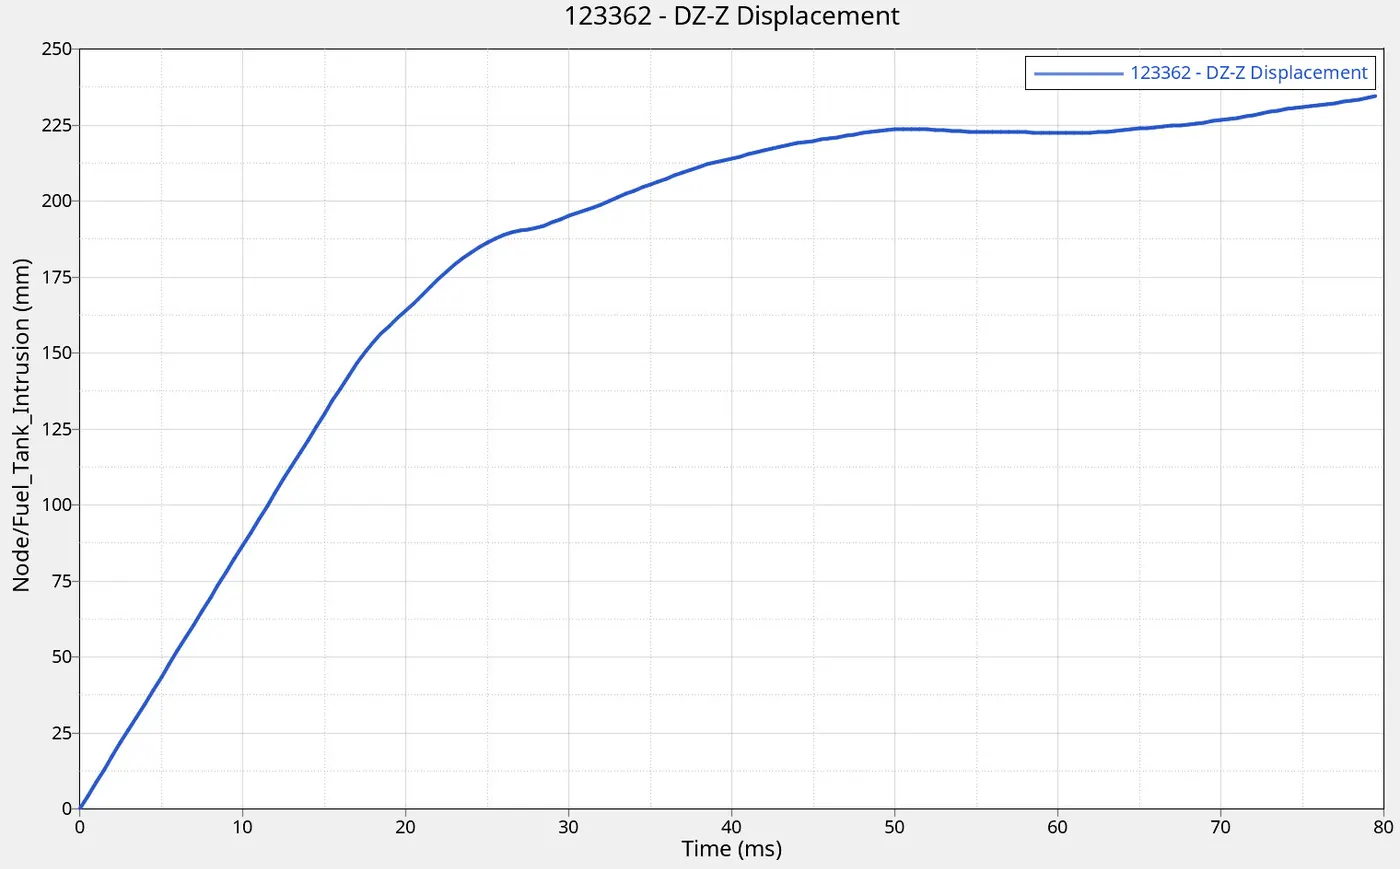
Fuel Tank Intrusion
Figure-7 illustrates the variation intrusion of the fuel tank cross member relative to the cross-member from the opposite side. A linearly increasing intrusion is observed until about 20 ms, beyond which the curve tends to plateau. A maximum intrusion of about 235mm is observed.
 |
B-Pillar Intrusion
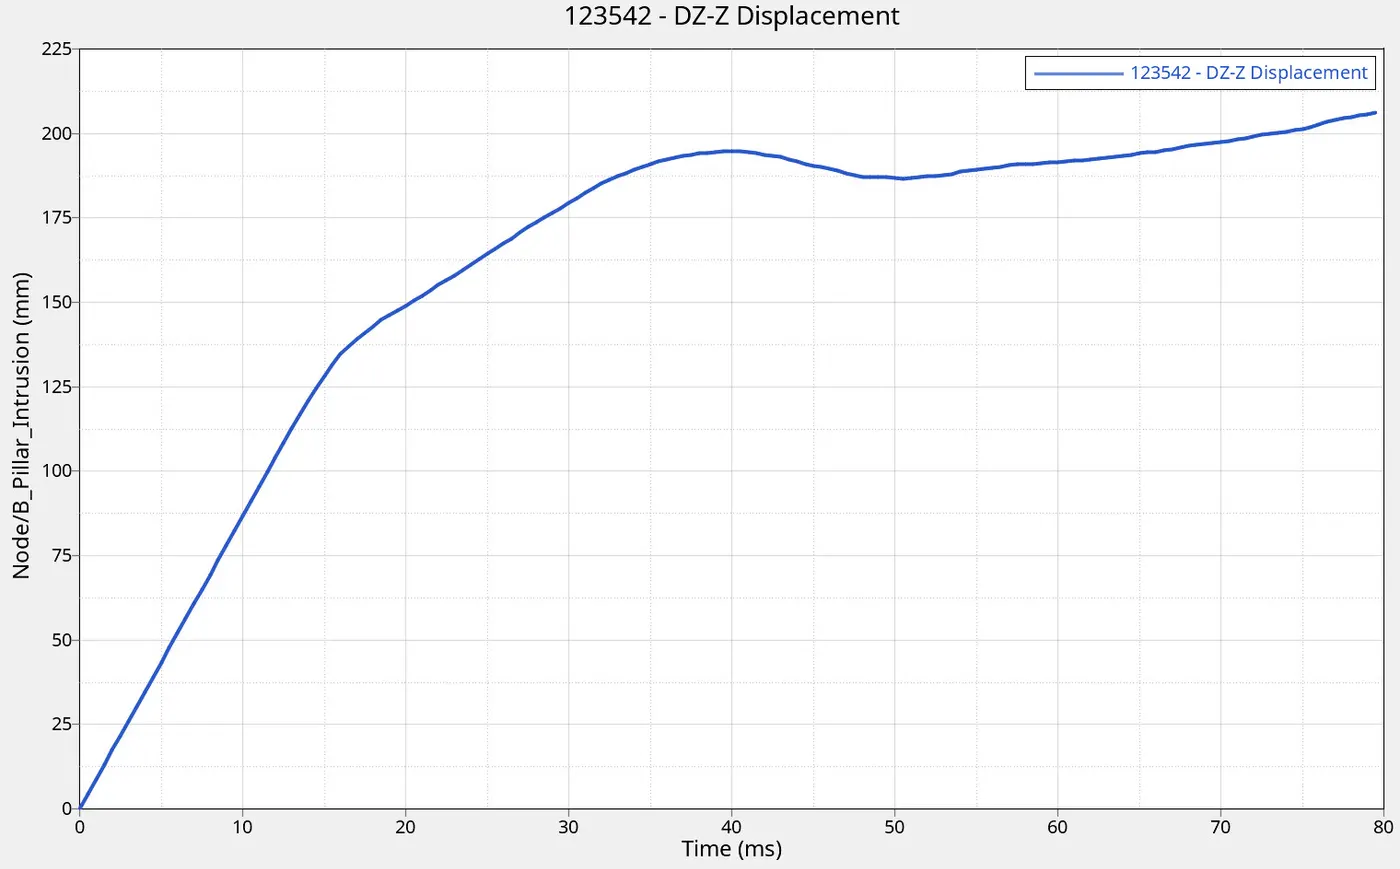
Figure-8 illustrates the variation of the B-Pillar intrusion on the driver side relative to the B-Pillar of the passenger side. A linearly increasing intrusion os observed until 20ms, beyond which the curve tedns to plateau. A maximum intrusion of 200mm is observed.
 |
Driver Door Velocity
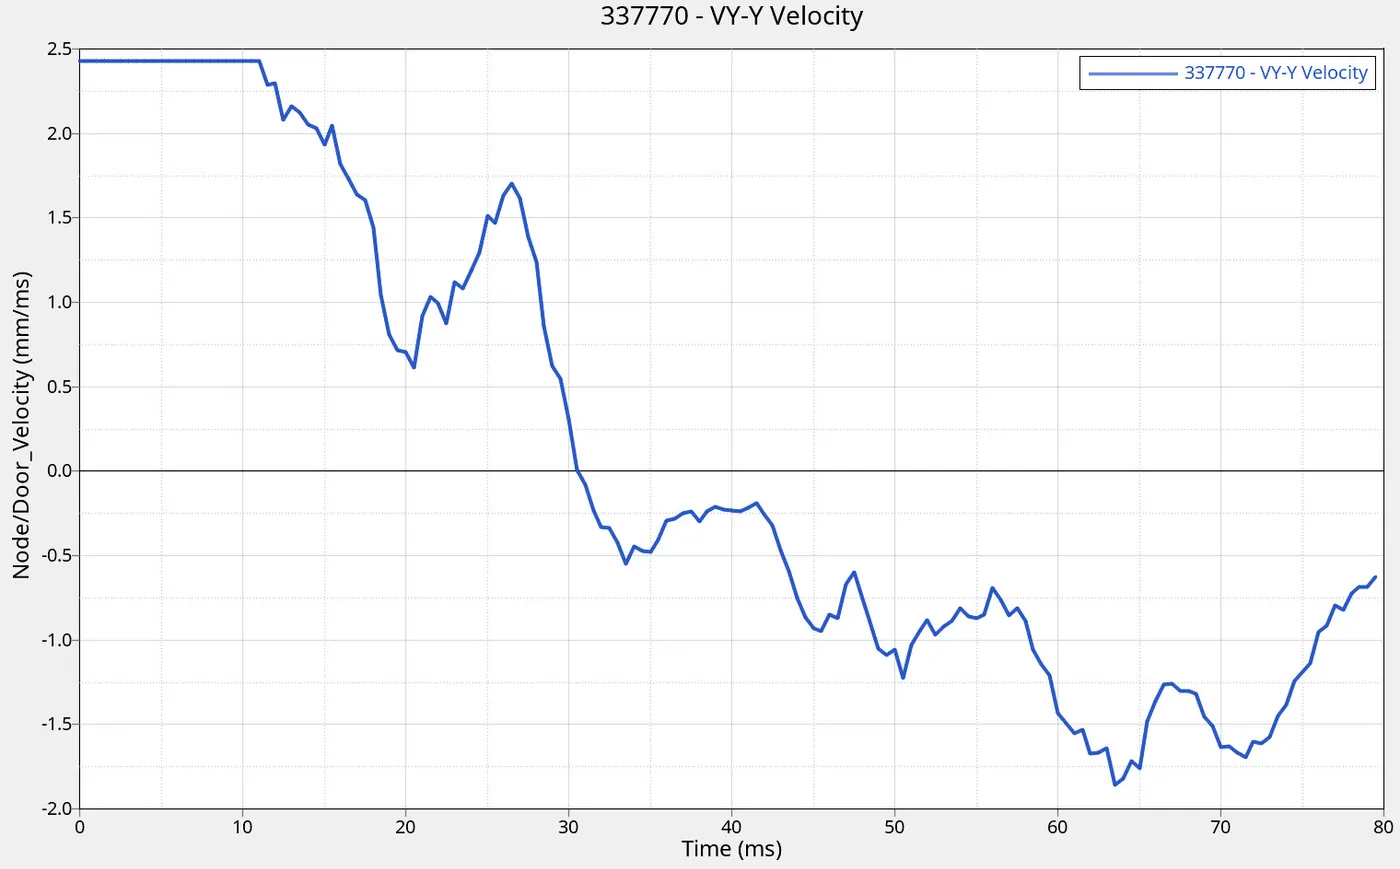
Figure-9 illustrates the variation of the driver door with respect to the passenger side B-Pillar. The velocity remains constant until the impact occurs, beyond which the velocity decreases and changes direction at 30ms and continues to increase in the opposite direction.
 |
Conclusion
The side pole crash performance of assembly has been studied successfully. The simulation files requested are attached to this assignment as a compressed zip file.