Frontal car crash simulation of Dodge Neon BIW using RADIOSS.
AIM: Frontal car crash simulation of Dodge Neon BIW using RADIOSS.
OBJECTIVE: These are the following requirements for this project.
Setup Request:
- Check the unit system and either follow[Mg mm s] or [Kg mm ms].
- Create an appropriate interface, friction 0.2, and recommended parameters.
- Make sure of no penetrations and intersection.
- Correct rigid bodies if any issues.
- Create a rigid wall with friction 0.1.
- Compare the model weight with the full-scale 300k nodes model and use added masses to reach the target weight 700kg while getting CG about the required range.
- Initial velocity 35 mph.
- Use model checker to ensure good quality.
- Time-step :0.5 to 0.1 microseconds.
- Run 80 ms
Output Requests:
- Sectional force in the rails at the location of indicated node 174247.
- The axial force received on the rails from the bumper.
- Shotgun cross-sectional forces.
- A pillar cross-section.
- Acceleration curve received on the accelerometer at the base of B pillar (on B pillar rocker).
- Intrusions on the dash wall 66695,66244.
METHODOLOGY:
- Import the model into Radioss/ Hypercrash.
- Setup the boundary conditions as per given.
- Remove all the unwanted and used components, property cards, sets, groups, joints, etc.
- Check for penetration and intersections
- Setup the output request and check the necessary card status eg. ANIM/DT, ENGINE_RUN, etc.
- Run the model checker and debug the errors and warnings.
- Generate the Radioss file for animation and time history plots.
INTRODUCTION:
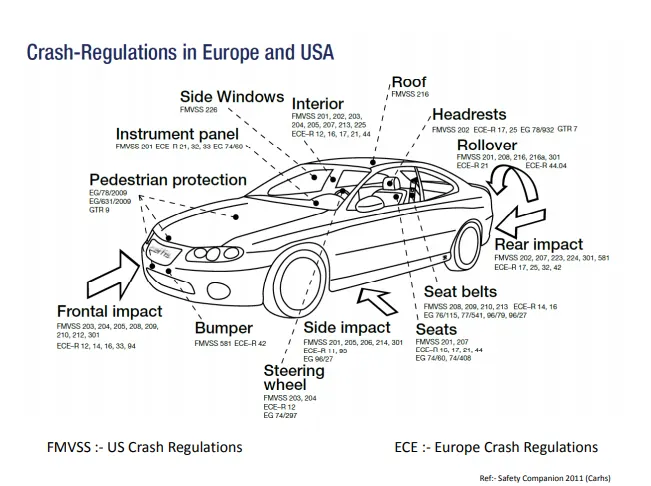
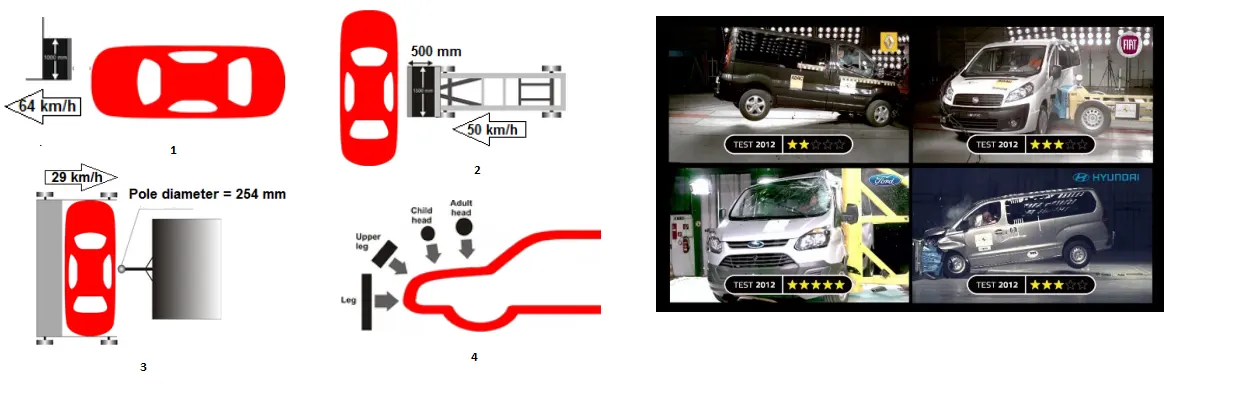
In different parts of the world, there are several vehicle safety assessment programs that perform the crash test in order to increase vehicle safety and ensure that vehicle has good occupant and pedestrians safety. These programs focus on improving the crashworthiness of motor passenger vehicles and reduce the number of injuries. In Europe, there is the New Car Assessment Program (NCAP), based on the program introduced in 1979 by the NHTSA (National Highway Traffic Safety Administration) in the USA. the Euro NCAP frontal crash test standards are followed in India.
Governing Principle
Crash test programs:
- Frontal impact test
- Side impact test
- Side pole impact test
- Pedestrian impact test
Crashworthiness Structure
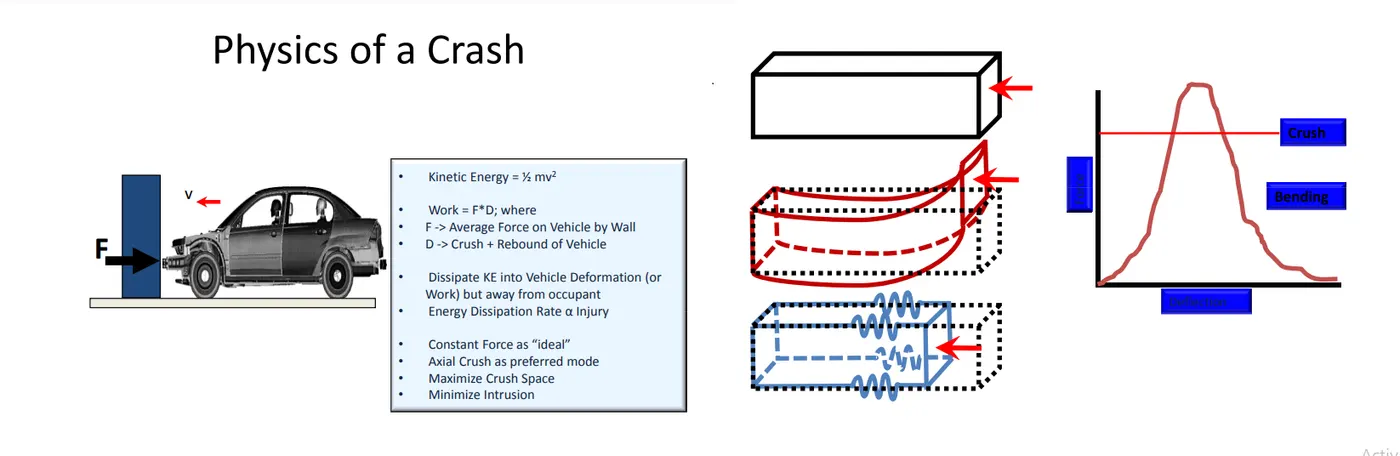
The core idea of crashworthiness structure design is to preset a crumple zone, which can absorb kinetic energy of vehicles during crashes.
The design process of crashworthiness structure is also called as crash energy management (CEM) design, which seeks to control the paths of load transformation andcoptimise energy absorbing. Generally, there are several load paths in the frontal structure of a modern sedan as shown in Figure below
- Path1: Accessories - Bumper - Crash boxes - Longitudinal beams
- Path2: Upper rails - A-pillars
- Path3: Sub-frames - Sill beams
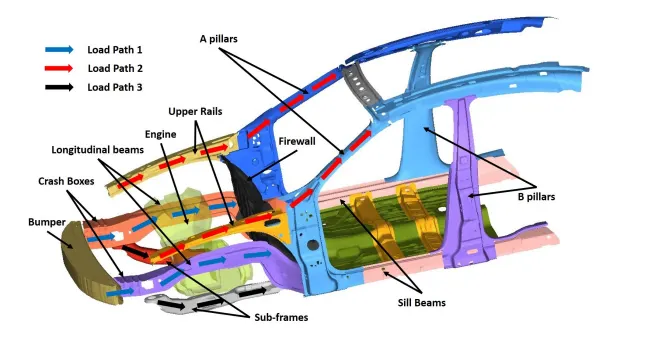
The components in three paths are deformable and can absorb the impact energy. Especially, the first path affords more than 50% of total crash energy in most frontal crashes. For this reason, the components in the first path are highly considered by engineers in vehicle crashworthiness design. The features and functions of these components are discussed as follow:
- Bumper: the bumpers are usually reinforcement bars made by steel, aluminium, plastic or composite material and can absorb crash energy in a certain extent. The main purpose of bumper is to minimize the cost of repair after low speed crashes. It can also benefit to the protection of pedestrian.
- Crash boxes: the crash boxes are generally thin-walled tubes with well-designed cross-section shape and crumple points (e.g. ditches and crash beads). They may collapse in particular pattern to absorb energy efficiently.
- Longitudinal beams: the longitudinal beams are also thin-walled structure, but longer and stronger than crash boxes. The deformation modes of longitudinal beams include folding, tearing and bending. Some reinforcing components may be used to strengthen the beams and optimize the energy absorbing.
Besides deformable part, some components in the vehicle frontal structure should be strong enough. In most crashworthiness studies, engine and firewall are generally considered as rigid bodies. Especially, the firewall refers to the rigid wall between the engine room and passenger cabin. If a vehicle crashes, the firewall can prevent the intrusion of vehicle cabin and therefore ensure enough living space for driver and passenger.
PROCEDURE:
Import the model into Radioss/ Hypercrash.
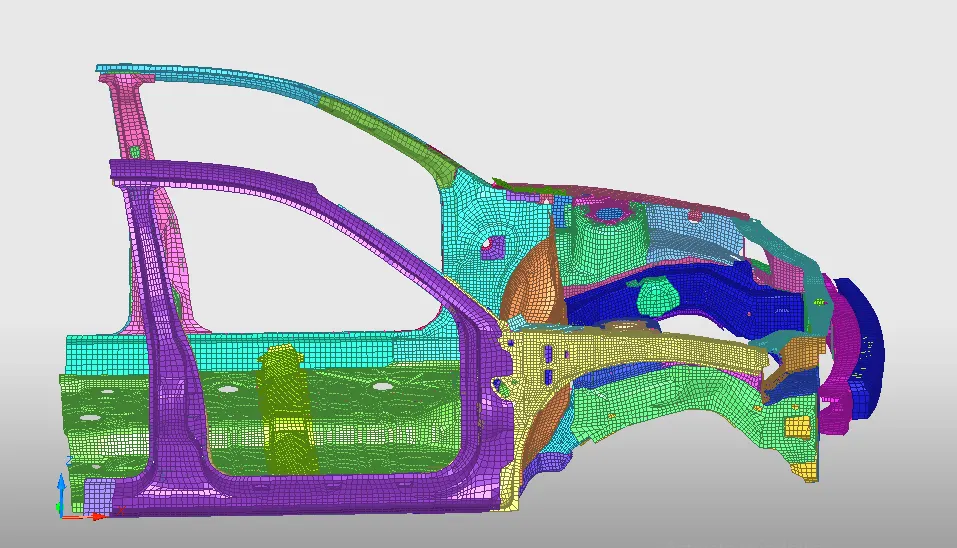
This is the partial BIW view of the full vehicle (300k element ) so that it can get open into HyperCrash (student version). once importing the _0000.rad deck file into Hypercrash or HyperWorks environment we can see it consist of 74 components, 69 material cards, 6 interfaces and redundant spherical and translational joints. The total weight of the car is 188.4 kg with COG point located near dashboard base.
Setup the boundary conditions as per given.
1) Check the unit system and either follow[Mg mm s] or [Kg mm ms].

By checking the _0000.rad file we see the unit system which is followed is [kg mm ms].
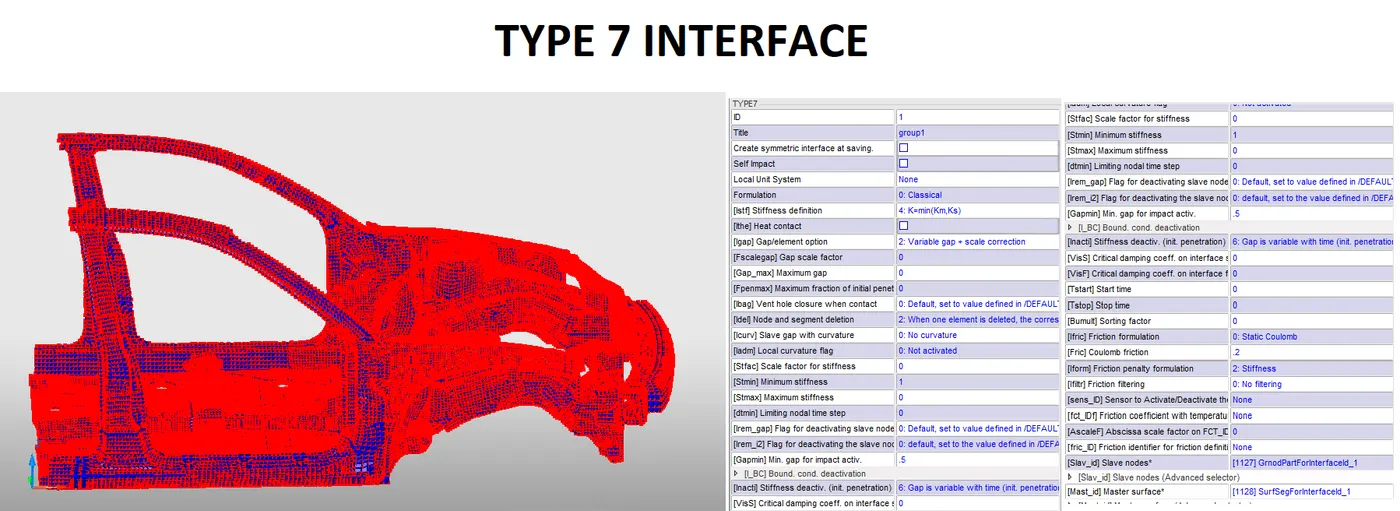
2) Create an appropriate interface, friction 0.2, and recommended parameters.
Before creating any new interface we have to remove all the interfaces which are not required for this simulation. There were 6 interfaces existed when we imported the model delete all.
Now we will create the TYPE 7 interface for whole vehicle body checking the self impact. All parameters provided are as recommended shown below.
3) Make sure of no penetrations and intersection.
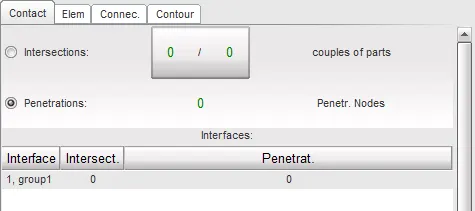
Before moving to the next step we will make sure there are no intersection or penetration of elements. If any fix them by using the tools provided in Hypercarsh and HyperWorks. since there were no penetration or inetrsection during the check we can proceed furthur.
4) Create a rigid wall with friction 0.1.
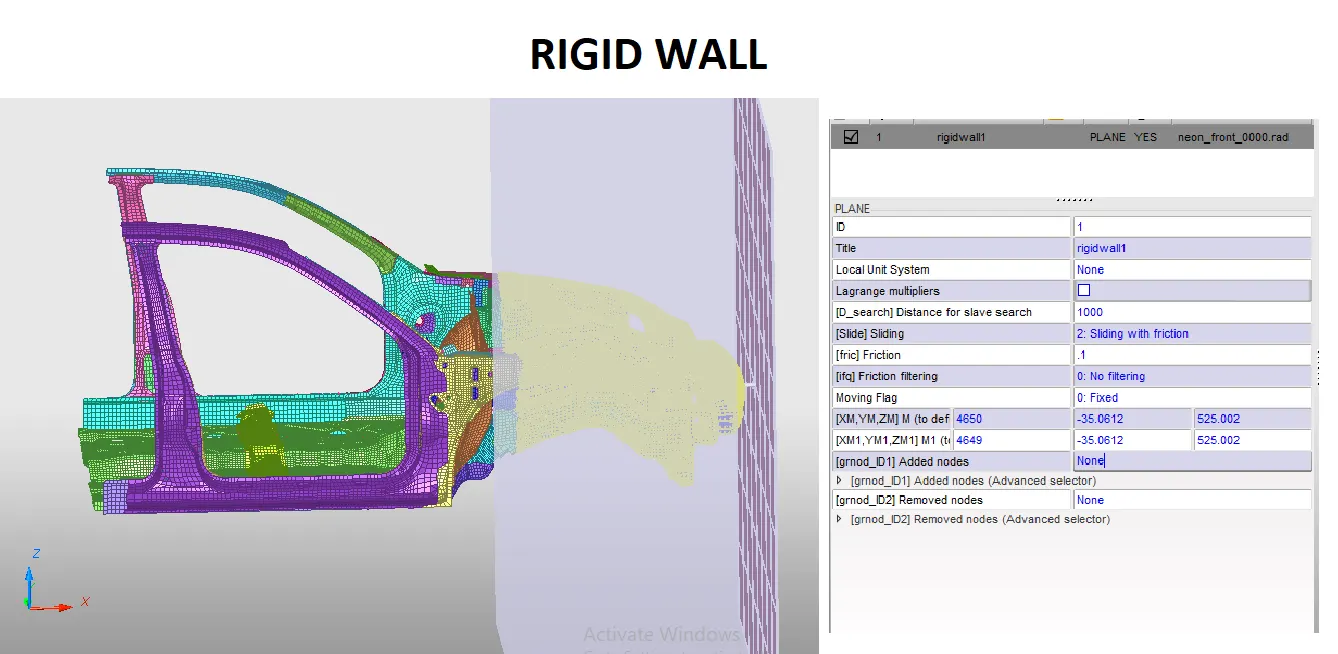
We are providing the plane rigid wall with [fric] Friction value to be 0.1, search distance 1000 and other parameters stated below.
5) Compare the model weight with the full-scale 300k nodes model and use added masses to reach the target weight 700kg while getting CG about the required range.
On checking the mass balancing in the HyperCrash we see the total weight of the model is 188.4 kg and COG somewhere near the base of dashboard area.(as shown below)
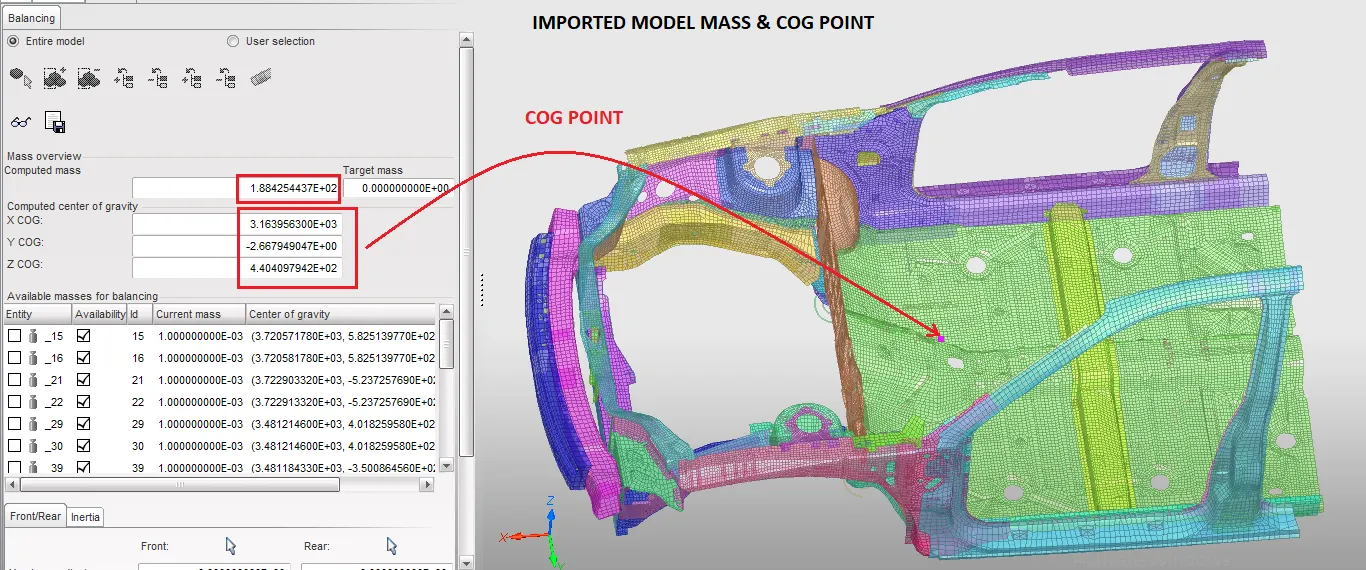
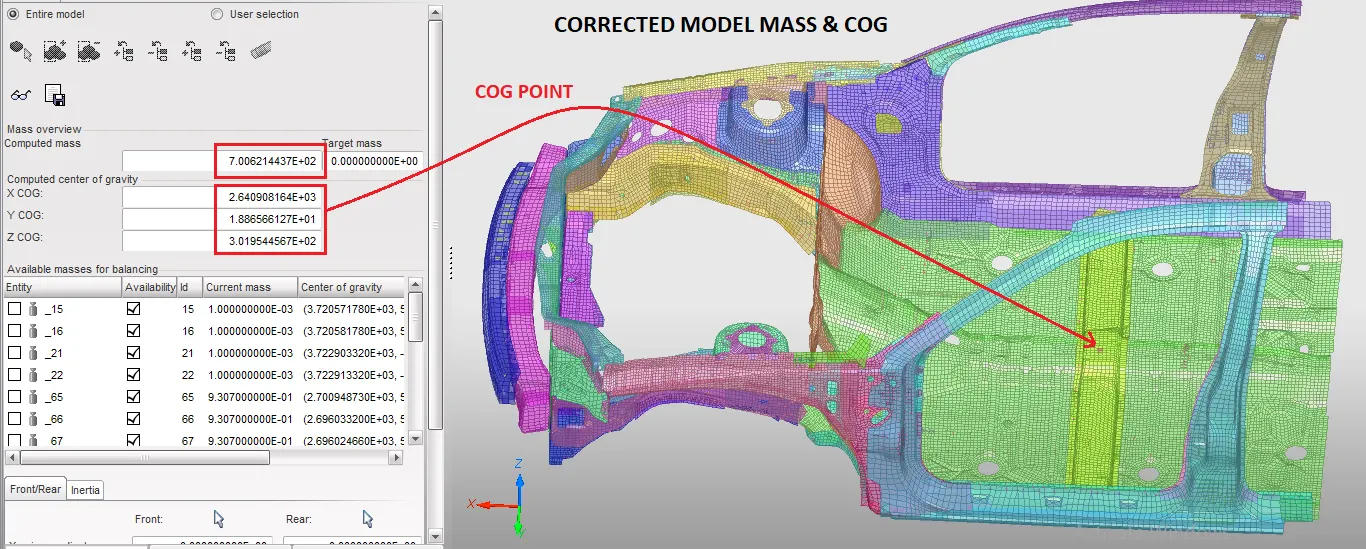
So as to make the mass near to the 700kg we need to add mass so we added the 300kg to the full car base and rest 212 kg to the small section of node so as to mode the COG point over near to the rocker cross beam. As shown in the figure below.
6) Initial velocity 35 mph.
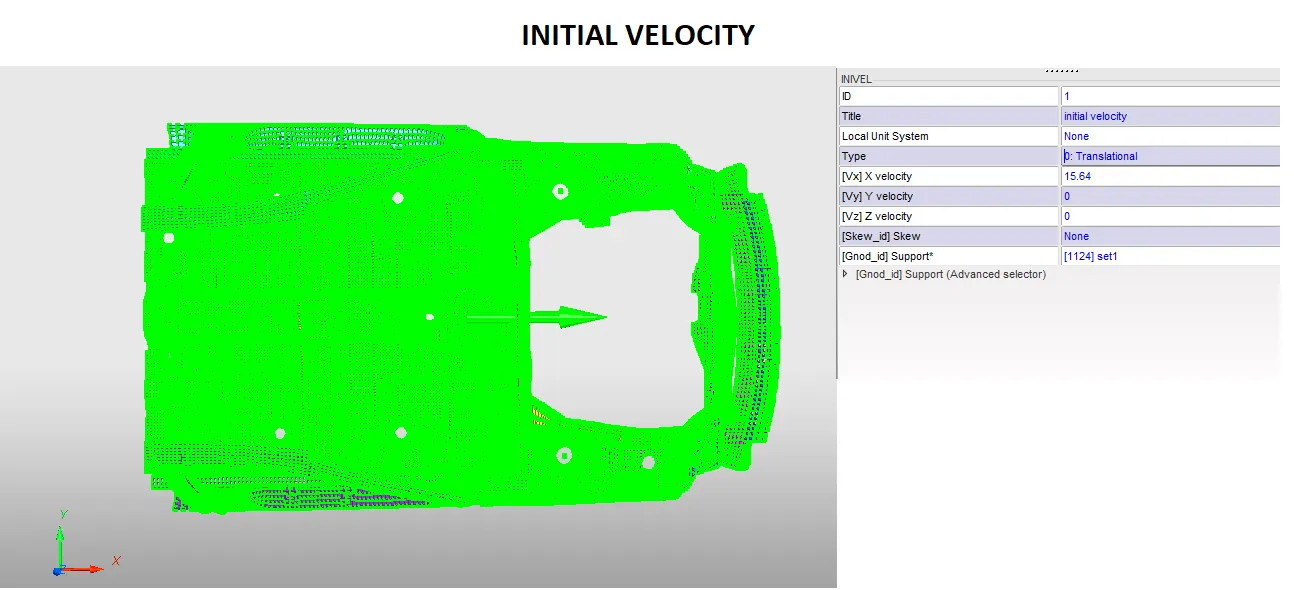
we need to provide the initial velocity of 35 mph which equal to 15.64 mm/ms to the full vehicle body and in positive x direction towards the wall.
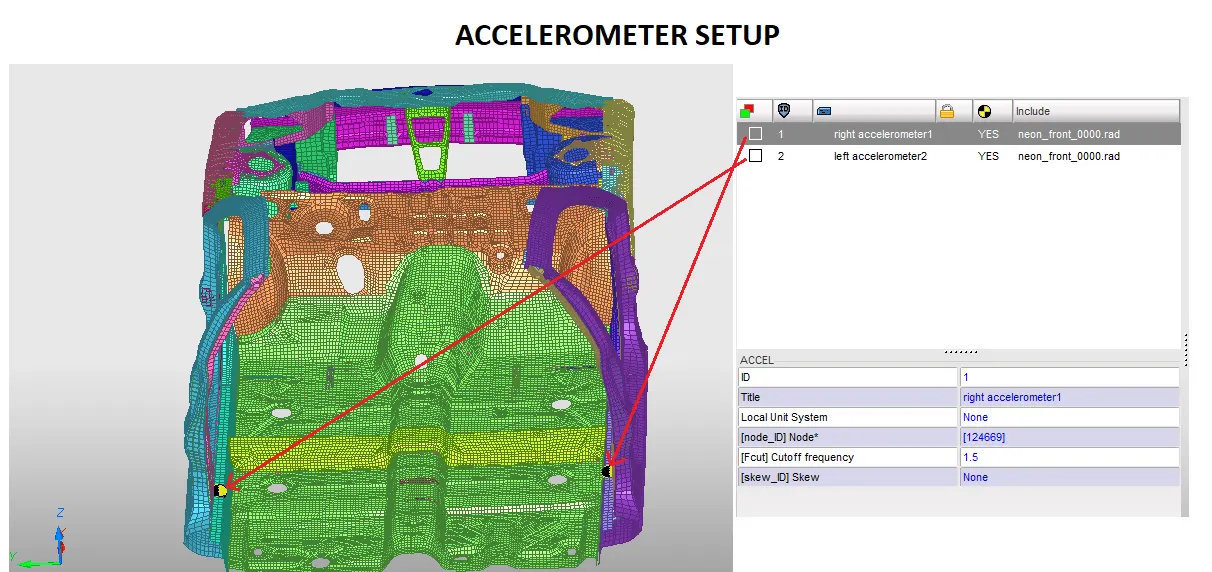
7) Fixing the Accelometer at the base of the B-pillar
To know the acceleration of the nodes under the B-pillar we will provide an accelerometer. (as shown in the below figure)
8) Cross-section step for getting sectional forces.
To know the sectional force over the areas such as rails, shotgun, A-pillar we need to give section over the elements as shown below. The sections are provide using a moving frame.
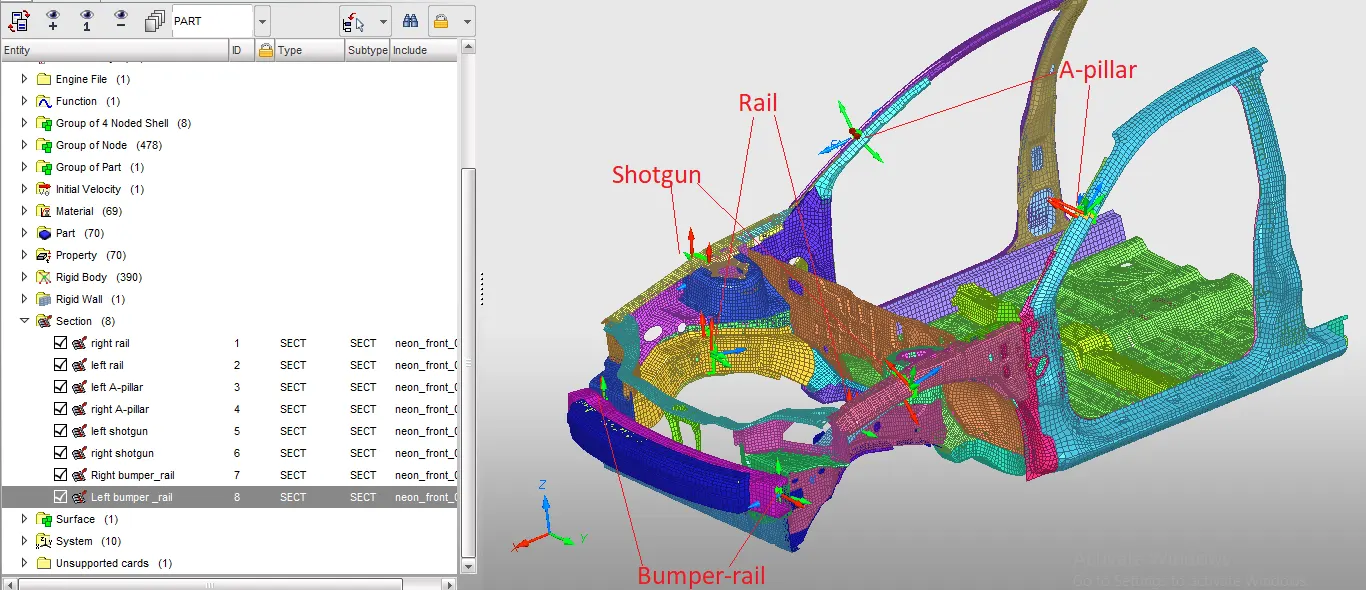
9) Setup the output request and check the necessary card status eg. ANIM/DT, ENGINE_RUN, etc.
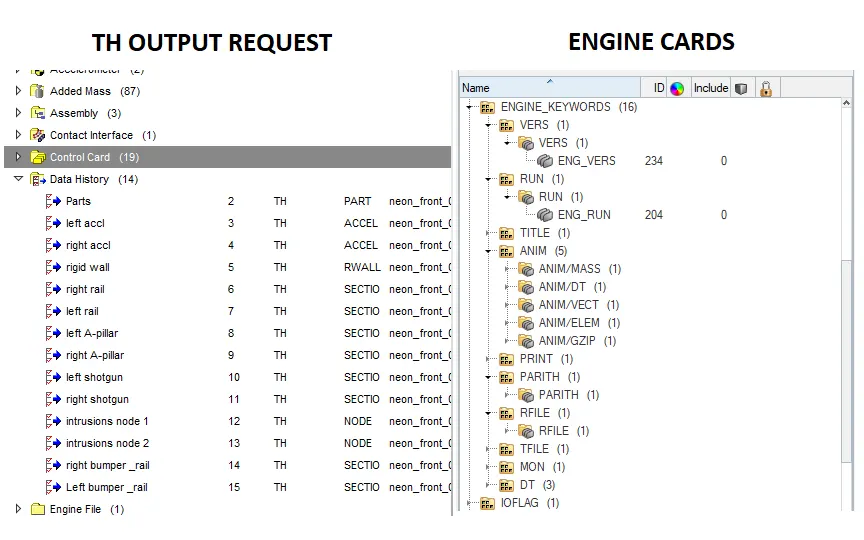
Once we are done providing the setup request we have to request the TH output. such as accelerometer, sections, rigidwall, etc. After we are done with TH output we need to provide engine cards for animation and contour capturing eg. ANIM/DT,ANIM/VECT, ENG_RUN ETC.
10) Run the model checker and debug the errors and warnings.
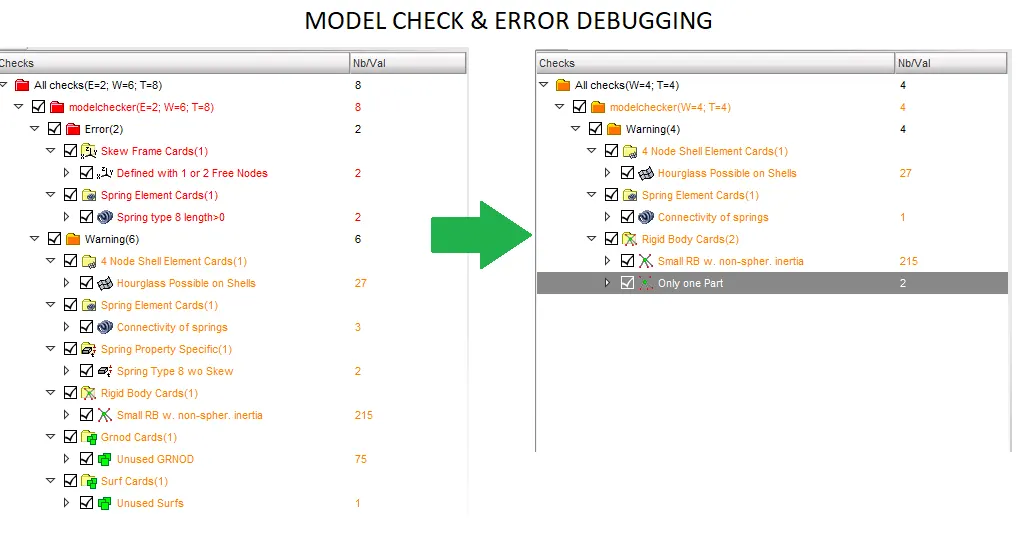
Finally before generating the radioss simulation and file we need to do the final check i.e model check. On running the model check we see the it shown few errors and warnings so we need to check and fix them . Finally we got the debugging correct and manage to fix all errors.
RESULTS & COMPARISION:
Post processing
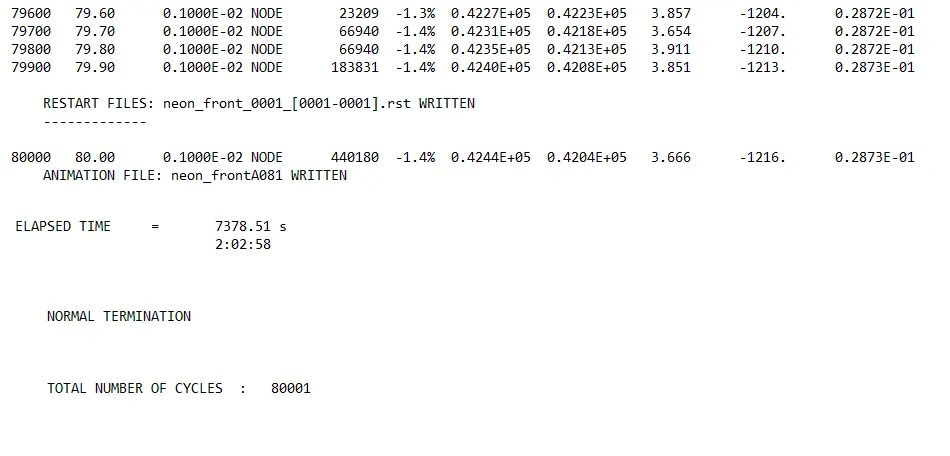
On opening the _0001.out file we can see the energy error to be -1.4% and mass error to be 0.02873 which is acceptable and can considered as good model with total no. of cycle as 80001 with time duration of 2:02:58 or 7378.51 sec.
Animation files
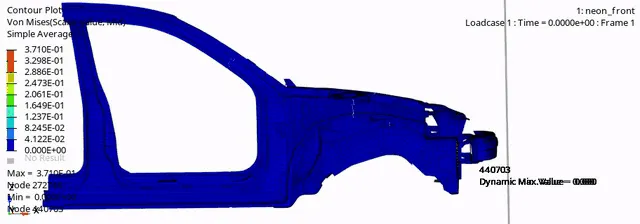
1) Von-Mises stress side view
The Von-mises stress generated with max value of 0.37 Gpa at node 272746 . Also see the flow of stress through the car body when it crashes with the rigid wall, most of the impact is channelized from the bumper to the car floor panel and and rest through the A-pillar.
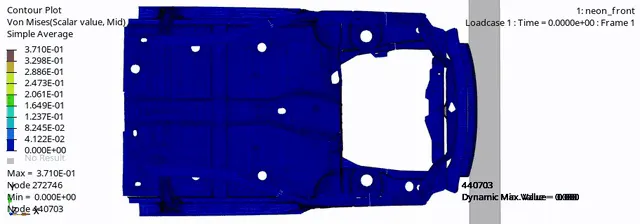
2) Von-Mises stress top view
From the top view we can see that the energy flow pattern form the bumper to crash tube then subframe and finally to the car floor panel.
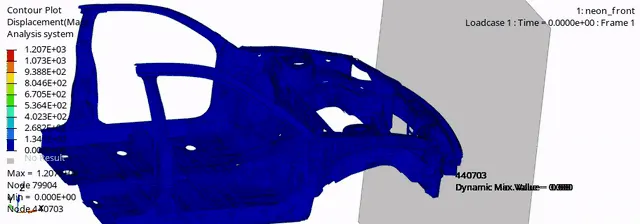
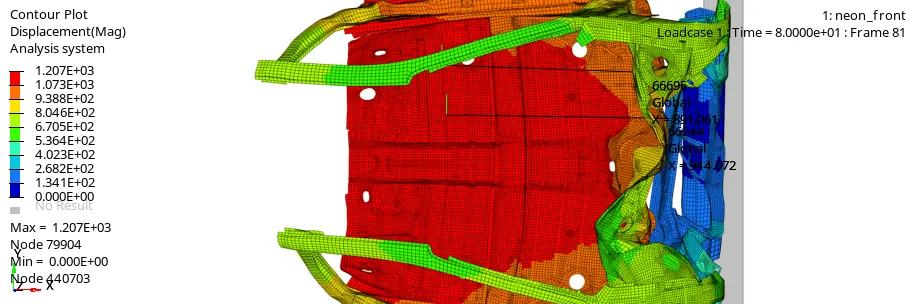
3) Dispacement contour plot
The maximum dispalcement achieved is the 1207 at node 79904
PLOTS
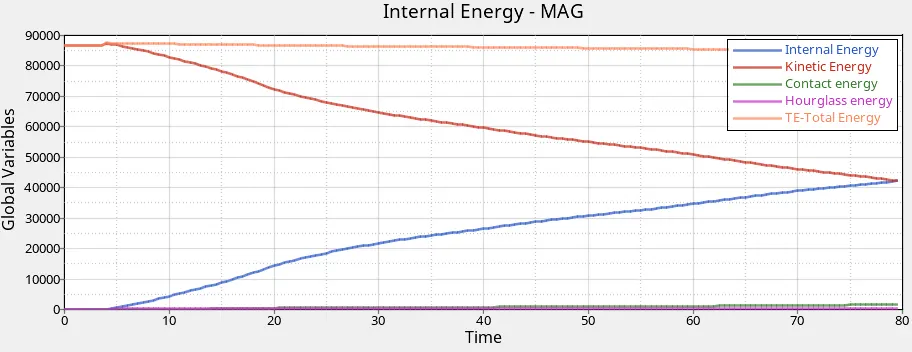
1) ENERGY PLOT
As we can see the kinetic energy at the start of the simulation is at 85KJ and reduces gradually with the impact into the rigid wall(velocity reduced). The Internal energy start at 0 and increases to a value of 42KJ at the end of simulation due to the deformation and conversion of K.E to I.E. The value of hourglass energy is zero throughout the simulation due to the use of recommended shell properties. and constant energy is in significant.
2)RIGID WALL FORCES
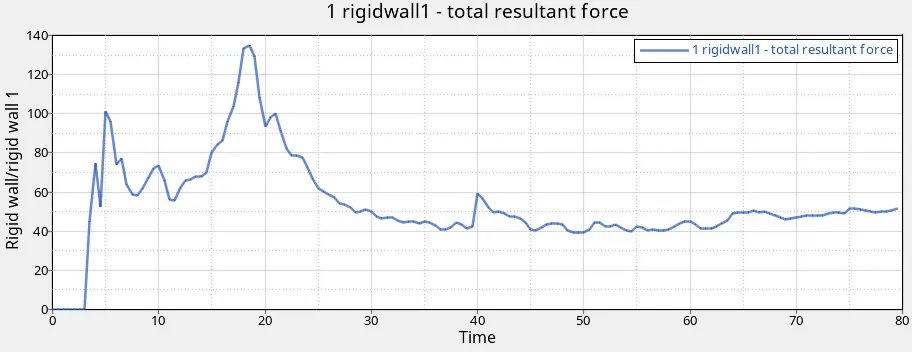
As we can see the plot below shows the total resultant force variation w.r.t simulation time. As it can be seen in the starting the wall force generated is zero till 4 ms of simulation because of no contact but at the 5 ms there is peak rise in the wall forces to a value of 100KN and then at 17 ms the value reaches to its max of nearly 130 KN when car frontal area smashes on to the wall the max. Then from 25 ms to 80 ms the value remains almost constant off 40 KN.
3) A-pillar section Forces
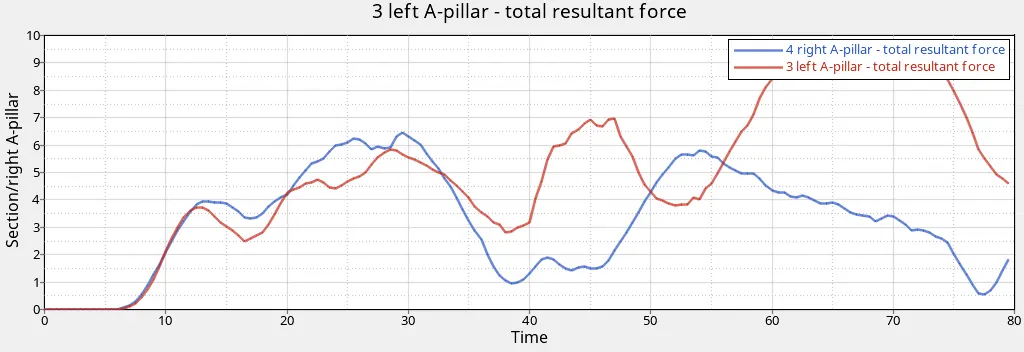
This can be seen that initial value of resultant forces are zero for both left and right A-pillar as there is no impact at that point. Then later the left pillar sectional forces are much higher than right A-pillar. Max. value for left pillar is 9.5KN where as for right A-pillar is 6 KN. So we can say that left pillar will be subjected to more force with the current COG point location and it should be reconsider for the failure analysis
4)Shotgun Sectional Forces
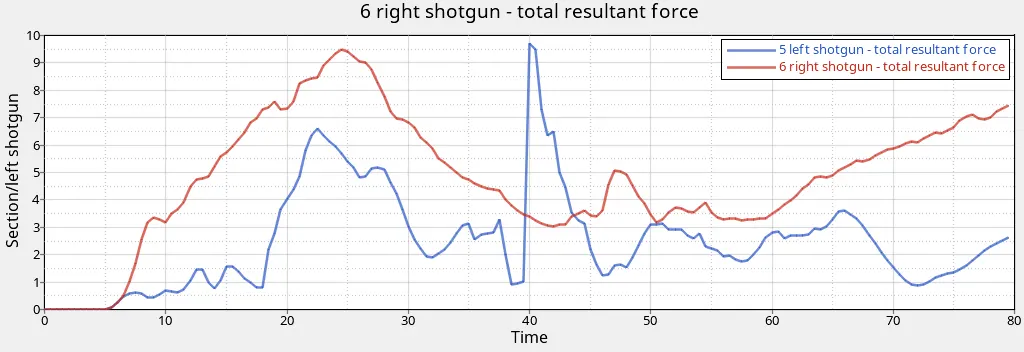
The sectional resultant force for the shotgun the right shotgun subjected to more force (max:9.5KN) than left in thorough out the simulation but there is peak rise in the force at 40 ms to a value from 1KN to 9.5KN in the left shotgun and this has to be taken into consideration for criticle failure analysis.
5) Accelerometer Acceleration Values
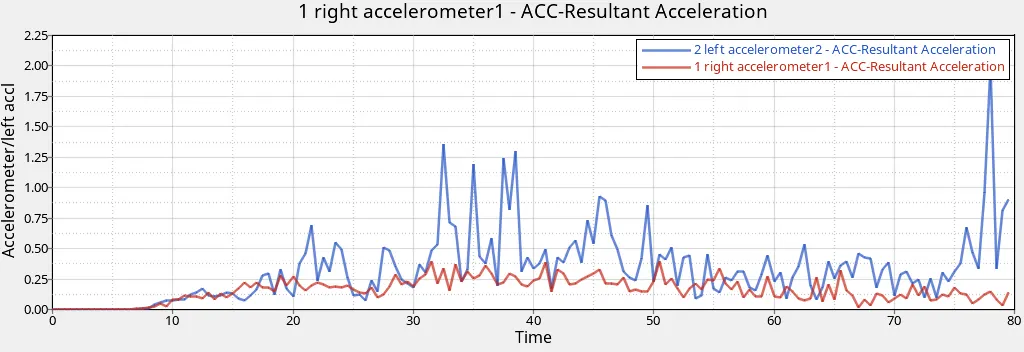
As it can be seen that left accelerometer shows a much variation in the values than right with the peak value of 2 mm/ms^2
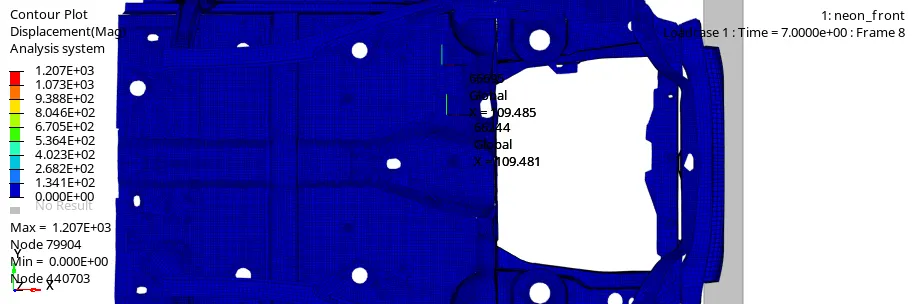
6) Displacement of node to calculate intrusions at point 66695 and 66244
The intrusion can be measured by the relative displacement of the nodes just before the bumper touches the rigid wall to the final end of the simulation.Therefore we get that:
Node 66244: 944.072- 109.485= 834.587 mm
Node 66695: 891.061- 109.485= 781.57mm
The variation of intrusions is very less for both the nodes at the pedal area.
X-position just before the crash
X-position at the end of the simulation
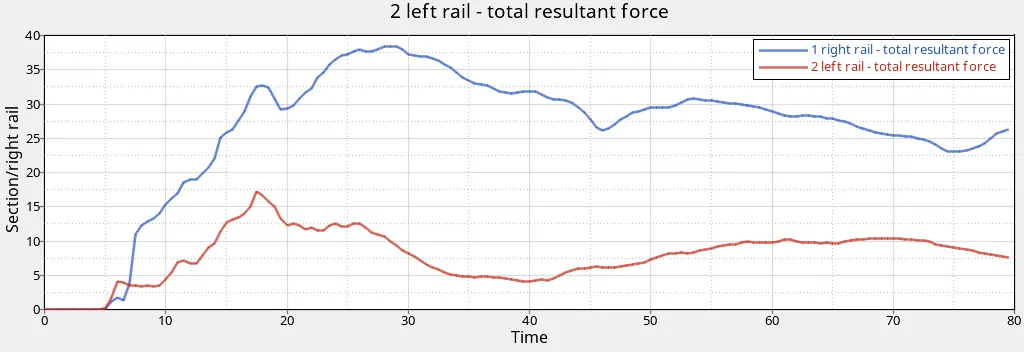
7) Axial force at the section of bumper to rail.
As it can be seen the axial force traveling from bumper to rail. The right rail experiences a very high force value max. of 38 KN at 29 ms whereas the left rail the axial forces in far less at a max. value of 14 KN at 17ms.
CONCLUSION:
After completing this project we can conclude that the maximum deformation and energy absorption are done in the bumper( crash cube region) then the shotgun and rails. The results and plots obtained are relevant to the actual condition of crash analysis. All the boundary conditions are fulfilled as required and we get satisfactory results.