Frontal Crash analysis of Neon car BIW model in Hypermesh
Objective: To perform frontal crash analysis of a car body semi-assembly and obtain outputs of forces in various sections
Model:
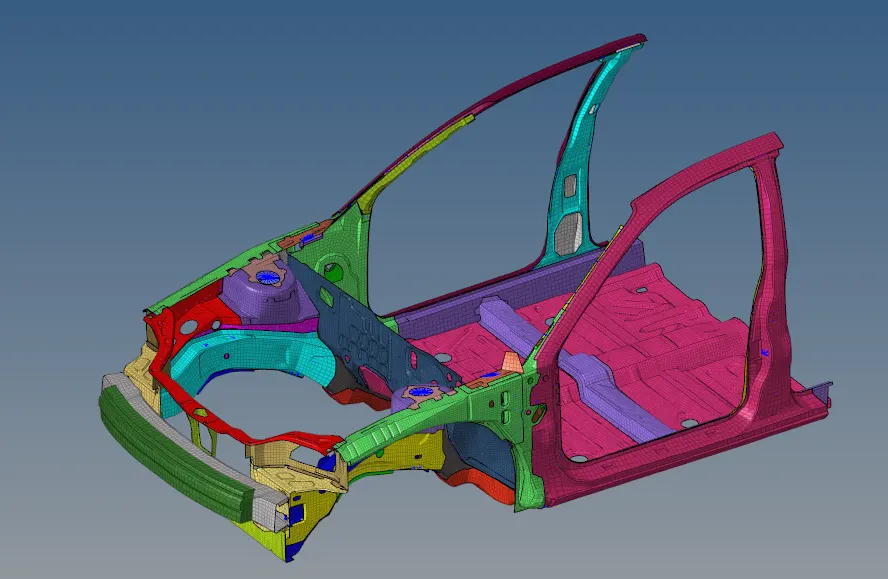
The model is a sub assembly of the front, bottom and side frames of the car. These sections have been chosen for the crash test as they give structural integrity and strength to the car in case of a crash.
Firstly, we will select a suitable unit system for the model. We choose kg mm ms as the unit system.
Then we will check the mass and compare it with the full car model to make sure we have the correct unit system with proper mass and physical properties.
We will perform mass balancing on the sub-assembly to reach a target mass of 700 kg. For this, we will create rigid bodies in various locations to add the mass
We will be applying contact interface to the various components, along with the recommended properties.
We will create an accelerometers at the base of B pillars and request the acceleration curve
We will check intrusions on the dash wall.
Procedure:
A. Preparing the model for the Simulation Run:
Before we jump into the simulation process, we have to debug the model, add mass, and create interfaces and sections, and allot the TH requests required as outputs. We proceed with the above points.
1. Import the sub-assembly model in Hypercrash in the kN kg m ms unit system.
We note the mass of the sub-assembly as 188.425 kg.
The COG location is as shown:
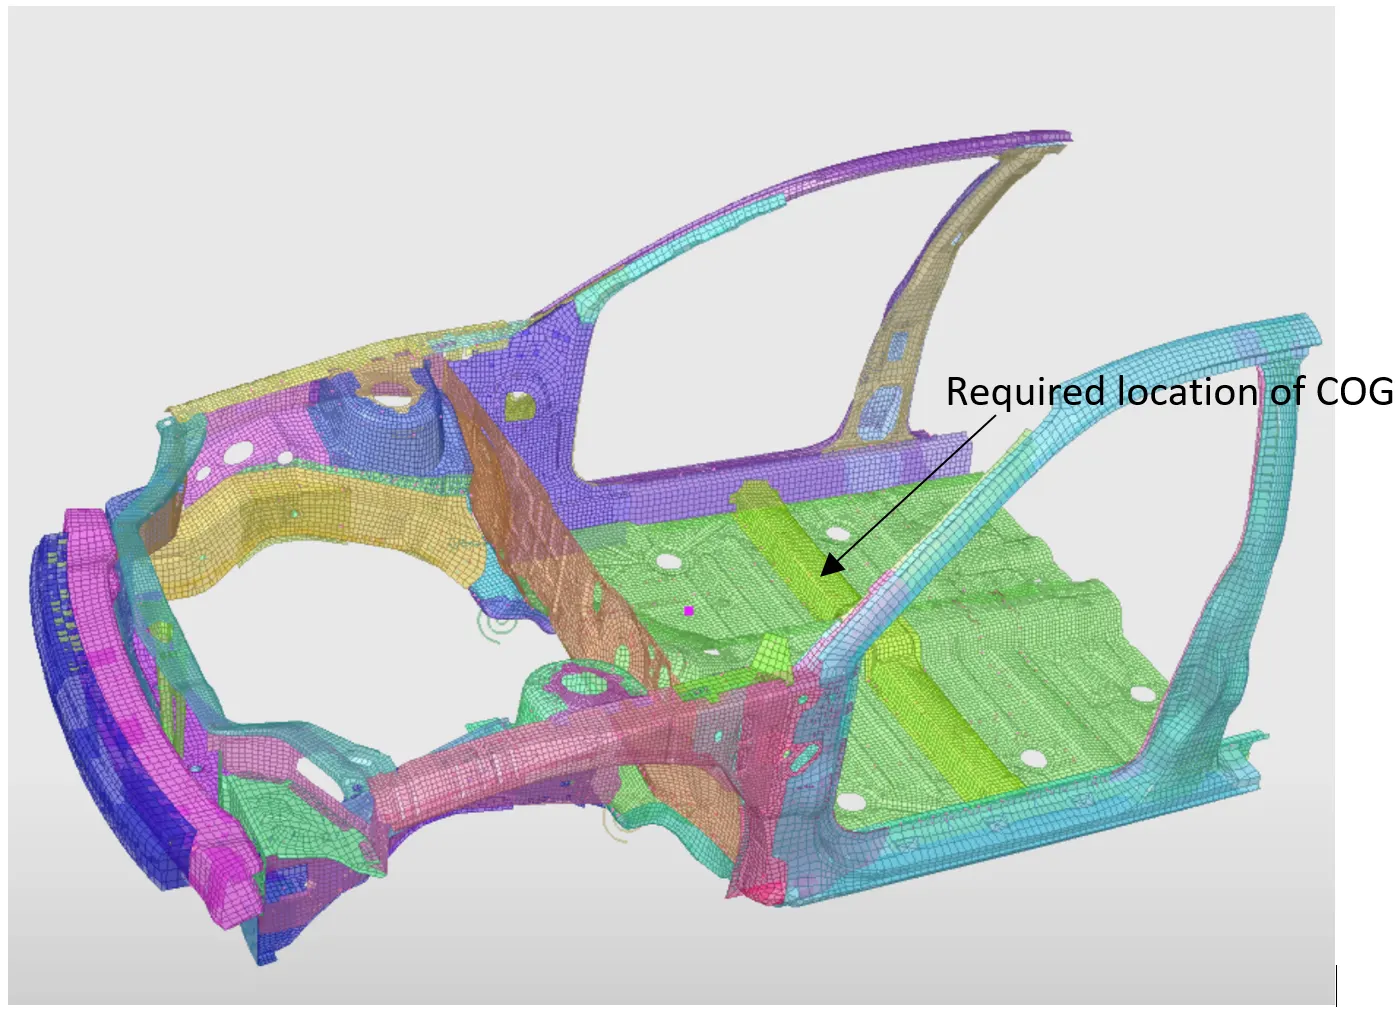
We will have to add masses to shift the COG to be under the pillar shown above.
We check the mass of the complete model to be 1216.55 kg.
We add mass at the driver seats and the floor panels to shift the CG to approximately under the link shown above.
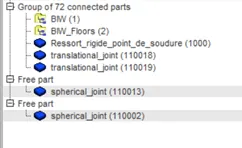
3. We check connectivity of parts and note that there are two non-connected spring elements which we can delete:
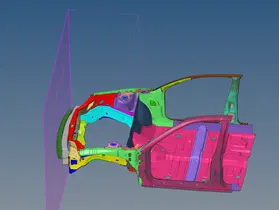
4. After that we create a rigid wall as shown:
5. The model comes with pre-defined interfaces between parts. These are necessary for simulating the sub-assembly behaviour in better detail.
Since we do not have the sub-assembly, we have no need of individual interfaces for different parts. We can just create a single interface. Therefore, we delete the existing interfaces and create a new Type 7 interface with properties as shown:
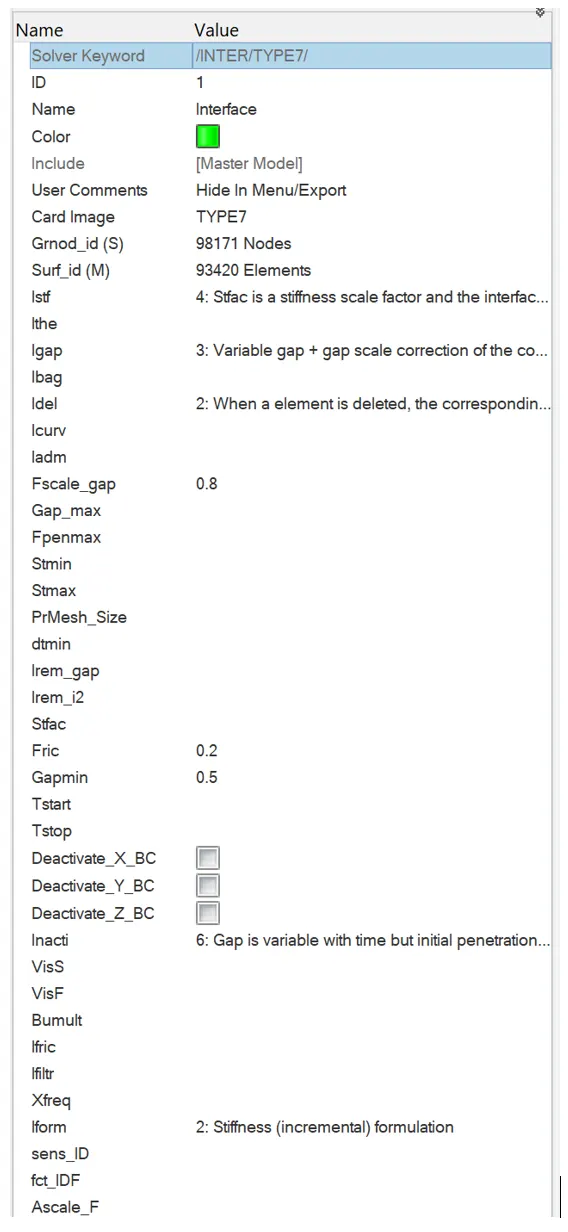
We choose Type 7 interface since it’s the best compromise between accuracy and simulation speed.
6. Next we impart initial velocity of 35mph or 15.64 mm/ms to the model in the direction of the rigid wall.
7. We create an acceleration sensor at the base of B-pillar as shows and create a TH request for the same:
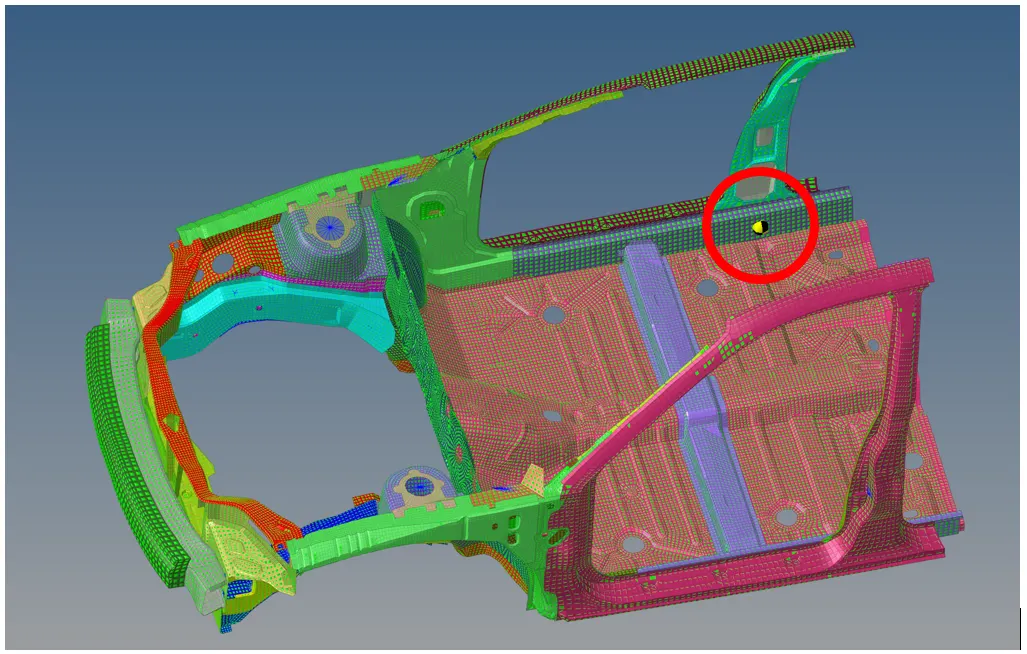
Similarly, we create an accelerometer on the opposite B-pillar.
7. Now we check penetrations in the interface defined in step 5.
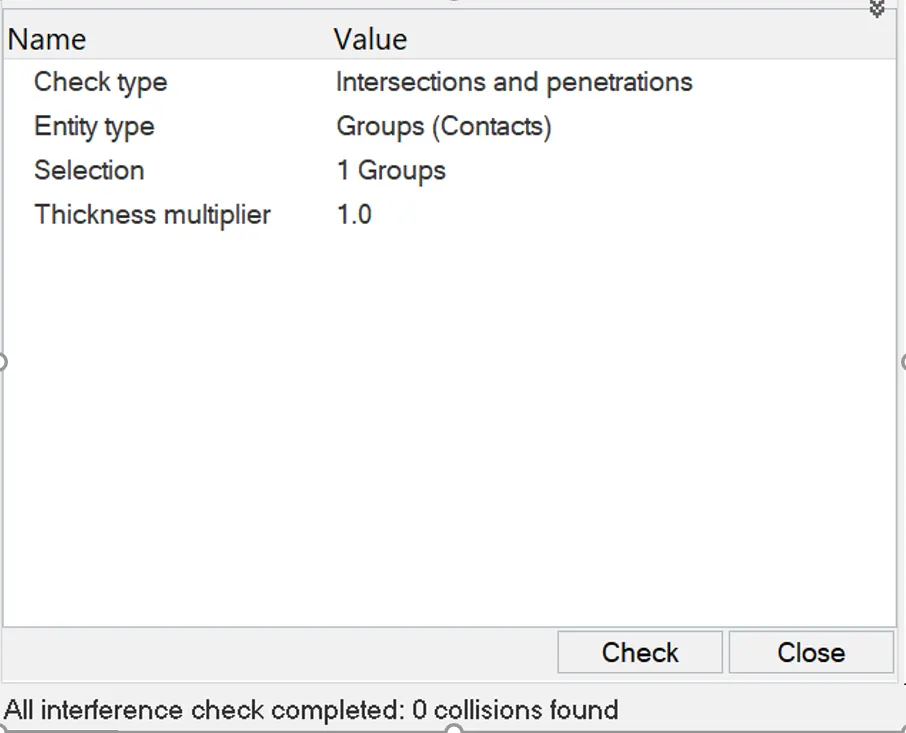
This implies there is no initial penetration in the model, so we do not need to do any geometry correction.
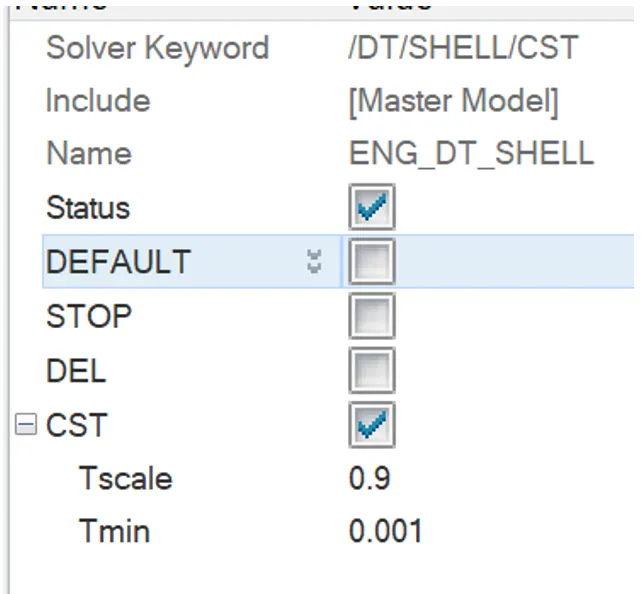
8. We create /DT/SHELL card to control the time step. We will be using the CST option, which tries to adjust the time step to the minimum value by adding mass to increase the density of the controlling element.
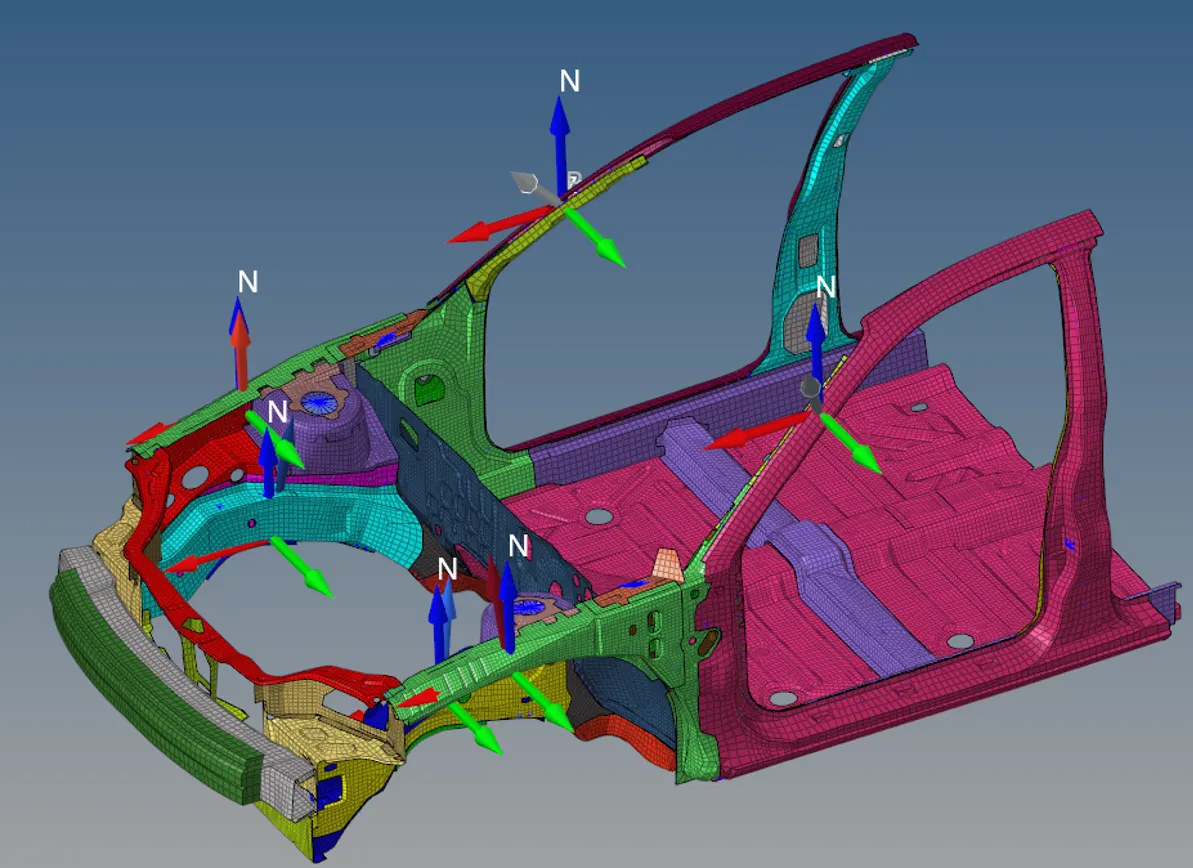
9. We will create sections using moving frames, as shown below:
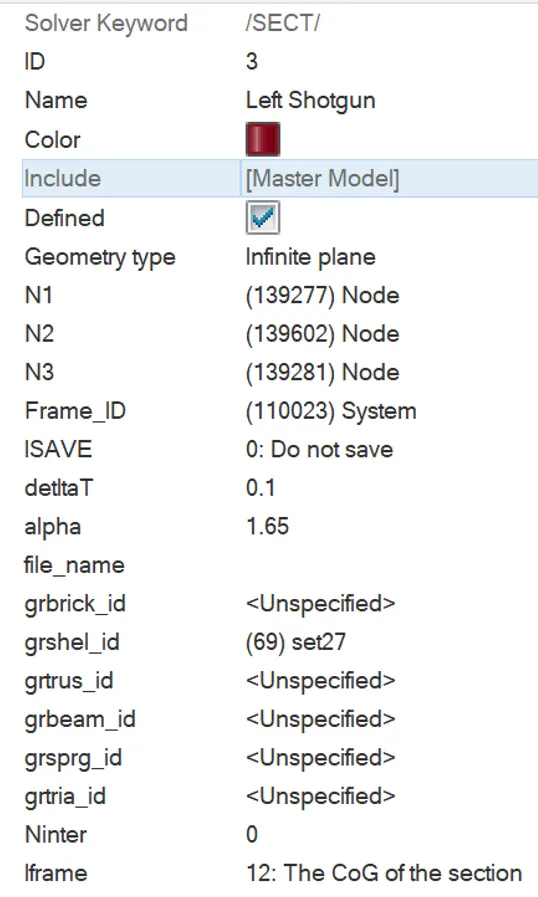
The sections are created at following different locations:
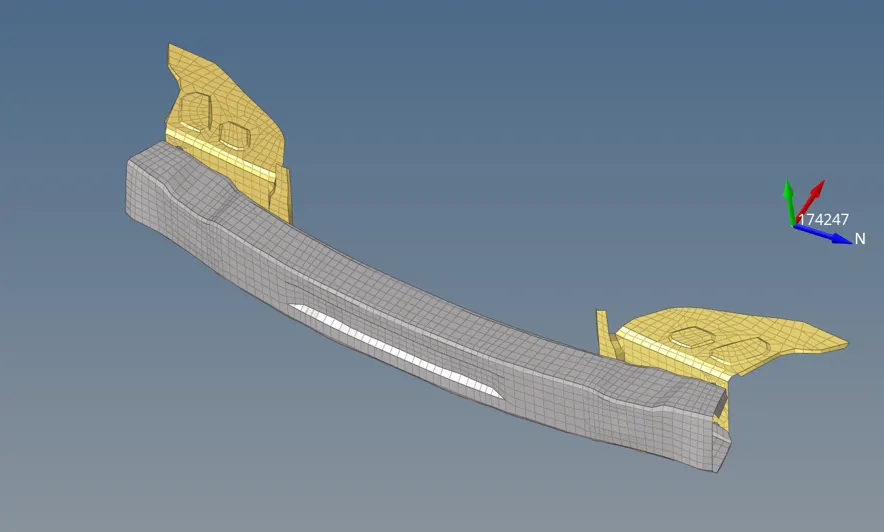
We need to find the axial forces transmitted to the rails by the bumper.
For this we can create an interface between them and request TH for the same
TH of all the required sections and interfaces and nodes are created:
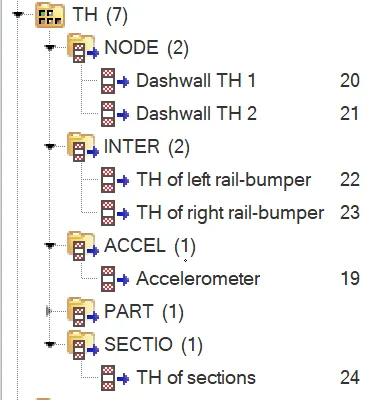
Creating a TH request will allow us to plot graphs of the respective entities regarding force, position, stresses etc.
13. To check intrusions on the dash wall, we will create two springs of very low mass and stiffness between two pairs of nodes
The properties of the spring are as shown:
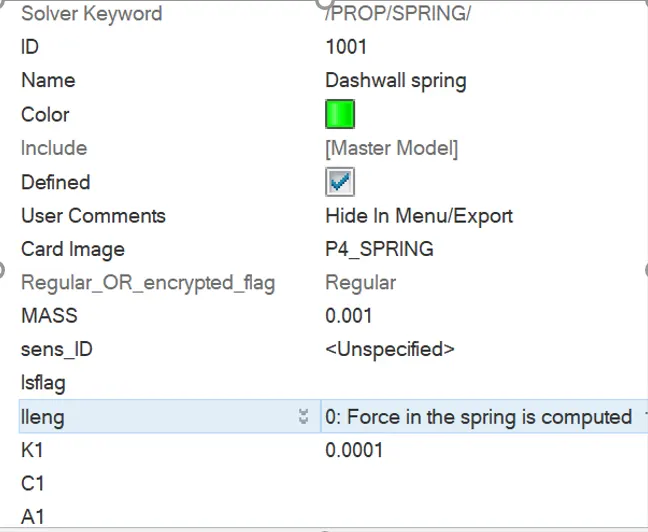
To record the intrusions we create TH/Node for the two nodes where the two springs are defined. The spring deformation will give an idea about intrusions in the dash wall.
14. Now we run the model checker by going to Tools-Model checker-RadiossBlk
We check and correct the errors shown and then proceed with the simulation
B. Simulation run and diagnosis
1. After we have prepared the model and fixed penetrations and errors, we can run the simulation. While running the simulation we keep track of the energy error and Mass errors. There should not be any sudden change in either of them, which would indicate some abnormality in the simulation.
2. After the simulation is run, we check the engine output file.
Energy error is -1.9% at the end of the simulation
Mass error is 0.125% at the end of the simulation.

Both are within acceptable tolerances and hence we can proceed with the further checks.
3. Now we open the h3d file and check the deformation
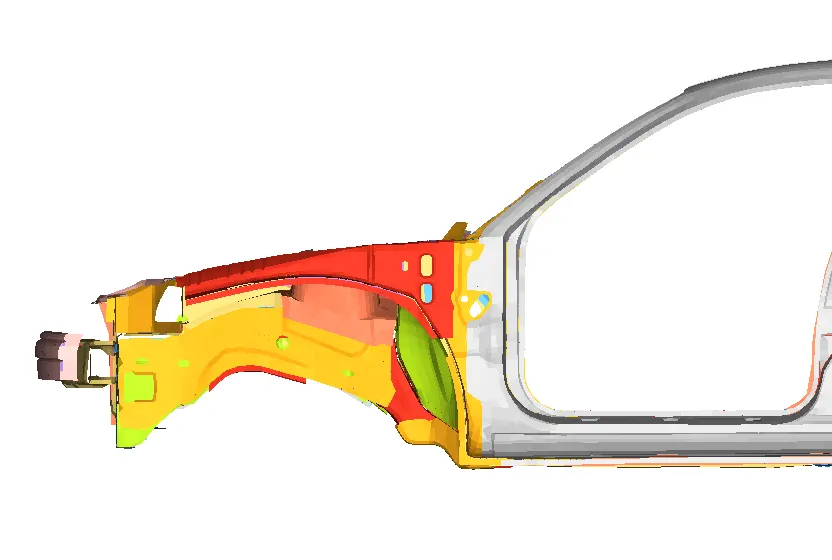
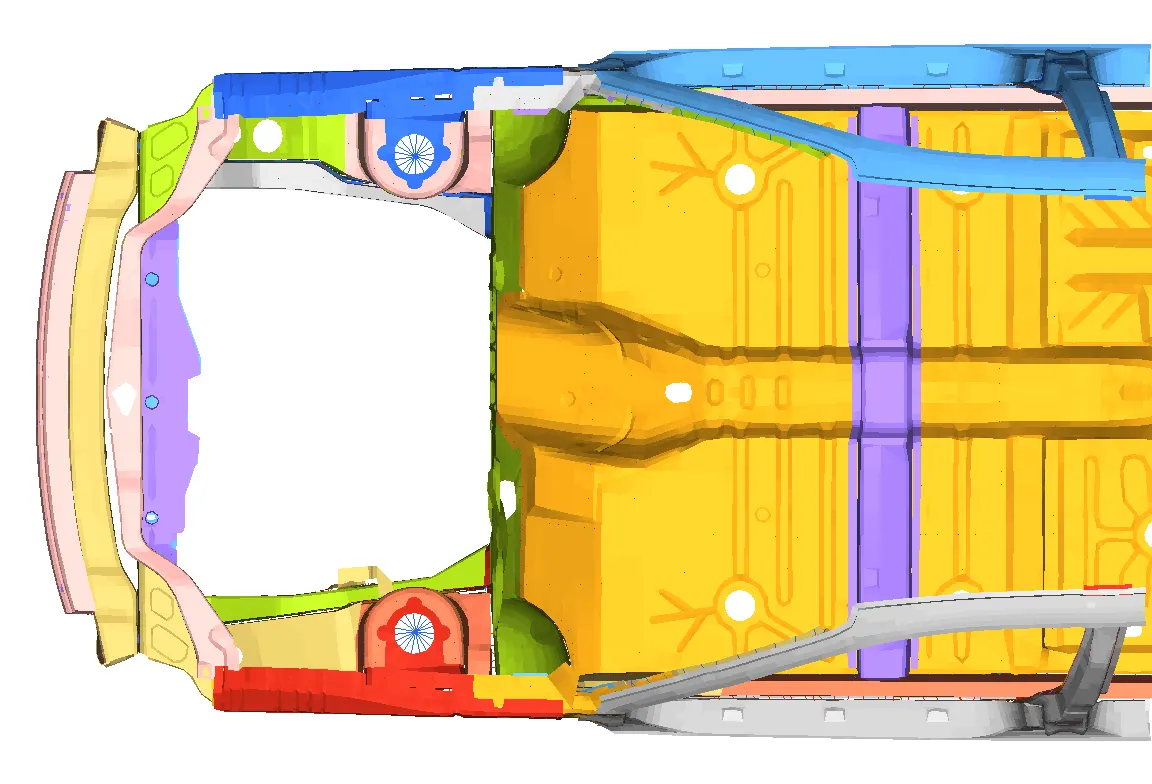
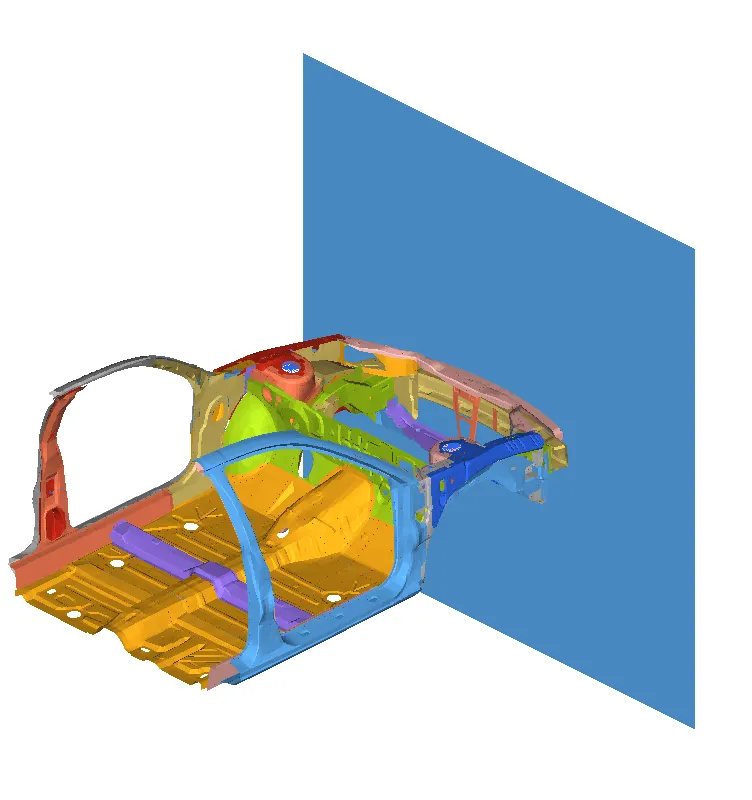
We observe that the deformation is not unnatural, and resembles what we would expect in a real world scenario.
C. Simulation results
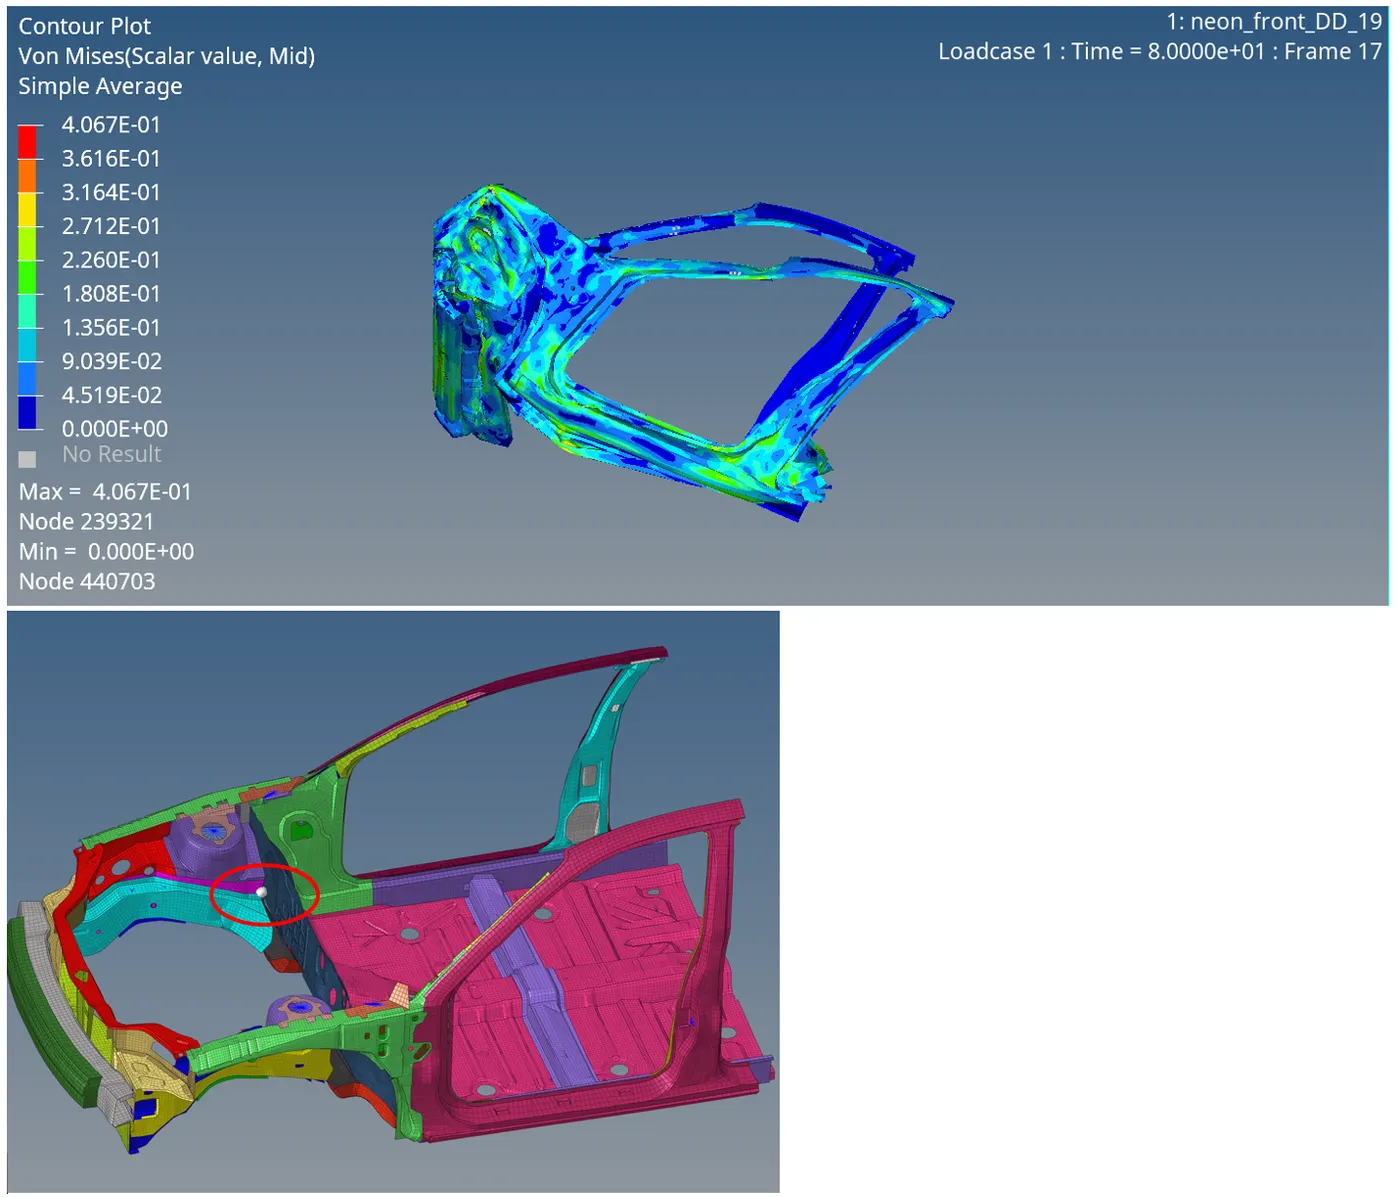
1. Von Mises stress plot:
The max value of Von Mises stress is 0.4067 KN/mm2, which is the point behind the fender as shown:
This is due to the way the model is deforming, with the above region getting crushed between the fender and the dash wall, as is evident from the animation.
2. Energy Plot:
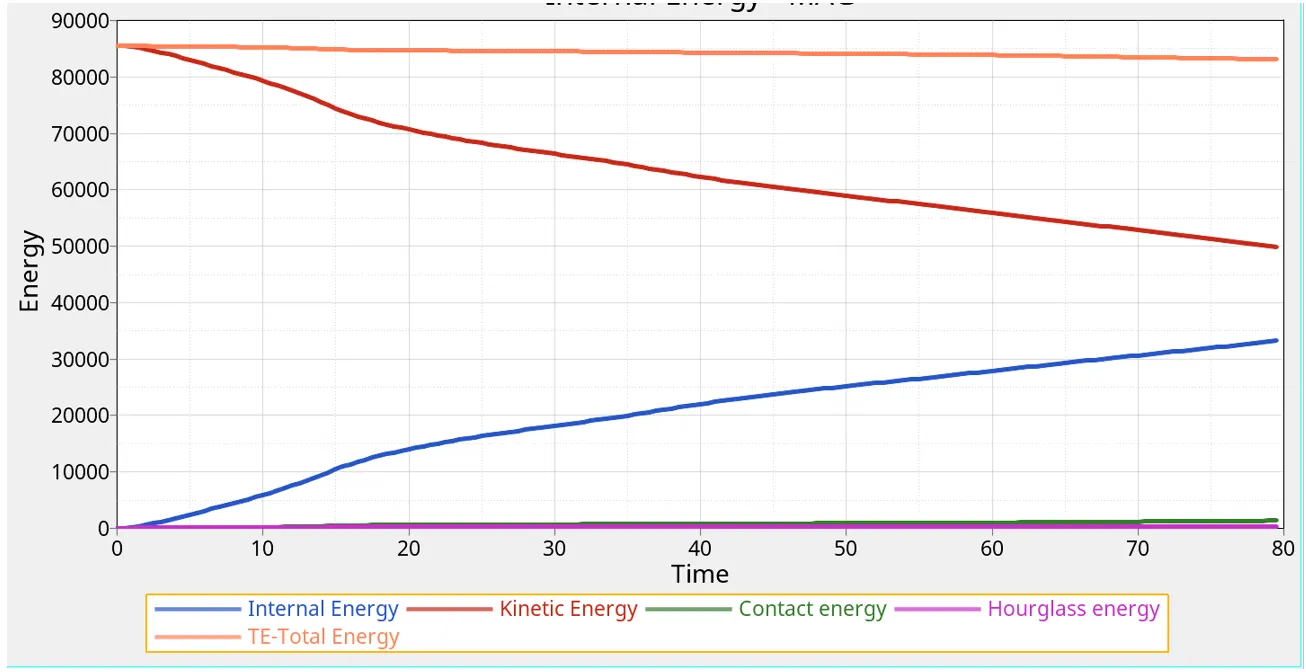
We observe following points from the above plot:
Total Energy of the simulation at the end is decreased, which corresponds to the negative Energy Error at the end of the simulation
KE is decreasing, which is expected as the car slows down following the crash
IE is increasing as the rigid wall deforms the car, essentially performing external work on it.
Hourglass energy and contact energy are very small compared to the total energy
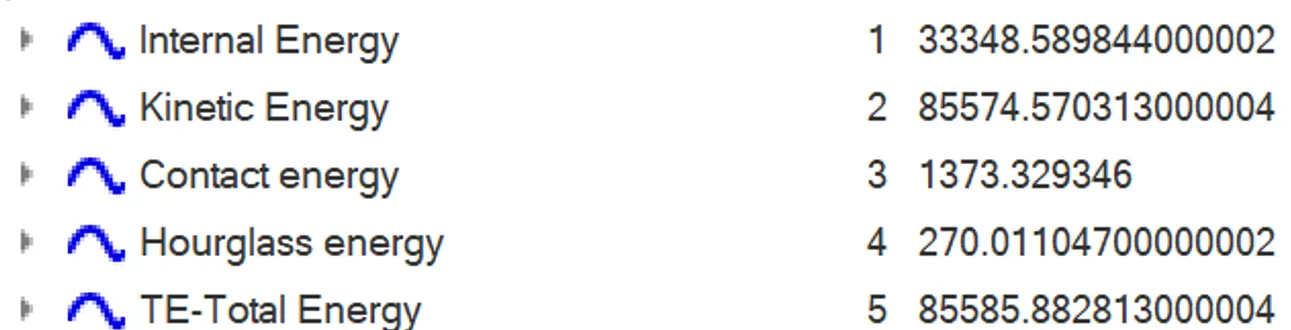
The max values of the Energies are
3. Sectional force in rails:
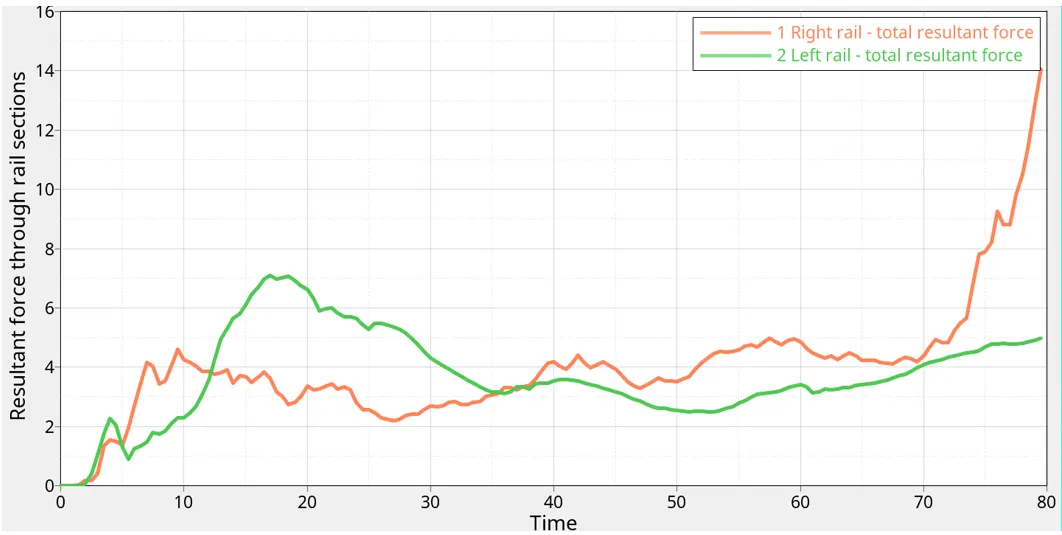
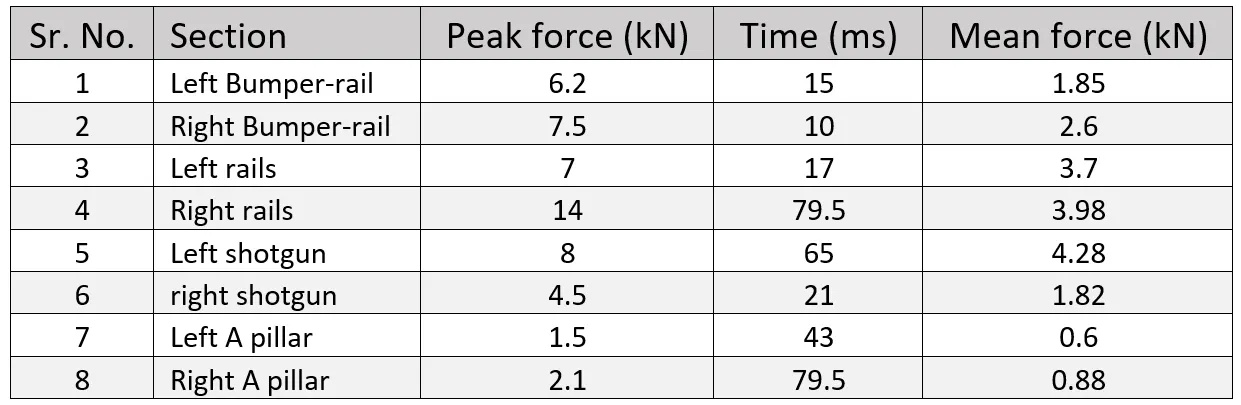
We can see that the Right rail force peaks at about 14 kN, while the left rail peaks at about 7 kN.
Note that these values are specific for the chosen section region, and will vary depending on where we choose to take a section.
We can conclude from the data that foe these particular sections, the Right rail is offering more resistance than the left rail, which is why the force through it is more.
4. Sectional force transmitted to bumper by rails:
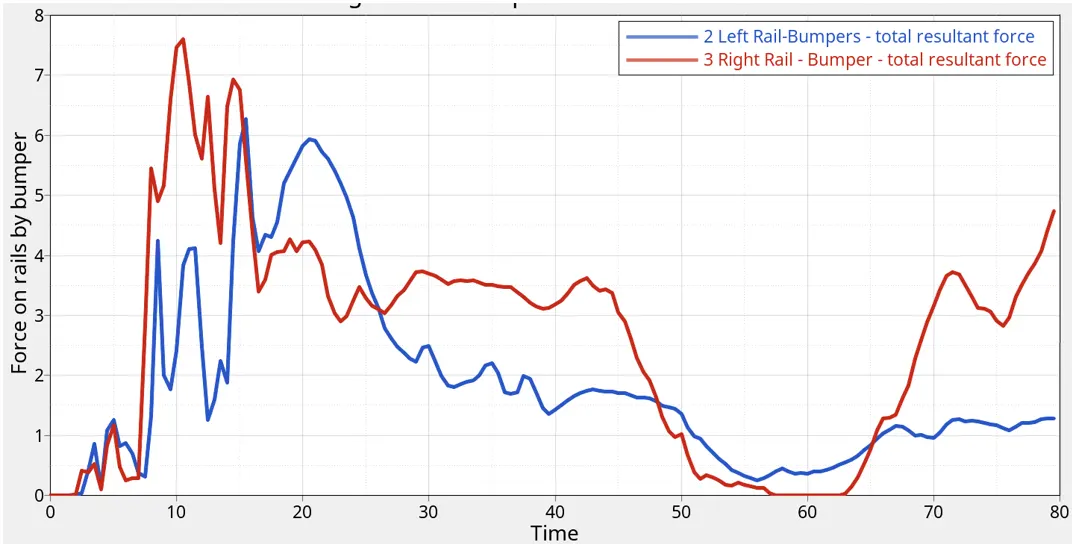
The values and peaks are quite similar, as the bumper-rail is quite a symmetric pair for both left and right sides.
The Right side peaks at 7.5kN while the left side peaks at 6.2 kN
5. Sectional force through Shotgun:
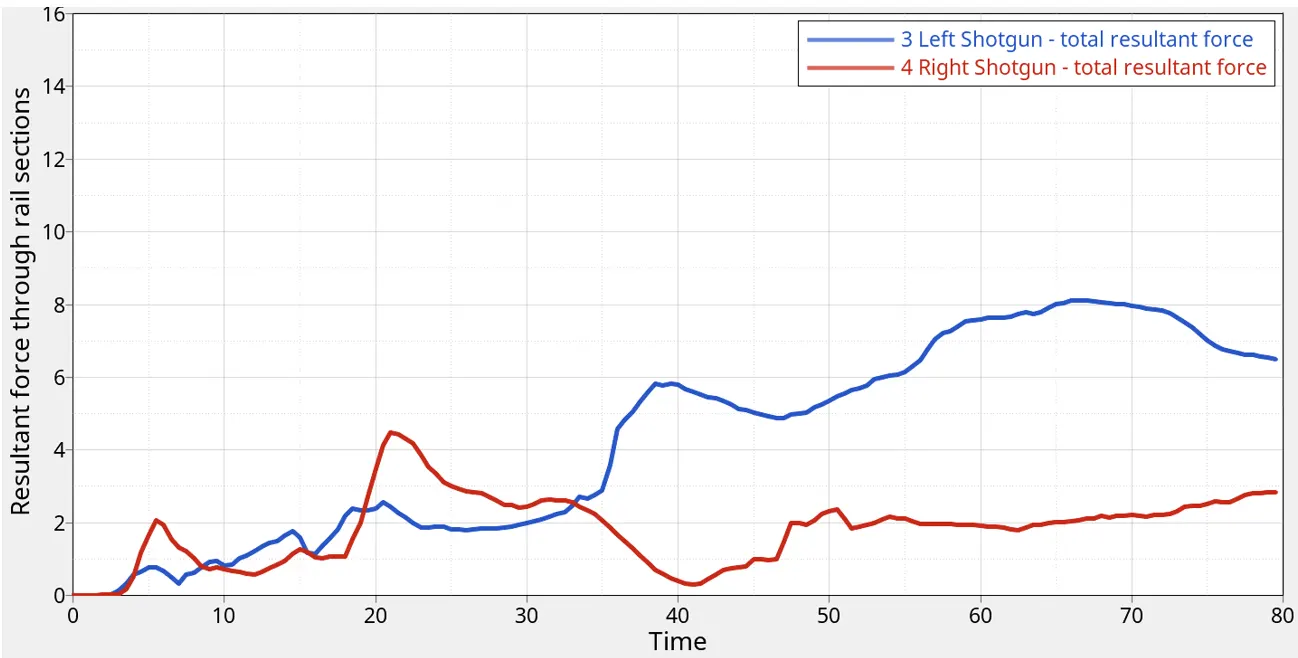
We note that the Left shotgun offers significantly more resistance than its right counterpart. The Left section peaks at 8kN while the right peaks at 4.5kN
6. Sectional force through A pillars:
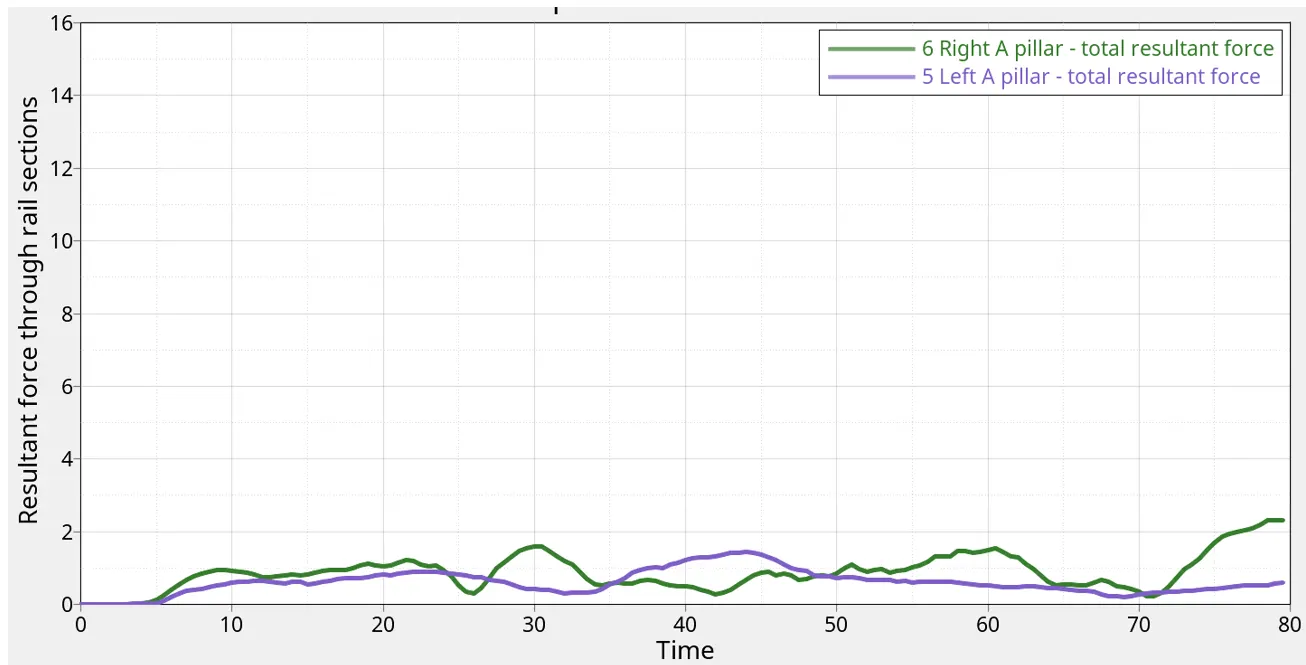
The forces in A pillars are much lower compared to previous sections.
The Right section peaks at 2.1 kN while the left peaks at 1.5kN
Note that as we move further towards the back of the car, the sectional forces are decreasing and the time at which forces start to develop also shifts rightwards.
This is because a large part of the forces is borne by the front sections, especially the rails and bumpers.
The forces take time to be transferred to the back sections as they are being spent in deforming the front sections.
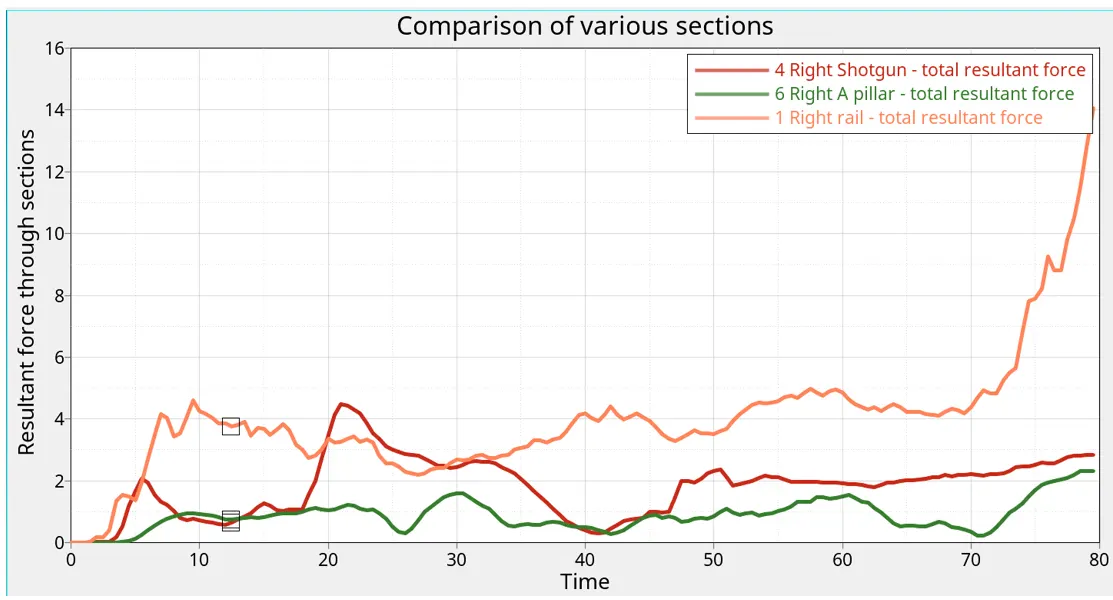
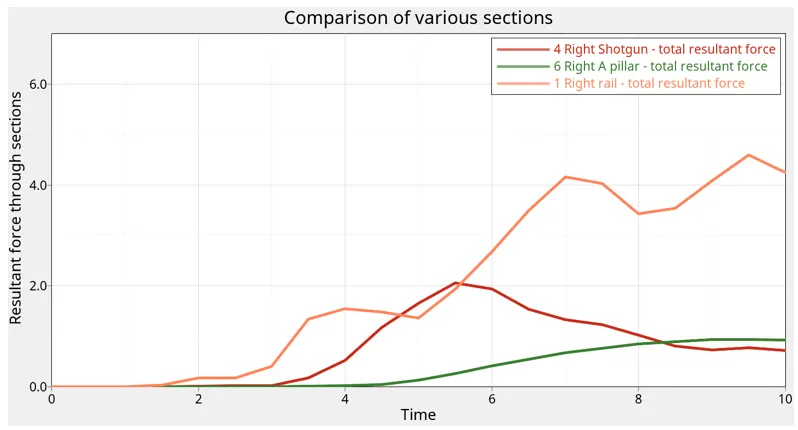
From above graph reading for 10 ms, we can see that the forces develop in the rail at about 1.75ms, in the shotgun at 3ms and in the A pillar at 4ms
From length and speed of shockwave in steel calculations we can approximate that the shockwave travel takes about 0.35ms upto the A pillar
Thus, the front section of the BIW has sustained the crash forces for about 3.7 ms till they reach the center of the car.
7. Acceleration curves:
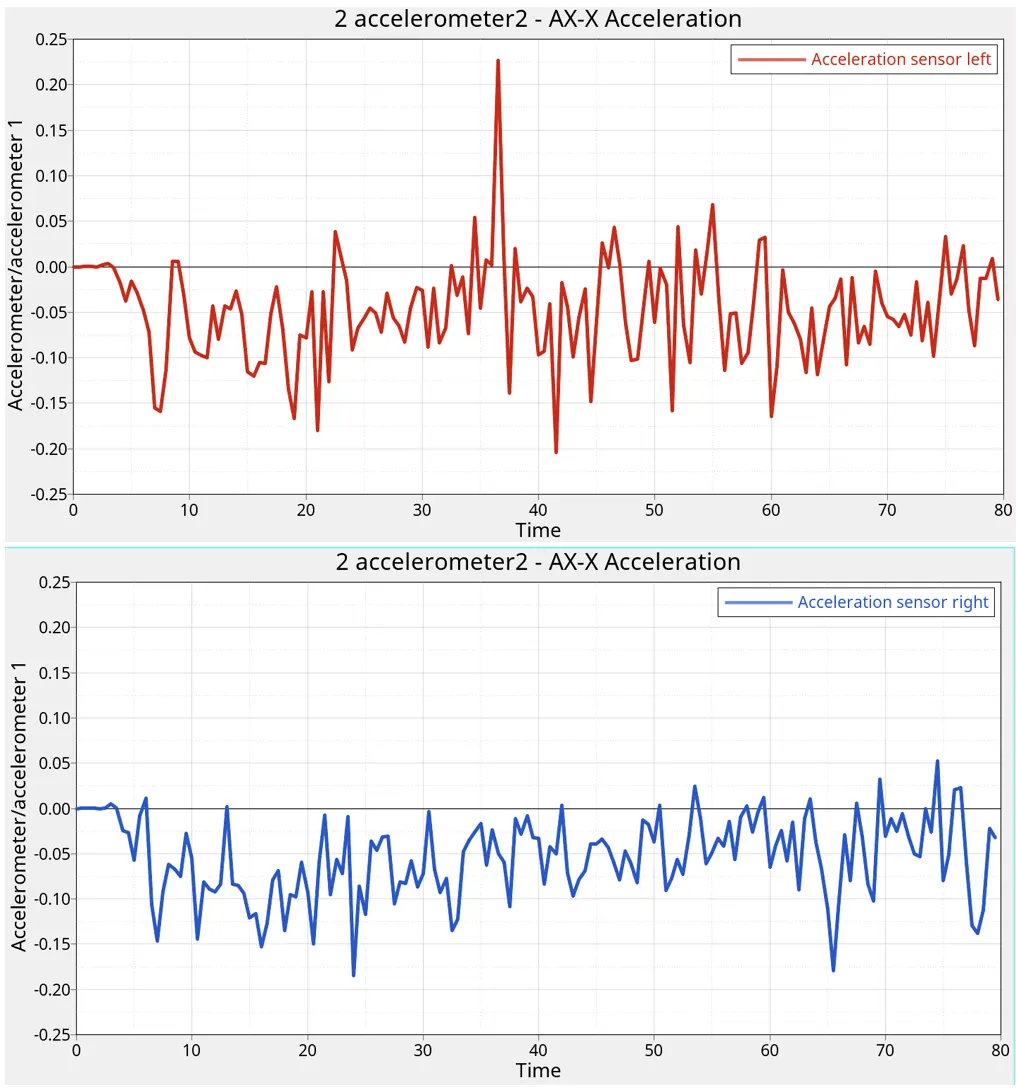
The two sensors record similar decelerations in the X direction, except for a 0.2 mm/ms2 acceleration spike for the left sensor. From some simple maths using the graphs, we can find out the average deceleration measured at each sensor:
Left – 0.0478 mm/ms2
Right – 0.0538 mm/ms2
8. Intrusions on the dashwall:
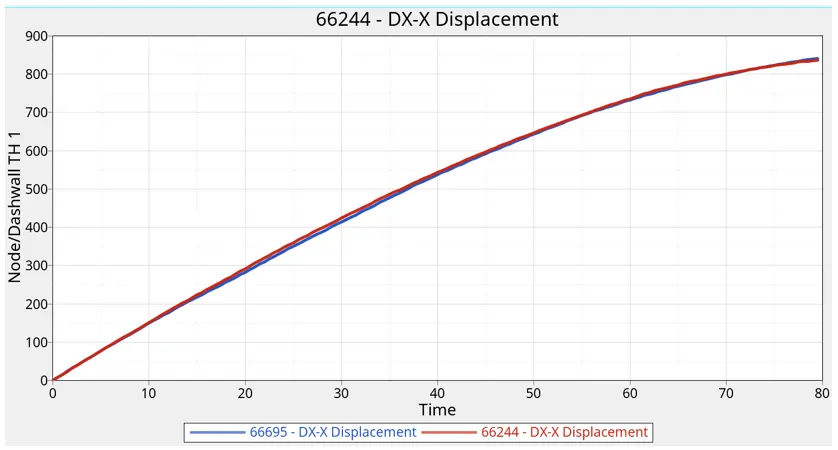
The displacement characteristics of the two nodes are similar, with a max displacement of 841 mm by the end of the simulation.
D. Conclusion:
We have conducted the simulation for the frontal crash of the BIW of Neon car.
The resulting energy curves and TH request studies conclude the following points:
1. Total energy decreases a little by the end of the simulation due to minor losses.
2. Max Von-Mises stress is recorded in the region behind the right fender as it is getting crushed between two stiff regions (fender and dashwall)
3. Peak sectional forces:
4. Mean deceleration recorded by the sensors:
Left – 0.0478 m/ms2, Right – 0.0538mm/ms2
5. Dash wall intrudes about 841 mm during the run
6. The crash is sustained by the frontal regions for approximately 0.35ms before it is transferred onto the middle region of the car (A pillar)