Simulating frontal crash of Dodge Neon BIW using Radioss
Objectives
To model frontal crash of BIW with given conditions and request the given output requests and analyse the results.
Input parameters
- Check unit system and either follow[Mg mm s] or [Kg mm ms].
- Create appropriate interface ,friction 0.2 and recommended parameters.
- Make sure of no penetrations and intersection.
- Correct rigid bodies if any issues.
- Create rigid wall with friction 0.1.
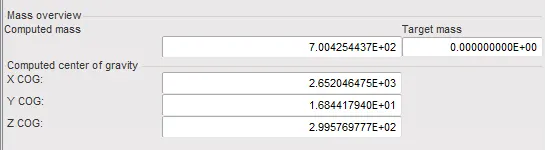
- Compare the model weight with the full scale 300k nodes model and use added masses to reach target weight 700kg while getting CG about the required range.
- Initial velocity 35 mph.
- Use model checker to ensure good quality.
- Time-step :0.5 to 0.1 microseconds.
- Run 80 ms.
Output requests
- Sectional force in the rails at location of indicated node 174247.
- Axial force received on the rails from bumper.
- Shotgun cross sectional forces.
- A pillar cross section.
- Acceleration curve received on the accelerometer at base of B pillar (on B pillar rocker).
- Intrusions on the dash wall 66695,66244
Procedure
Model was imported into HyperMesh and the unit system was found to follow [Kg mm ms].
A type 7 contact was already defined in the model which is shown below.
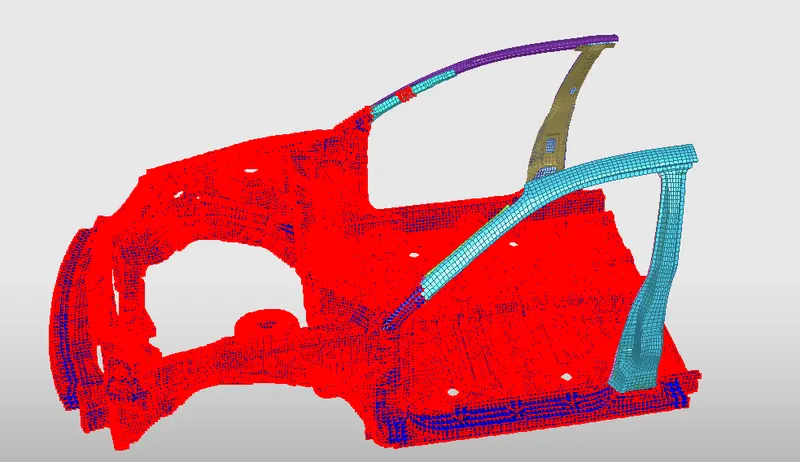
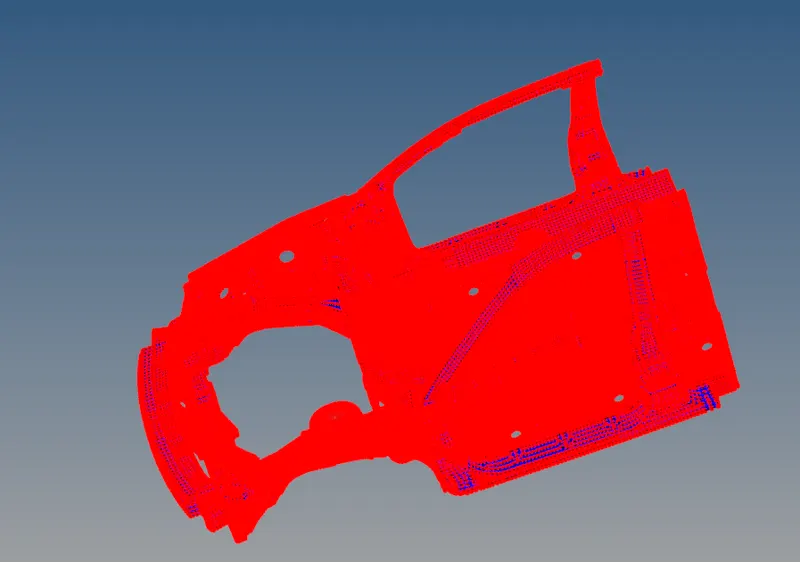
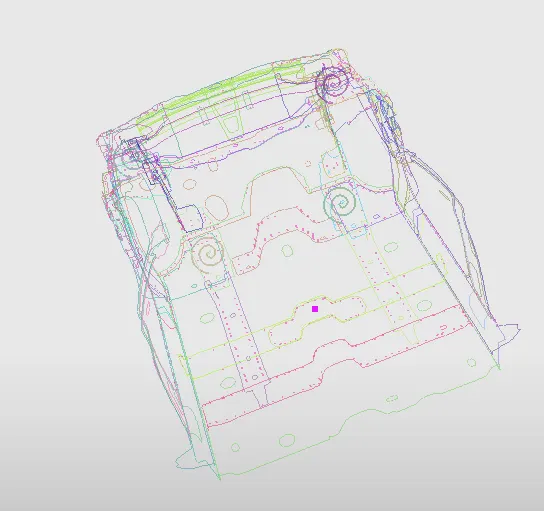
As we can observe not all elements are included in this interface. Therefore this interface was deleted and another type 7 contact was created. For defining self contact all nodes were selected as slave nodes and all elements were selected as master surface and recommended parameters were given with friction value 0.2. The interface is shown below.
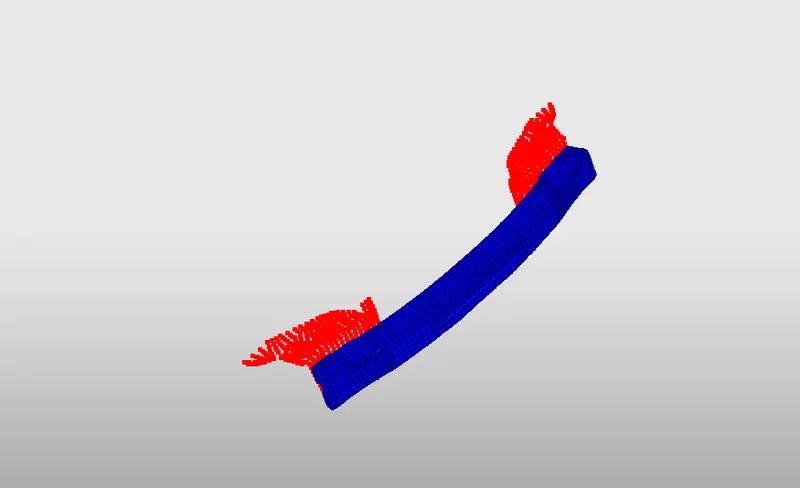
For measuring the axial force another type 7 contact was created between bumper and rail with bumper surface as master and rail nodes as slaves respectively. It is shown below.
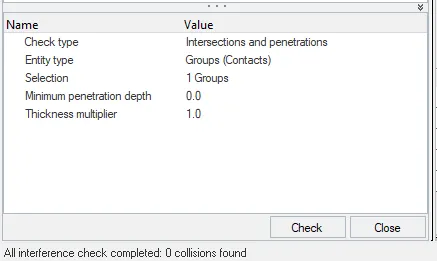
Penetrations and intersections were checked using Tools > Penetration Check > Check type was set as Intersections and penetrations > entity type was selected as Groups(Contacts) > the existing self contact group was selected as Group > Check. No penetrations and intersections were detected by the solver.
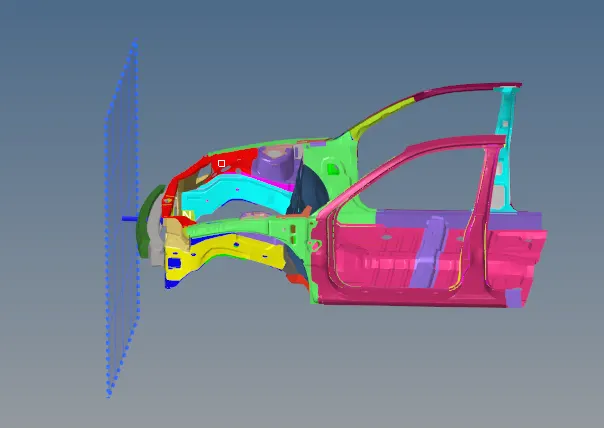
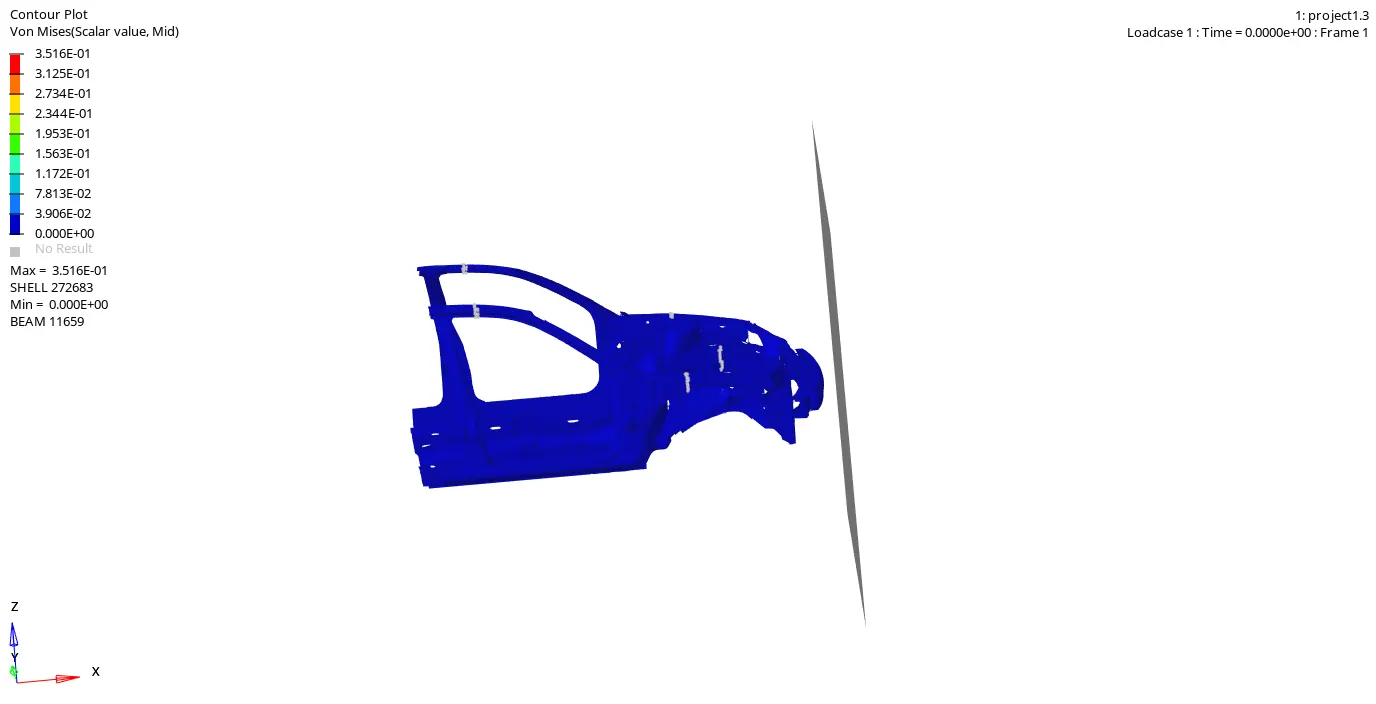
A rigid wall was created with basenode M as a node in the centre of the model. Then the direction of the normal of the rigid wall was set using three nodes N1, N2 and N3. Coulomb friction was set as 0.1.
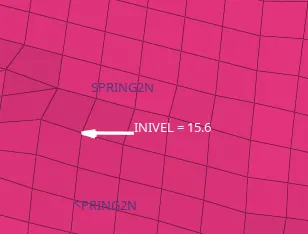
Initial velocity was given as 15.6464 mm/ms in x-direction. All nodes were selected by right clicking on grnd_ID and selecting all the nodes.
The total mass of the car was 188.42 kg. The C.O.G was located away from the middle of the car. To shift C.O.G to a point between the driver and the passenger and along the middle of the car, Masses were added along x-axis and z-axis directions. In the image given below, the new location of C.O.G is shown.
The mass was increased to 700 kg.
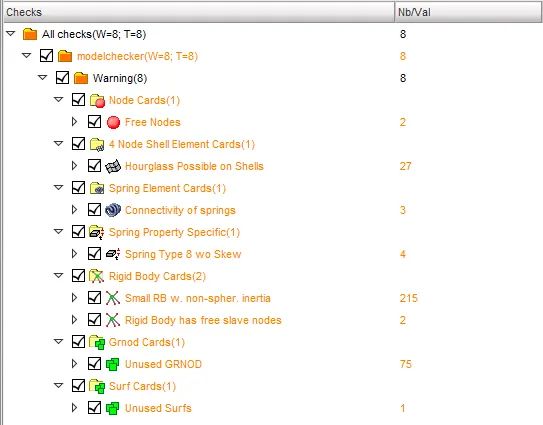
To find out any issues in the model, model checker was run in Hypercrash. 2 errors were detected.
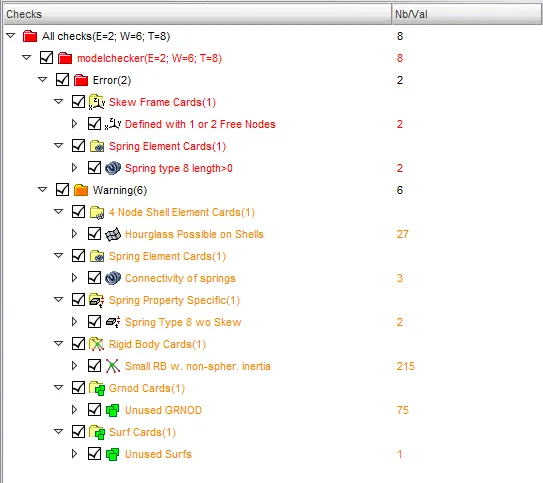
The skew frame cards and spring elements were deleted.
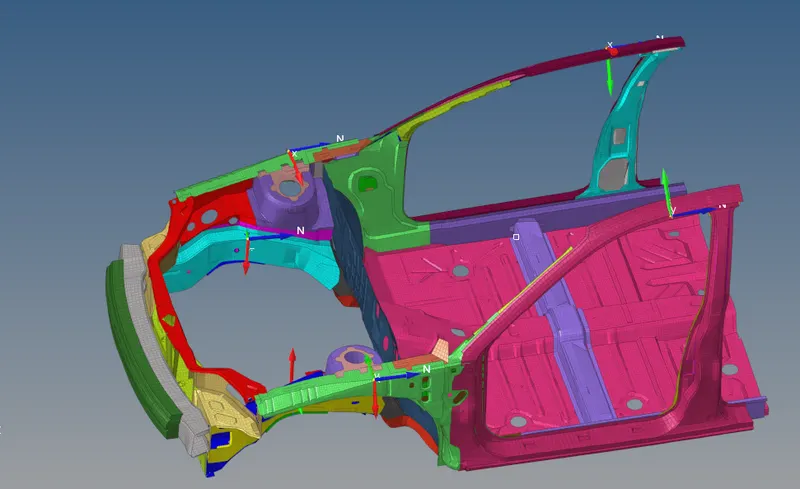
Before creating section a moving frame was created using Create > Frame > MOV. Three nodes were selected such that the normal of the section which was to be created would be the local z-axis.
Then a section was created in the given node id location (174247) in the rail component using Create > SECT > SECT. The same nodes that were defined for the frame was defined in the section card. The frame id of the created frame was given as input for Frame_ID. The elements required for the section was given as input to grshel_id. Similary the sections were created for one more rail section, two A pillars and shotguns. The sections are shown below.
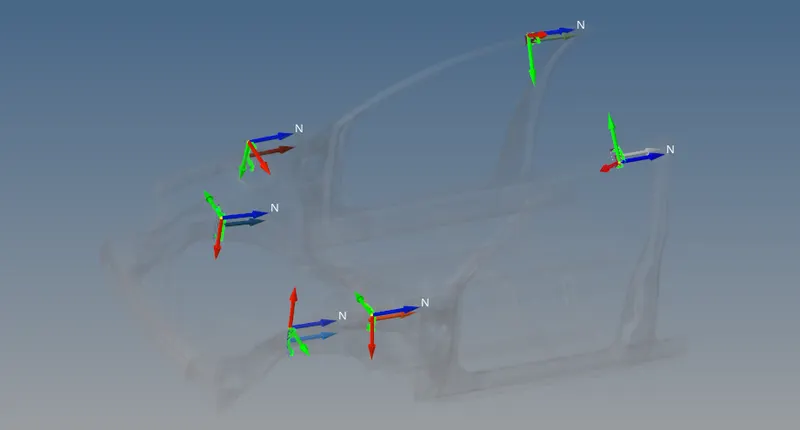
To get the acceleration curve, two accelerometers were placed at the base of the B pillar using Data History > Accelerometer > Accelerometer.
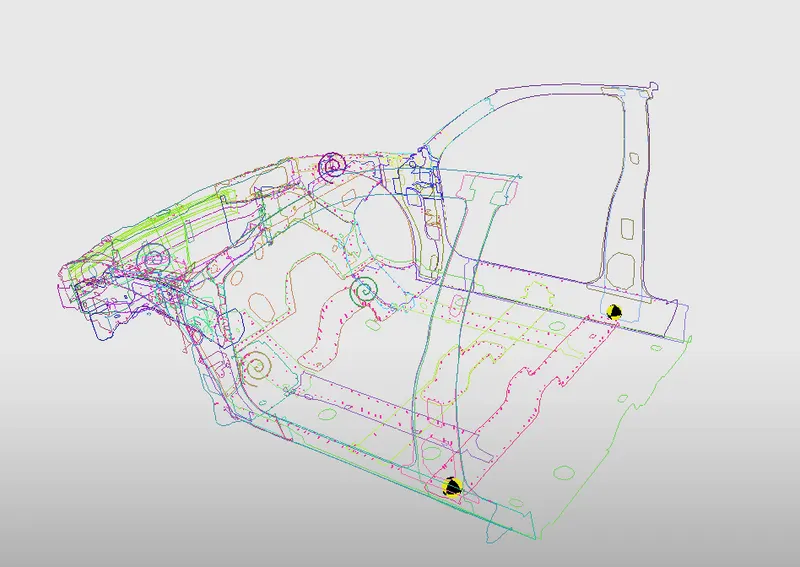
To find the intrusions on the nodes (node id 66695,66244) on the dash wall a time history file for the mentioned nodes were created using Create New > Data History > TH of nodes in hypercrash.
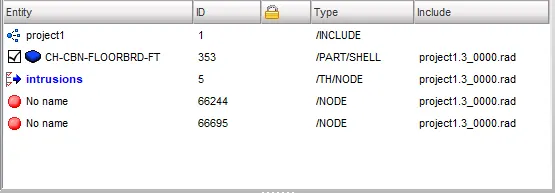
Minimum time step was set using Create New > Control cards > ENGINE > DT and it was set as 0.0005 ms.
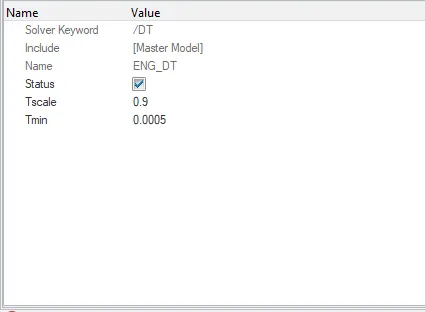
Run time was set as 80 ms.
Results
Given below is the simulation gif.
Given below is plot for axial force received on the rails.
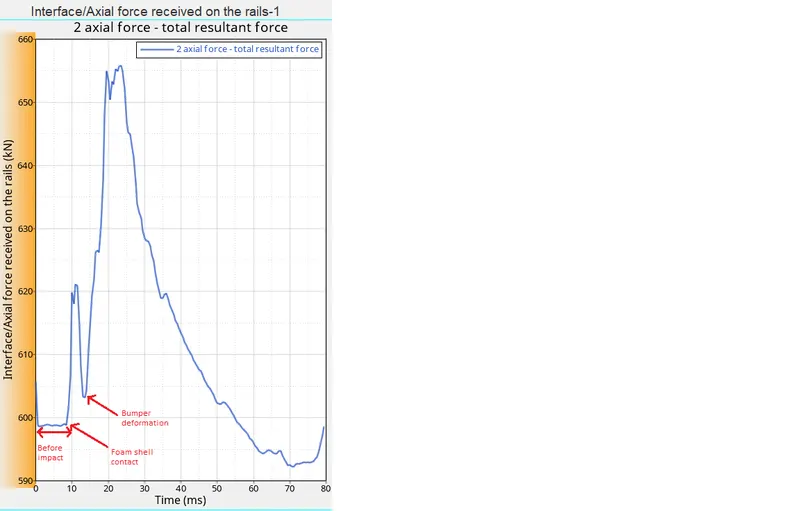
The flat portion of the curve upto 10 seconds is before the impact. As the the car starts to impact the rigid wall, we can observe that the foam shell comes in contact with the rigid wall at first. As foam shell makes contact, there is a sudden increase in axial force upto 620 kN. Foam shell absorbs some of the force , that is why we can see a drop in axial force.
The next sudden increase occurs when the bumper starts deforming. Since bumper is in direct contact with the headlight bracket, the force increases upto 655 kN.
As the bumper beam and foam shell get deformed more, the force experienced by the headlight bracket is reduced.
Given below are the plots for force experienced by the rail sections.
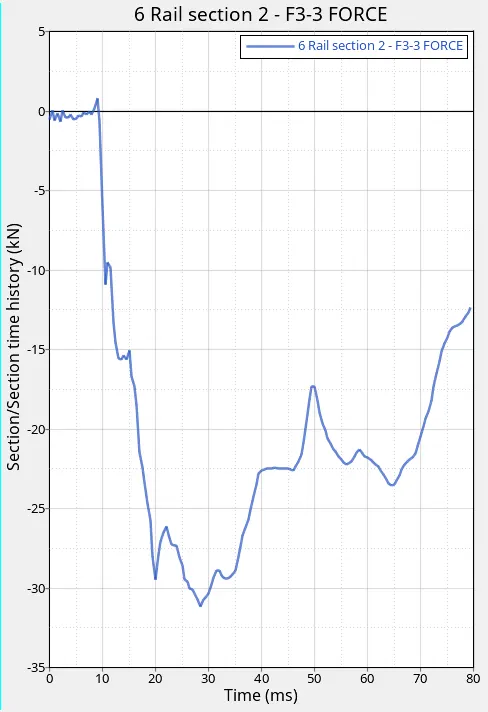
The peak normal force experienced by rail section 2 is around -30 kN. This is much lower than the force experienced by the headlight bracket because the force is distributed to other parts of the car including shotgun, radiator support etc.
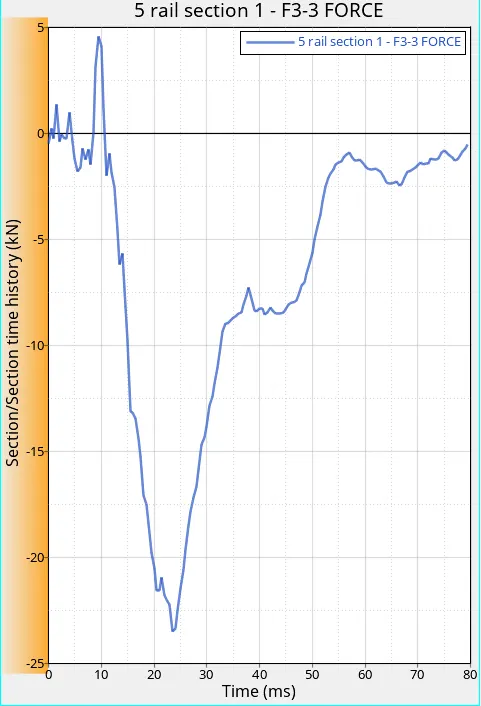
In section 1 the peak normal force experienced is around -24 kN. We can also observe that the normal force is positive in the beginning of the simulation. This change in direction happens because the frame moves along with the section. In this case the local z-axis is the normal of the section. Since the direction of the z-axis is constantly changing the forces experienced by the elements in the section will change the directions.
Given below are the plots of force along normal for shotgun sections.
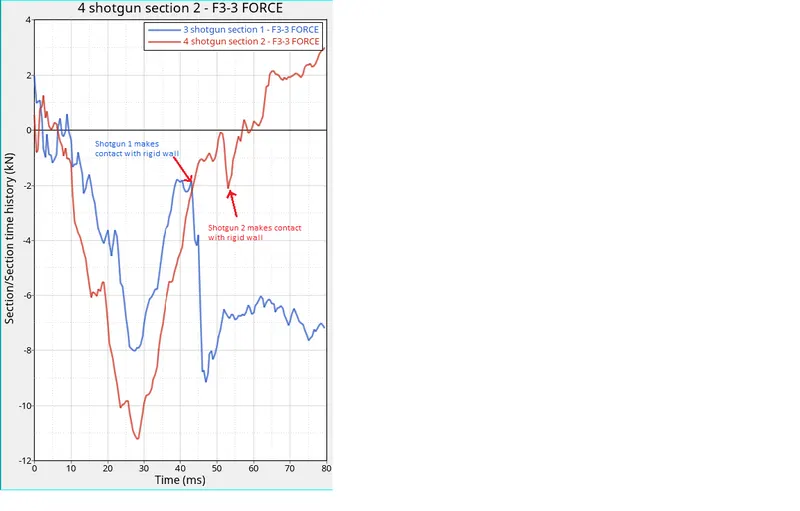
In this case also, the forces experienced by the shotguns increases when the foam shell makes contact with the rigid wall. The peak normal force for shotgun 1 and shotgun 2 is -9 kN and -11 kN respectively. The normal force then keeps on decreasing and it suddenly spikes when the shotgun itself makes direct contact with the rigid wall.
Given below are the normal force plots for A pillar sections.
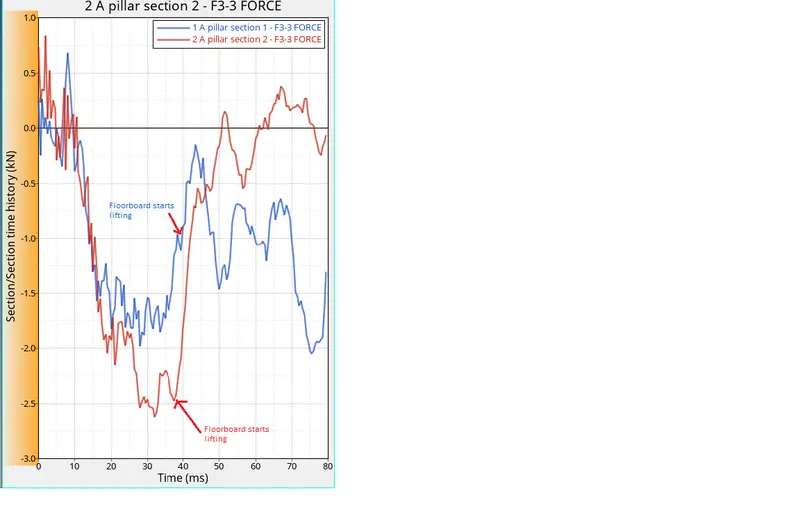
The peak force for A pillar 1 and A pillar 2 are -2 kN and -2.6 kN respectively. First spike in force occurs when the foam shell contacts the rigid wall. There is a second spike in force when the floorboard starts lifting.
Given below is the plot of sectional forces of rail 1, shotgun 1 and A pillar 1.
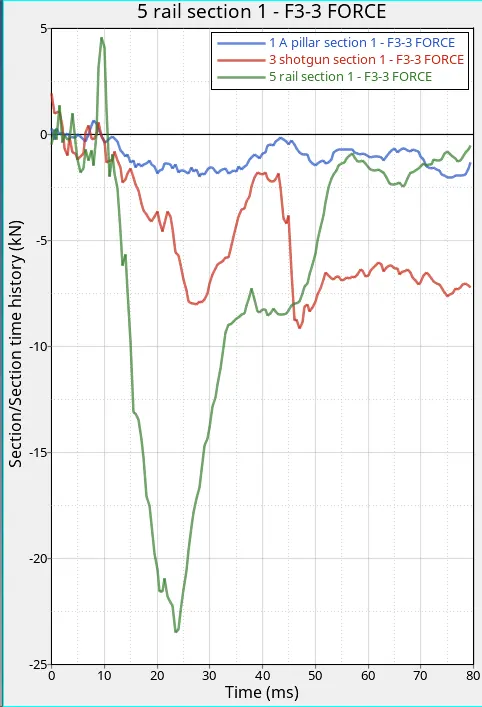
We can observe that the force experienced by rail section is the highest followed by shotgun and the least force is experienced by the A pillar. There is a reduction of forces as components get closer to the passenger. This is how a car should behave while crashing. The components in the front should absorb all the forces and minimize the damage for the passengers.
The intrusions for nodes 66695 and 66244 are plotted below.
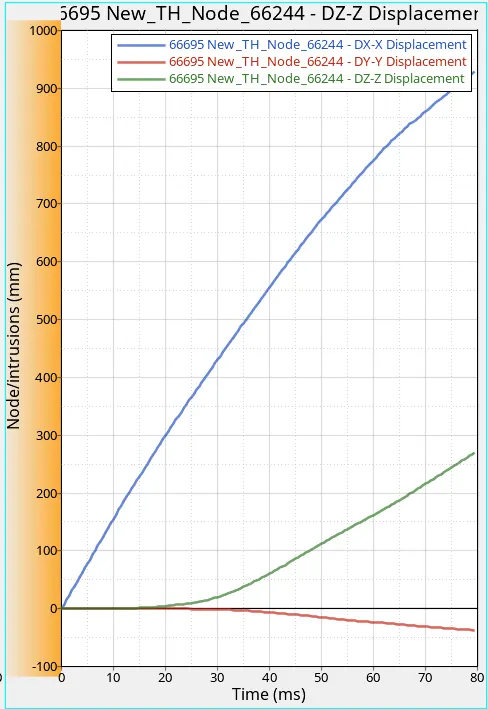
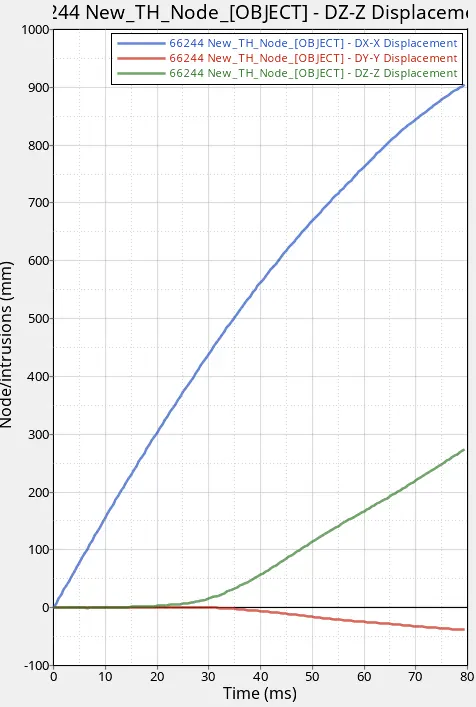
The high value of displacement in x-direction is because the car is moving in the x-direction itself. However we can observe that there is a significant displacement in z-direction ( around 270mm ) which is because of the lifting of the floorboard.
The node 66244 also has displacement in a similar manner.
The acceleration plots from the accelerometer at the base of the B pillar is given below.
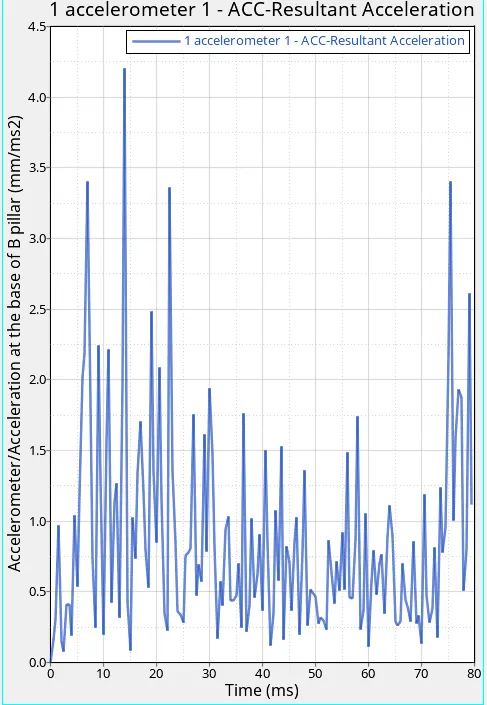
Peak resultant acceleration value recorded is 4.2 mm/ms^2. The accelerometer on the other side too produced a similar graph.
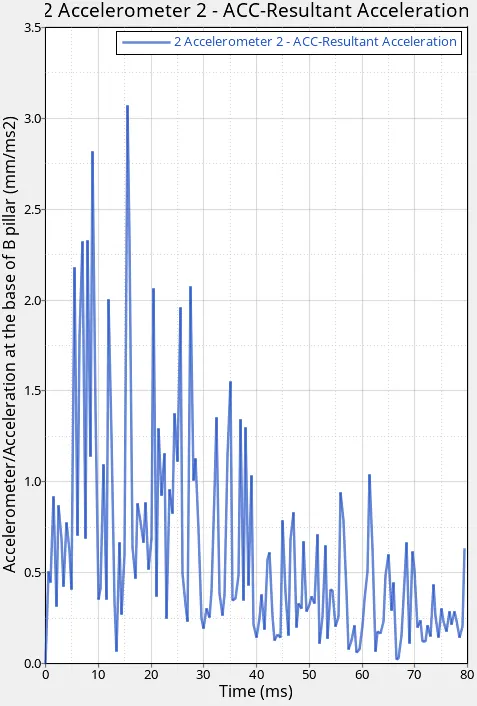
Here, the peak acceleration value is 3.1 mm/ms^2.
Given below are the energy plots.
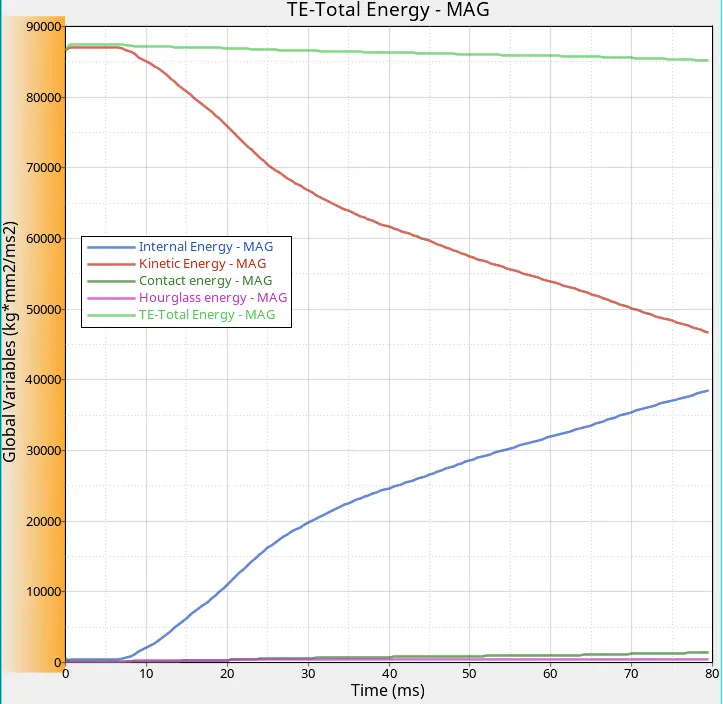
We can observe that the car is absorbing the crash smoothly from internal energy and kinetic energy curves. However, the car still has a high value of kinetic energy because it hasn't completely come to rest. Numerical energies such as contact and hourglass energies are under control. There is only an energy error value of -0.6%.
Conclusion
The crash was simulated according to the given parameters and the results were analyzed.