RADIOSS Interfaces & Study of Effect of Notches
MESHING AND EFFECT OF NOTCH
OBJECTIVE: Aim of this assignment is to mesh the given bumper component and run simulations on the provided crash tube considering 6 different cases (given below) and compare their results.
CASES:
- Run the simulation on the provided model without changing anything
- Change Inacti to 6 and run the simulation
- Create a type 11 contact card and run the simulation
- Remove both the notches and boundary condition and run the simulation
- Create a notch in the middle of the tube and run the simulation
- Create a notch on the opposite side of the faces and run the simulation
PROCEDURE:
MESHING THE GIVEN BUMPER COMPONENT:
STEP-1: Open the model and change the visuals from auto to topo. This will help us look at the unnecessary free edges and repair them.
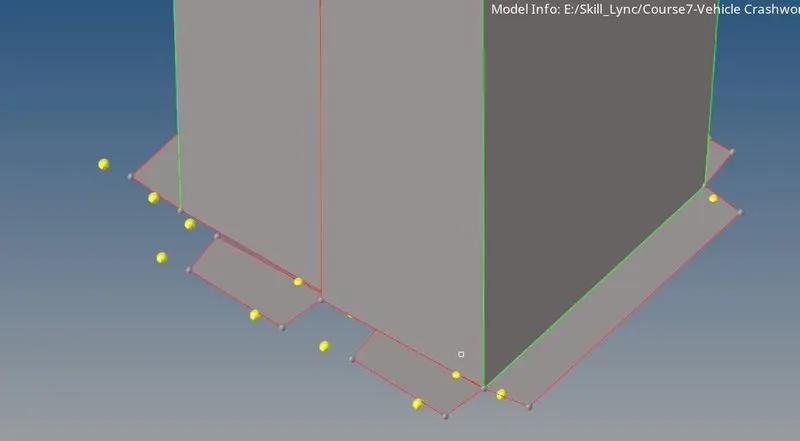
STEP-2: As there are free edges in the middle of the component, clean the geometry to get a good mesh flow. Go to geometry< tools and make use of the toggle tool to convert free edges to connected edges. We can also use surface edit tools like extend and trim to get the desired results.
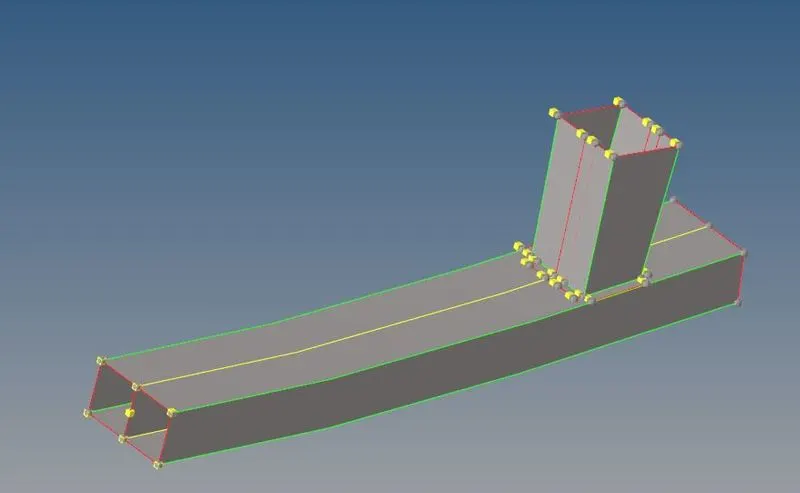
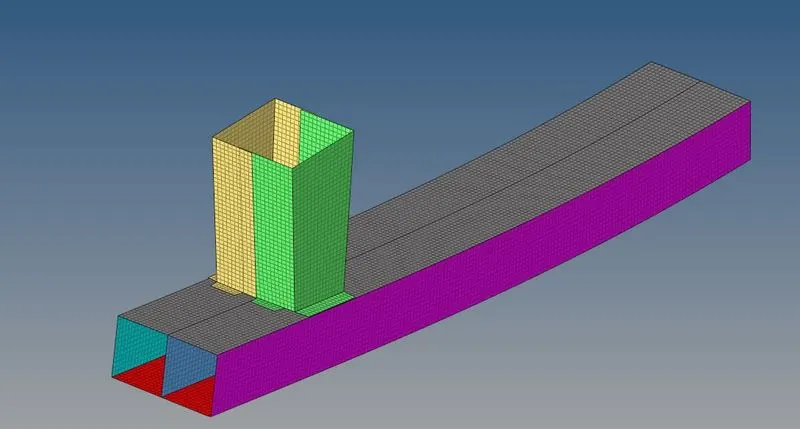
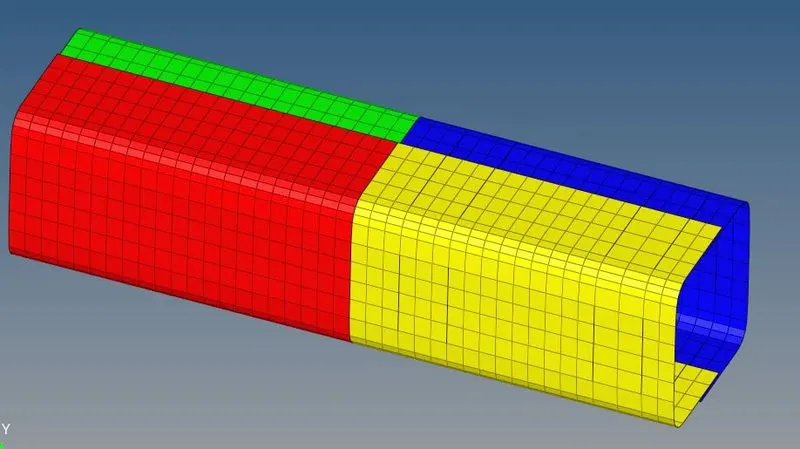
STEP-3: Go to 2D< automesh and mesh the component using 6mm element size. As the component does not have complex features, we get a quad-only mesh here.

STEP-4: After meshing, we need to make sure that the model is properly attached for analysis. Thus, use connectors to join the components together.
RUNNING SIMULATIONS ON THE REQUIRED CASES:
CASE-1: run the simulation without any changes
Step-1: Import the model. Go to import< solver deck< select 0000.rad file and import the model. Once imported, we can change the wireframe mode to shaded mode to look at the given FE data properly.
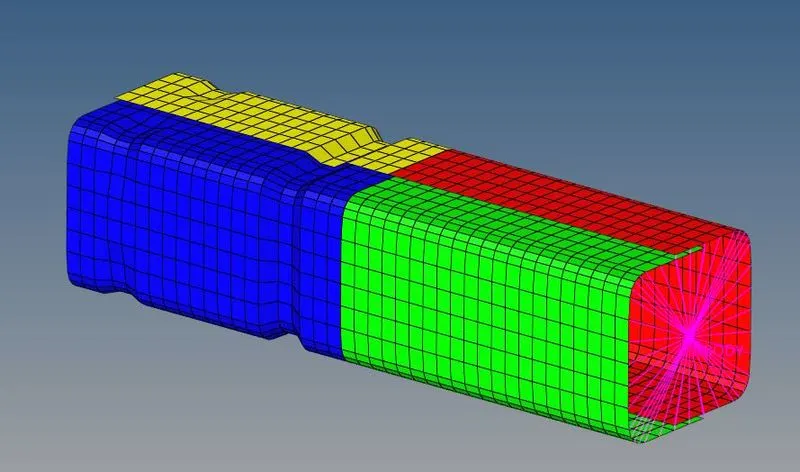
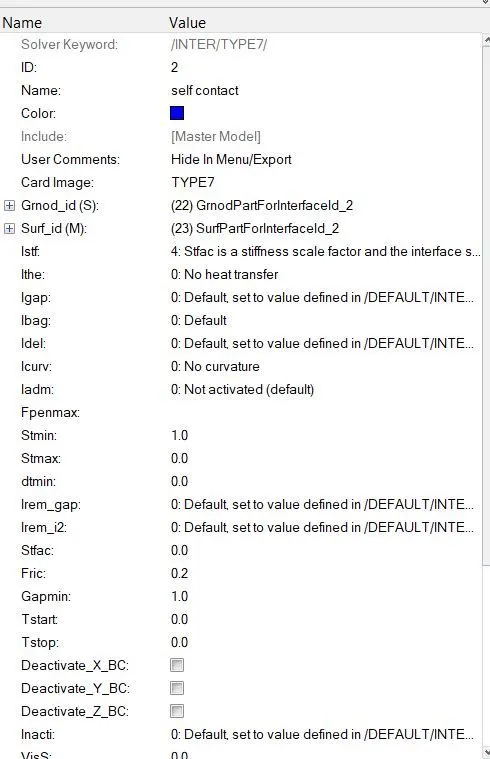
Step-2: Check the default values of the model. Go to groups< self-contact card and check all the values that we will be comparing with other cases.
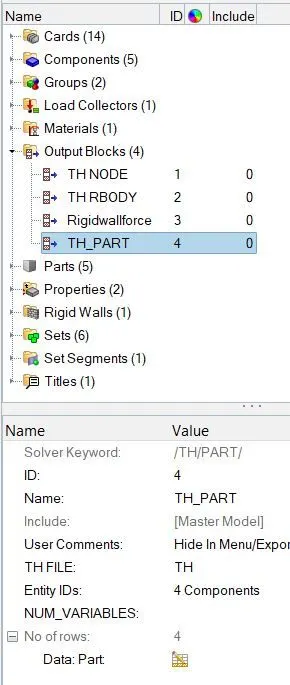
Step-3: Create TH_Part to create time history according to the different components. This card will enable us to study the graphs in detail as we can plot the energies and forces for all four components present in the model.
Step-4: Run the analysis. Got to analysis< Radioss and change the option to –nt 4 which will speed up the simulation. Once we are set, hit radioss to run the simulation.
Step-5: Check energy error and mass error. Go to the folder where simulation files are created and open 0001.out file. Scroll and check the energy and mass error. Energy error must be between the range of (-15%) – (+15%).
Step-6: Run the animation by changing the hypermesh window to hyperview window and loading the h3d file. Plot the necessary graphs by changing the window to hypergraph 2D and loading T01 file.
RESULTS:
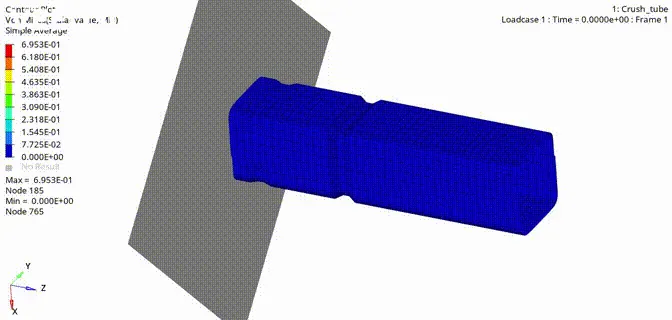
VIDEO LINK: https://www.veed.io/view/0675c3a6-8e73-4ac3-ba81-6ffc7d8a10e5
REMARKS:
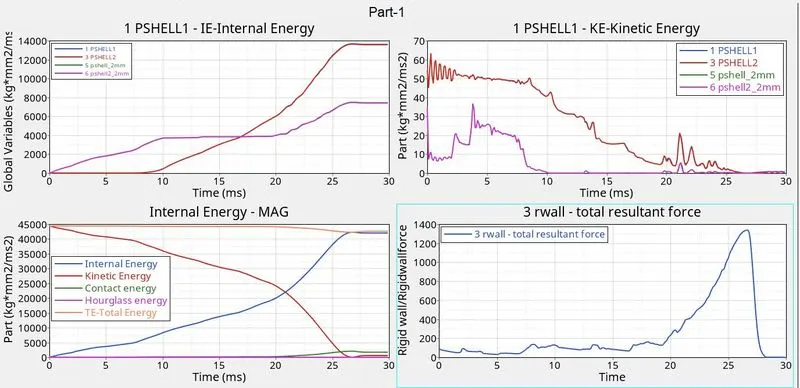
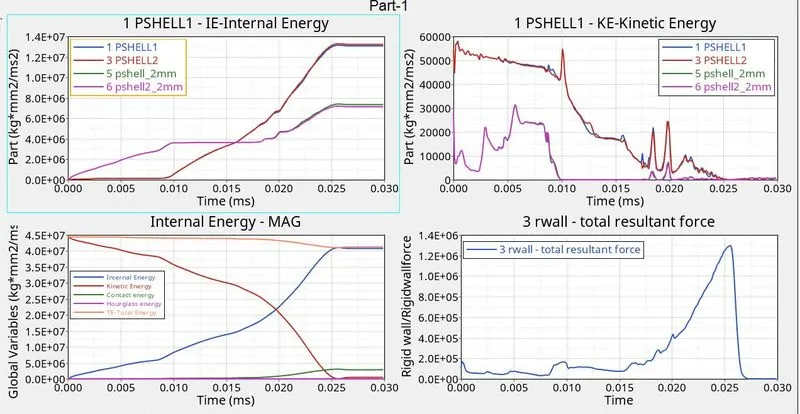
- Internal energy for components PSHELL1 and PSHELL3 is zero for the first 10ms, while it is increasing for the rest of the two components. This is because the internal energy is a direct result of resistive forces than develop in the component to the applied force, and as we can see in the simulation the first deformation is in the middle notch area which lies in the other components, they have stored internal energies in that area. Further, as the animation advances, we can see an increase in the internal energies of all the components. Mentioned components have mode internal energy because the elements present in those components go on deforming because of the applied load at their corner till the end, and as a result, they are storing the energy till the end.
- The kinetic energy in PSHELL1 and PSHELL3 is very high at the start as compared to the other two components because the force is applied at their end, and this force sets the elements into motion giving rise to KE. However, the KE in the other two components increases at some time step because at that time step the elements are set into motion and deformed.
- The overall internal energy goes on increasing and after approx. 26ms time step it becomes constant. This is the time when the tubes have completely crashed into the rigid wall and no more energy can be absorbed.
- We can see a slight increase in the contact energy curve from the 20ms mark. This means that master and slave nodes are coming in contact at this time.
- The rigid wall forces increase and decrease throughout the graph. At one time step is shoots to become maximum. This is the time when contact energy is also the maximum and thus we can conclude that this rise is due to the contact in the simulation.
CASE-2: set Inacti value to 6 and run the simulation
- Follow the exact same procedure as mentioned above. Just change the value of Inacti by going to groups< Type 7 card and then run the simulation.
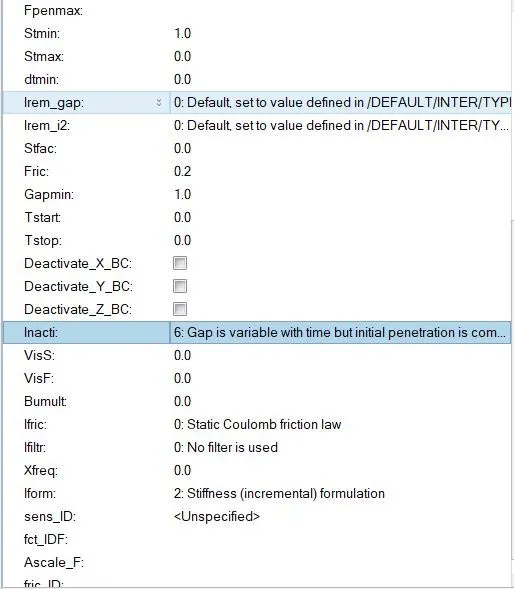
There are cases where slave node is present in the gap region of the master segment which can cause a locking situation causing failure (Initial resistive forces gives an error). Thus, by setting Inacti=6 we reduce and scale the gap to remove that slave node from the gap region of the master.
RESULTS:
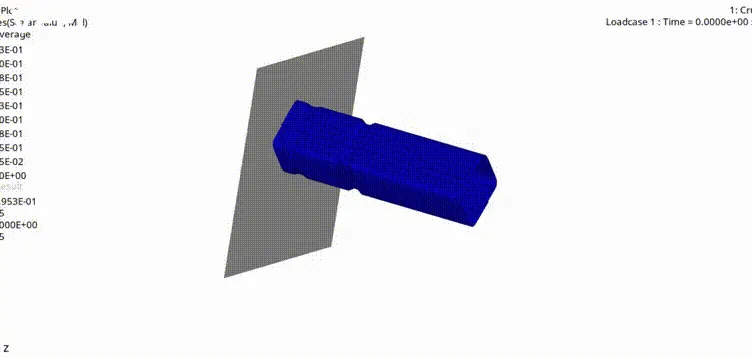
VIDEO LINK: https://www.veed.io/view/133c1566-6698-4dbc-8c48-0f2757247176
REMARKS:
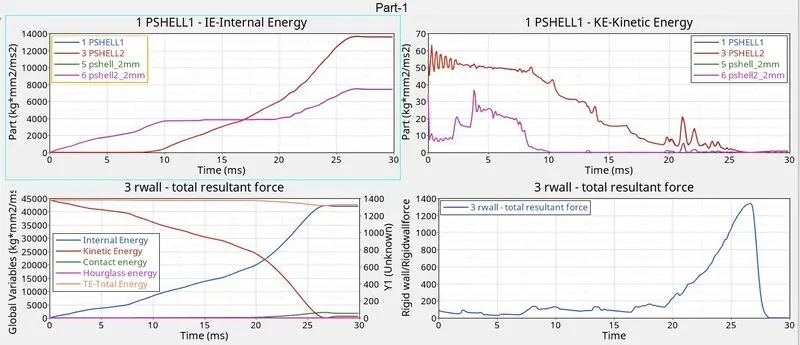
- It is not much different from the case-1 results. The internal energy curves for all the components are similar to that observed in case-1.
- In this case, too, the rigid wall force spikes at a certain time step which is exactly when the contact energy is maximum. Thus, the contact force is more at the end of the crushing phase. The rigid wall force graphs decrease after the spike and so does the graph of contact energy. The rigid wall force becomes zero pointing that the contact between the wall and the crush tube is broken now. This can be double-checked in the animation where we can see the tube moving back slightly at the end of the animation.
- Overall there is not much change in both the cases despite the change in value meaning that there we no initial penetration present in the model.
CASE-3: create a type-11 card and run the simulation
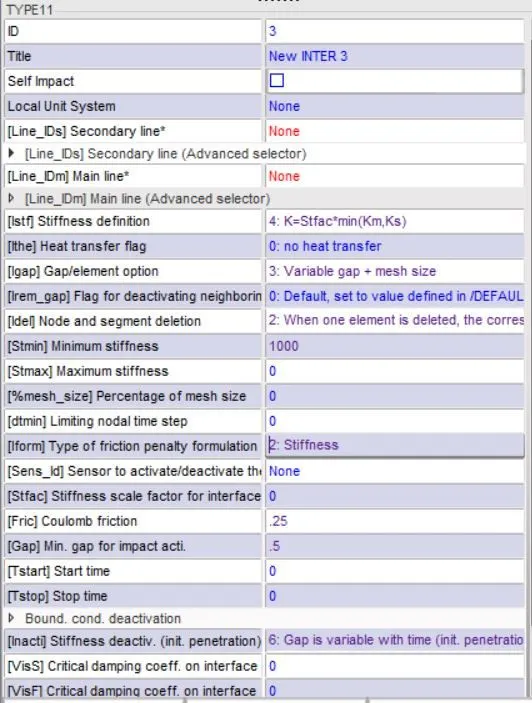
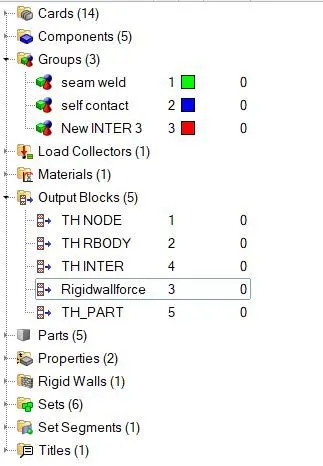
- Go to application< open hypecrash.
- Go to loadcase< contact interface< right click< create Type 11 card.
- Put all the recommended values
- The rest of the procedure is the same
RESULTS:
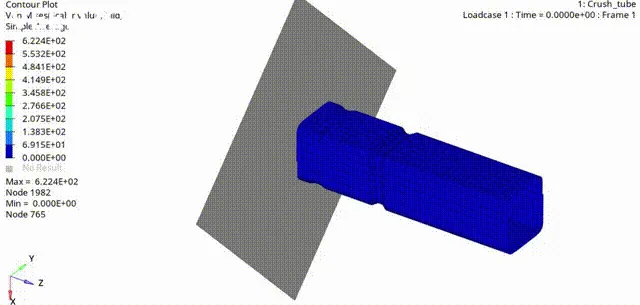
VIDEO LINK: https://www.veed.io/view/39cc139e-4ba5-46d5-8e9d-8cf379ae6611
REMARKS:
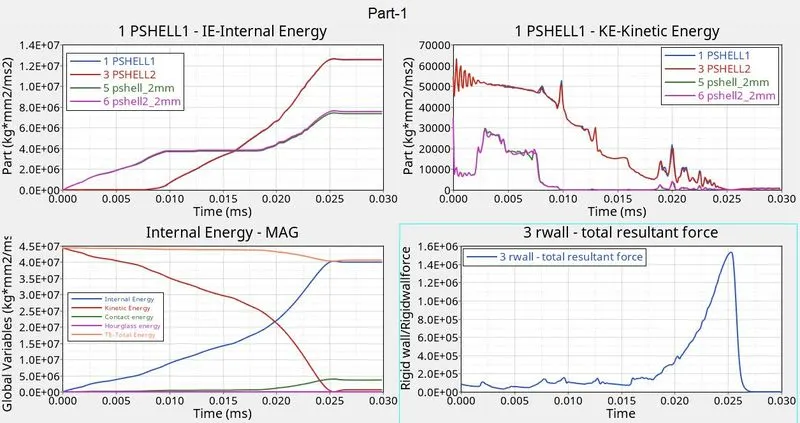
- There is again no big change in the graph of internal energy or kinetic energy. Both the curves are identical to the one that we have observed in cases 1 and 2.
- The internal energy becomes constant after some time because this is the time when the tube has crashed completely and the elements cannot absorb more energy.
- The rigid wall force graph too seems identical to the above cases, shooting at a certain time which shows that most of the elements are in contact with the wall at this time. This makes sense because all tube is crushed at this time and it is in contact with the wall which can be seen in the animation
- Despite adding a type-11 card in the simulation, we do not get changes in the energies and forces. Thus, we can reach the conclusion that there was slight to no edge-to-edge contact between master and slave.
CASE-4: delete boundary conditions and remove the notches
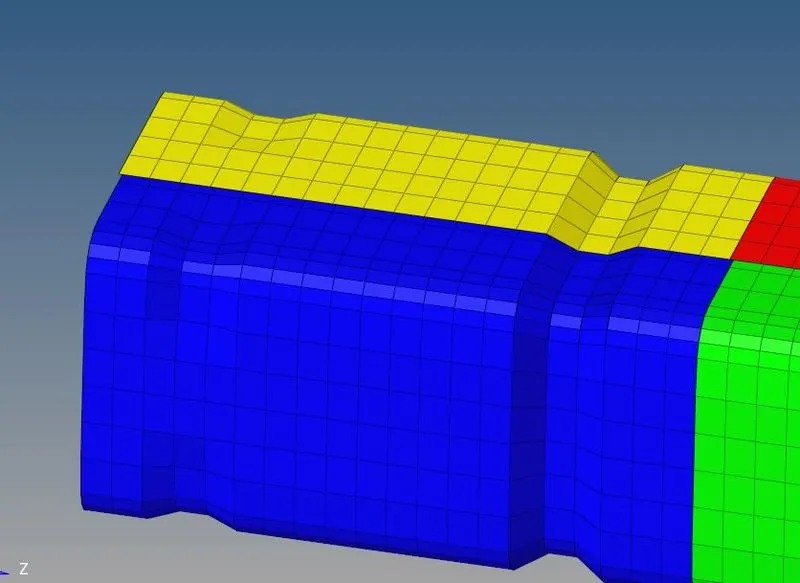
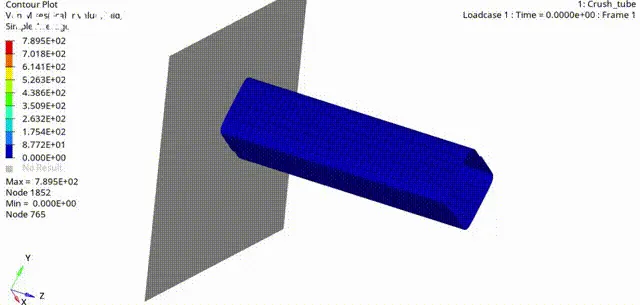
- Delete the elements representing the notches and go to 2D< ruled and select nodes to create a straight mesh without a surface.
- Go to the solver and delete boundary conditions.
- The rest of the procedure is the same.

RESULTS:
VIDEO LINK: https://www.veed.io/view/db11fdfb-f4ab-42b5-b948-bfba53aeb9a2
REMARKS:
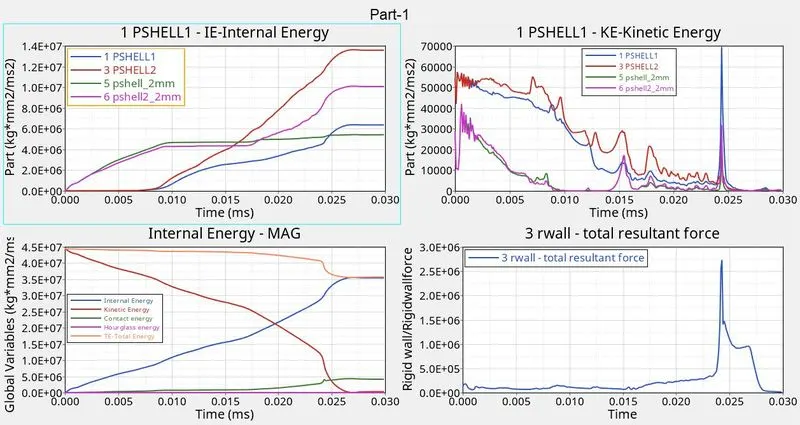
- With no boundary conditions, the crush tube has all degrees of freedom. Thus, at the end of the simulation, we can see a movement that was not observed in the earlier cases.
- In earlier cases, we have observed that the first deformation took place at the notch. But, as here no notch is present, we can see that the first elements to deform are the ones that are in contact with the wall. This makes sense because the crush tube is being pushed from behind.
- The spike in the rigid wall forces is because at that time many elements were in contact with the wall because the tube was crushed completely at this time. This can be corroborated by the contact energy graph which also shows an increase at this time step.
- The kinetic energy of the PSHELL_1 is maximum at one point because the elements on that component are set into maximum motion are they are be seen bending and moving forward at this time.
CASE-5: create a notch in the middle and run the simulation
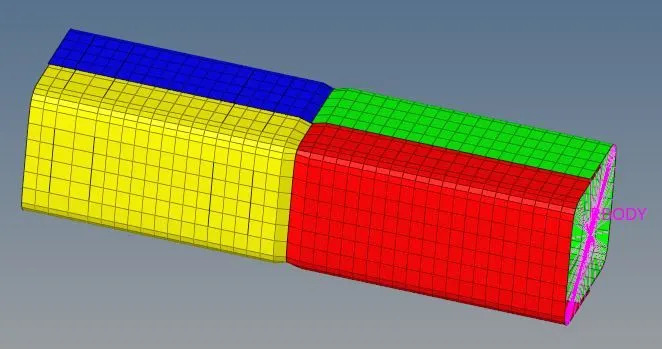
- Go to translate< select nodes and translate using axis

RESULTS:
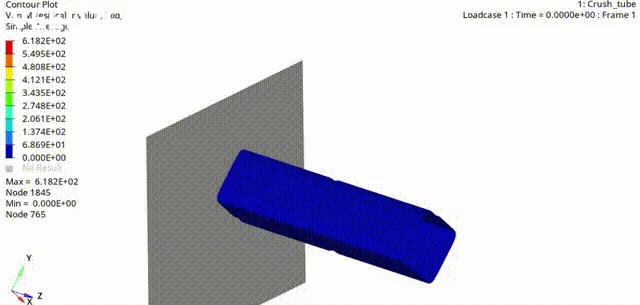
VIDEO LINK: https://www.veed.io/view/6fc4d59d-0e00-4614-96ec-977f551f662e
REMARKS:
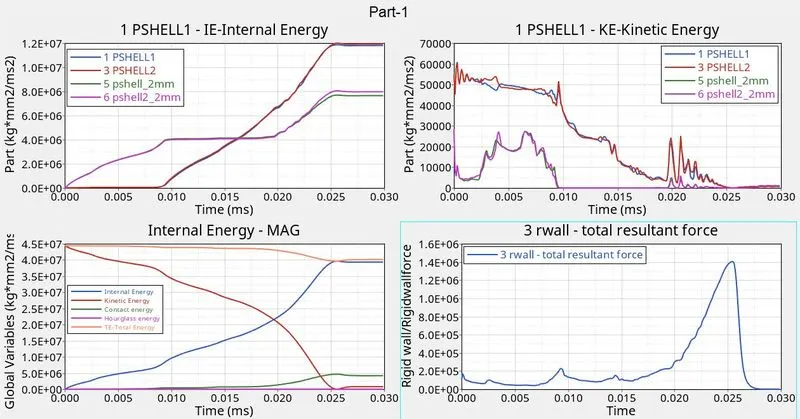
- Like early cases, we have a notch area present in this case which has less stiffness. Thus, we can again observe the notch elements getting deformed earlier than the elements near the rigid wall. After the notch elements deformation, we can observe other elements deforming in a proper fashion.
- The internal energy graph increases constantly, in the beginning, indicating that the elements are absorbing the energy or say storing energy as the result of resistive force. However, from the 25th ms we can see a constant graph. Thus we can say that after this time step there the elements were fully crushed, and this can be seen in the animation too.
- The rigid wall force is maximum at this time, thus we can say that most of the elements are in contact with the wall as contact energy has also increased at this time.
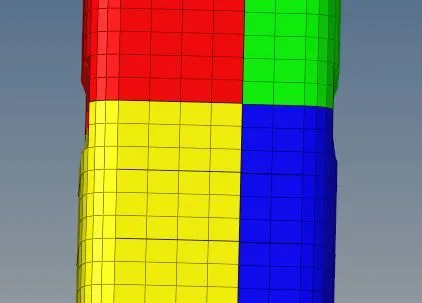
CASE-6: create a notch on two opposite faces
RESULTS:
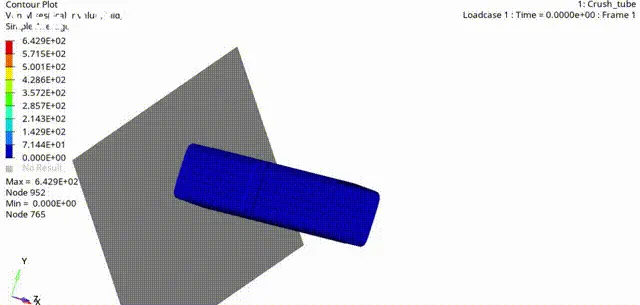
VIDEO LINK: https://www.veed.io/view/cd0f4bd8-6350-4afa-93ff-8eca087c2da7
REMARKS:
- There is not much difference compared to the above case. Here too the deformation starts at the notch area which is expected.
- The energy graphs, force graphs, and von mises stress too do not show much difference.
COMPARISON TABLE:
| CASES | CHANGES | ENERGY ERROR (%) | MASS ERROR | MAX VON MISES STRESS (Mpa) | SIMULATION TIME (s) | OBSERVATION |
| Case-1 | No change | -3.8 | 0.00 | 0.6953 | 260.14 | Notch elements deformed first followed by all the elements till the tube crushed. |
| Case-2 | Inacti=6 | -3.8 | 0.00 | 0.6953 | 266.95 | Notch area deformed followed by other elements in orderly fashion |
| Case-3 | Added Type-11 contact interface | -8.2 | 0.00 | 0.6224 | 736.41 | Notch area deformed followed by other elements in orderly fashion |
| Case-4 | Deleted notches and BC | -10.3 | 0.00 | 0.7895 | 650.19 | The elements in contact with the wall deformed first and then the rest of the elements followed |
| Case-5 | Created a notch in the middle | -9.2 | 0.00 | 0.6182 | 721.95 | Elements near the notch deformed followed by the rest of the model. |
| Case-6 | Created a notch on opposite faces | -6.4 | 0.00 | 0.6429 | 671.27 | Elements near the notch deformed followed by the rest of the model. |
CONCLUSION: Through this assignment, I have learned about contact interfaces, creating interface cards, and reading graphs.