Assignment 5-RADIOSS Interfaces & Study of Effect of Notches Challenge
Objectives
1. To mesh the bumper model with a model size of 6 mm.
2. To study the effect of notches and various interface formulations on the simulation of a crush tube.
1. Bumper model
The bumper model is opened in Hypermesh and the edge connectivity can be checked as shown below.
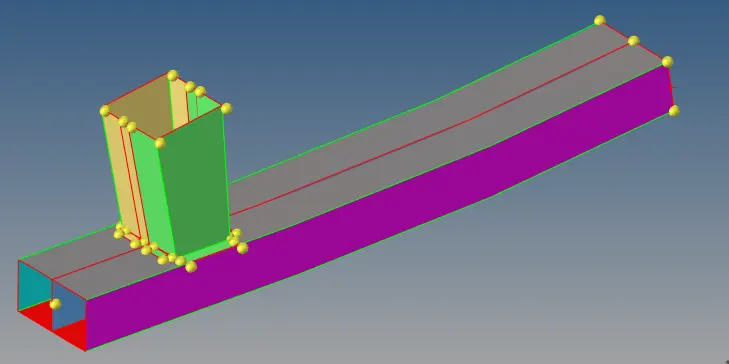
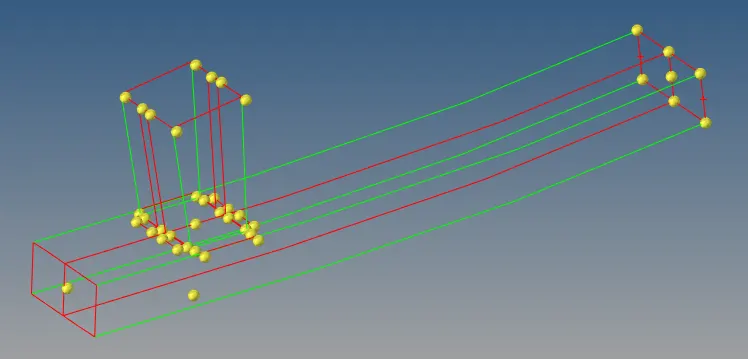
There are free edges in the connections of the crash box to the bumper surface and also in the connection of the bumper mid surface to the front and the rear surfaces.
Using surface edit tool and the quick edit panel, these connectivity issues can be resolved. The final bumper model which is ready for meshing is shown below.
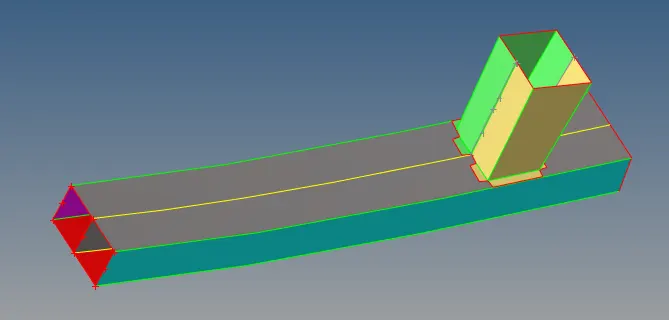
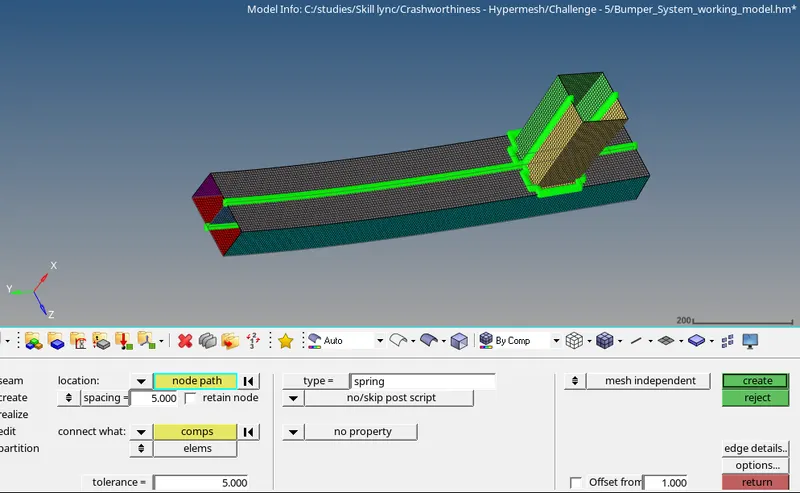
There is a non-manifold edge (highlighted in yellow) at the connection of the mid plane to the front and rear faces, which can be corrected later using a seam weld.
The mesh is generated using a mesh size of 6 mm using the 2D automesh panel as shown below.
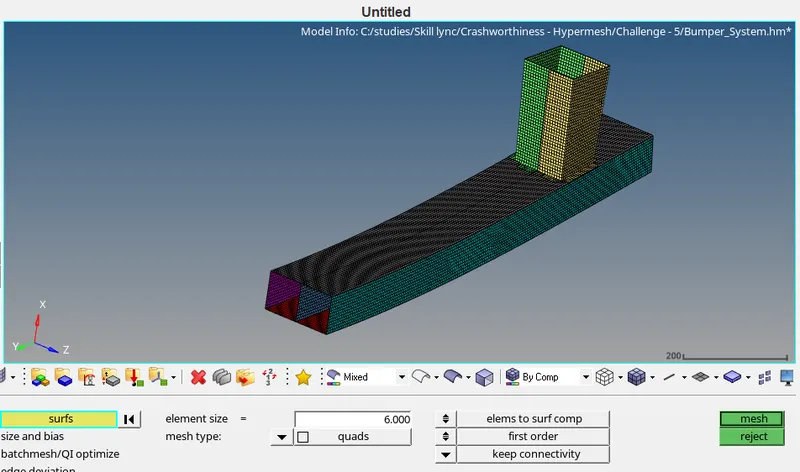
Now the edges which were free, can be welded using a seam weld as shown below.
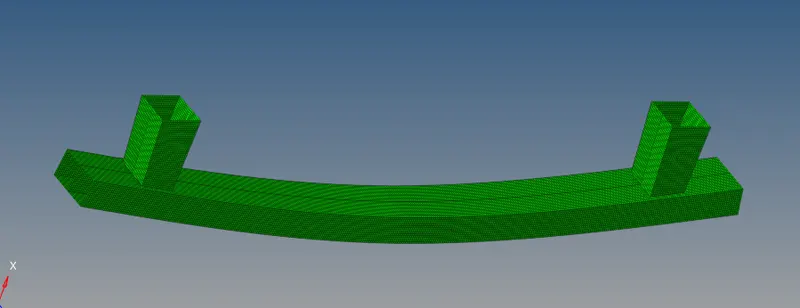
After checking quality for the length and connectivity, the model can be reflected to represent the complete bumper as shown below.
2. Crush tube analysis
The simulation of the crush tube against a rigid wall is done for six different cases and the results are compared.
Case 1: Crush tube - Type 7 - default
The initial crush tube model Crush_tube_0000.rad is opened and viewed as shown below.
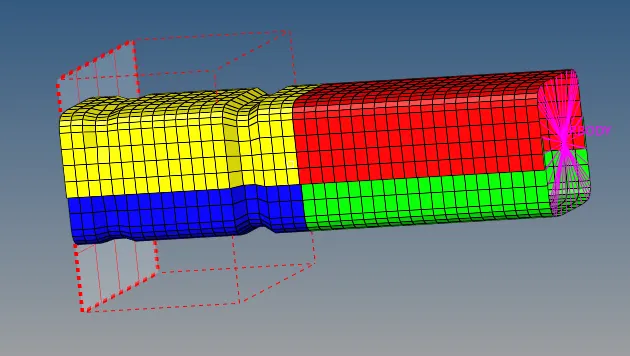
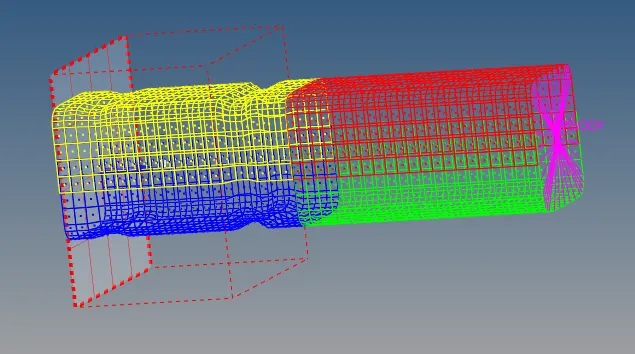
The type 7 contact has been used to define the interface with default parameters as shown below.
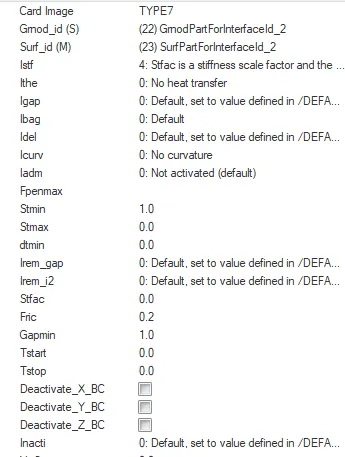
The INACTI - which defines the method for resolving initial penetrations has been set to 0, which is the default method. The Gapmin value is set to 1.0 by default.
Since Type 7 is used here for defining the self contact, both the master and the slave are consist of the same 4 components - the two sets of opposing shell components. The two upper PSHELL components have a thickness of 3mm and the two lower ones have a thickness of 2 mm.
In order to capture the self contact forces and the part in the time history (TO1) file, a TH INTER and a TH PART card have been defined as shown below.
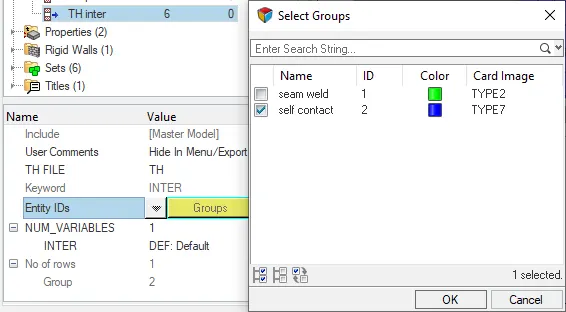
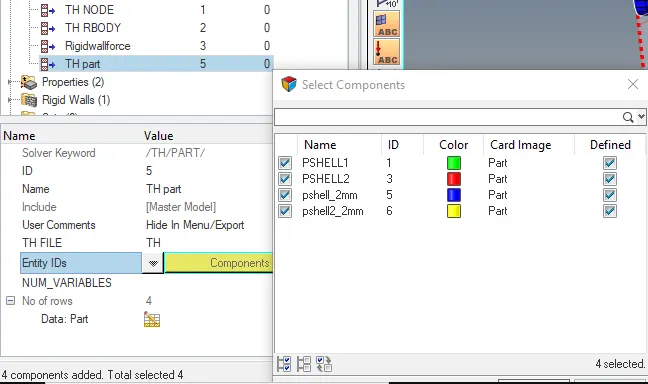
The output plot from the TH plot card can be used to compare the results of the 6 cases at the end.
The rigid body has been defined with an initial velocity of 13.3 mm/ms which is approximately 48 km/hr.
The model is simulated using the RADIOSS solver and the results are discussed below.
Results
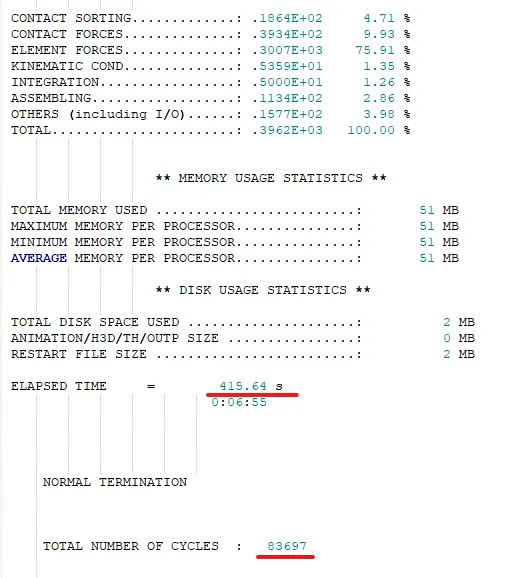
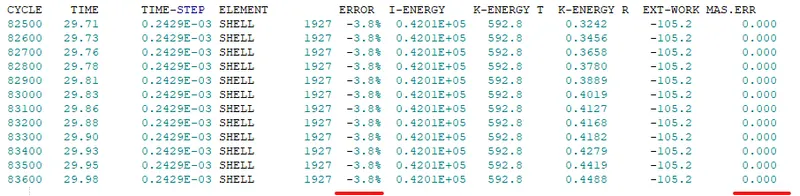
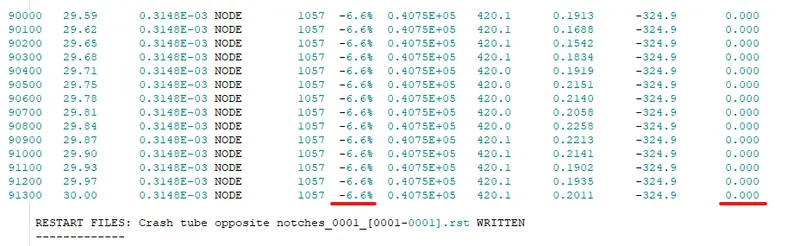
The important results of the simulation run, such as number of cycles, simulation time, mass and energy errors, can be viewed in the 0001.out file, as shown below.
Energy Plot
The internal, kinetic, hourglass and the total energies can be plotted using the TO1 file in Hypergraph 2D, as shown below.
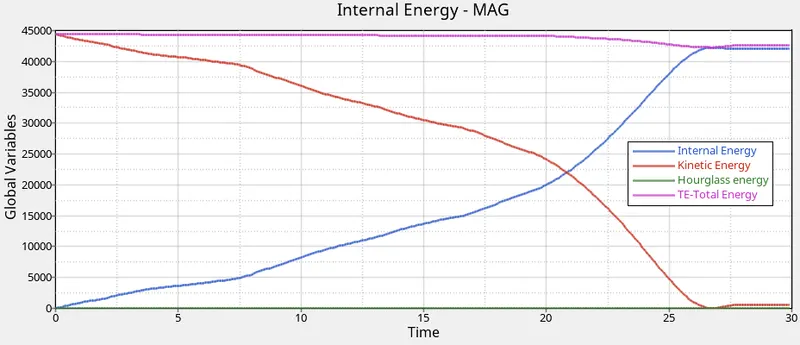
The internal energy, which is representative of the energy absorbed, increases with time, as the tube makes contact with the rigid wall. We can observe a small peak and a drop off at around 27 seconds, which is the time when the tube is completely crushed and no more energy can be absorbed by the system.
The hourglass energy is zero, since the QEPH 24 element formulation has integrated hourglass control.
Internal and Contact energies
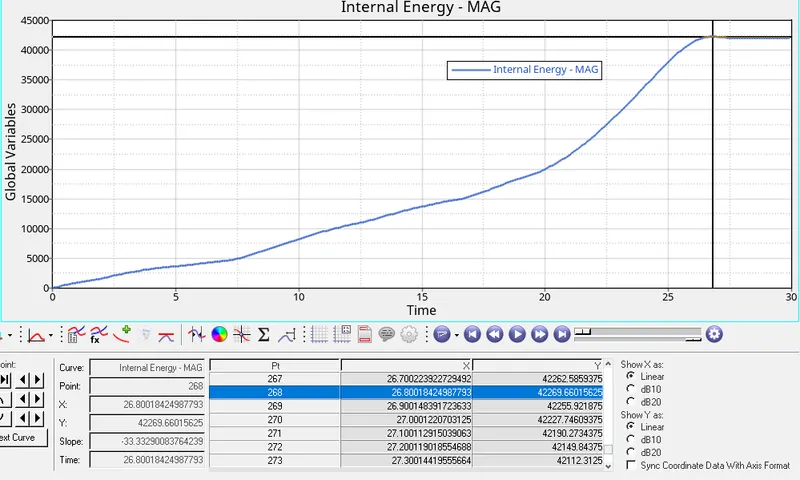
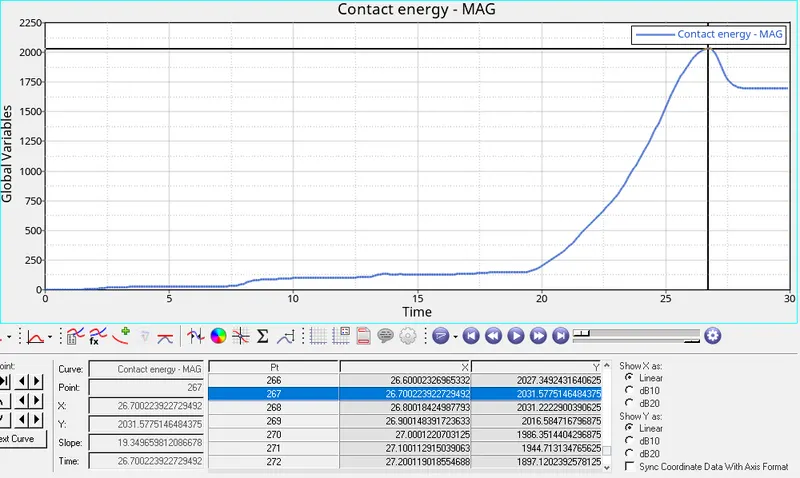
The plots below show the maximum values of the internal and the contact energies.
The max internal energy is 42269.66
The max contact energy is 2031.57
RIGID WALL FORCE
The force on the rigid wall due to the impact, over the course of the simulation is shown in the figure below.
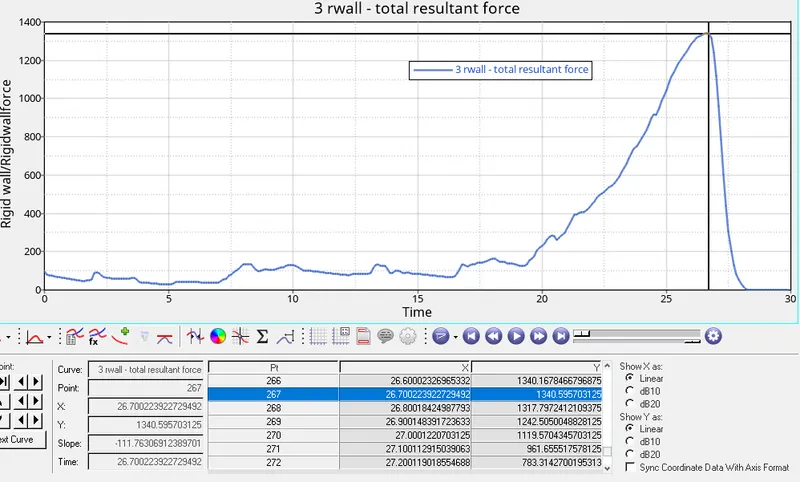
The max force is 1340.59 N, which coincides with the point at which the the internal energy peak is achieved. This represents the point in the simulation, at which the crush tube is completely deformed, and the rigid wall has to react the forces due to the impact motion of the rigid body.
The value of the force drops rapidly thereafter, since the entire crush tube bounces away after the impact and loses contact with the rigid wall.
SELF CONTACT FORCE
The self contact force from the TH inter card helps identify the forces due to the Type 7 contact formulation.
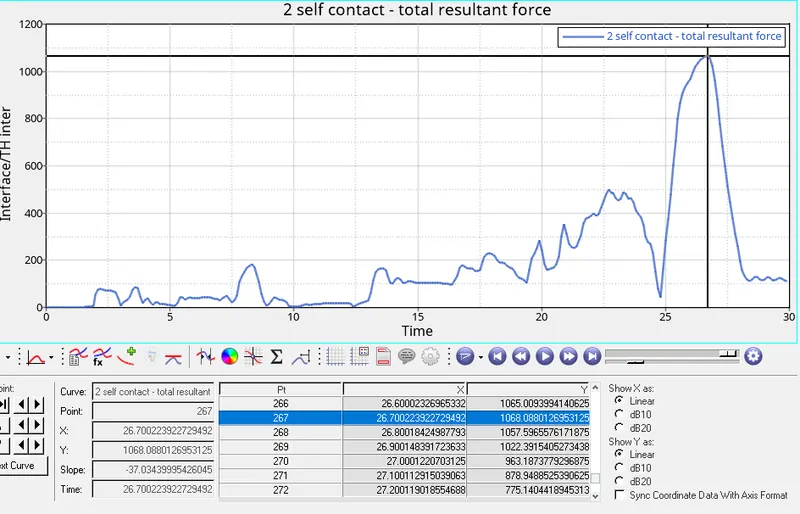
The max self contact force is 1068.08 N, which occurs at the end of the simulation, when the crush tube is completely deformed and maximum number of master and slave segments are in contact with each other.
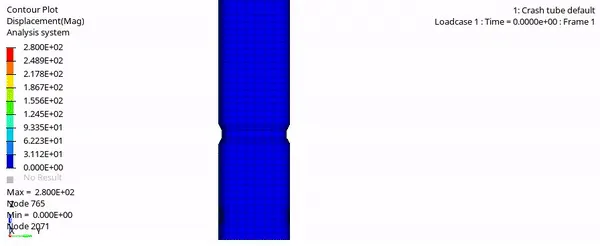
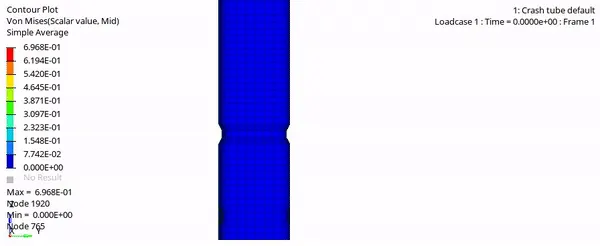
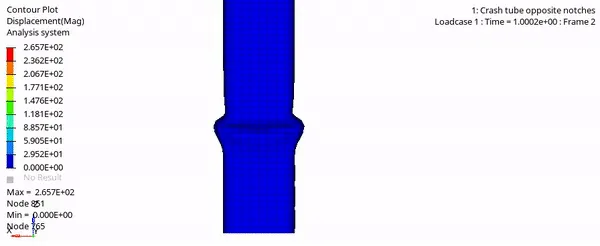
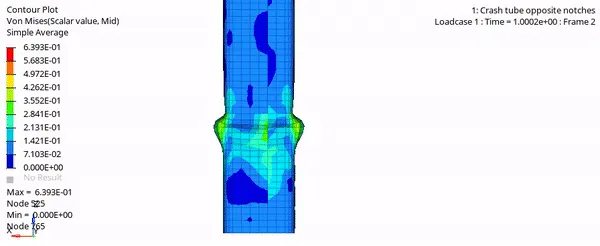
This behaviour can also be visualized in the displacement and stress animations shown below.
Displacement, von mises stress and contact forces
The values of the displacement, von mises stress and the contact forces can be visualized in the animations below.
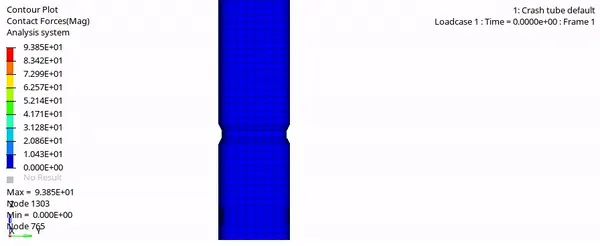
Case 2: Crush tube - Type 7 - INACTI 6
The parameters of the Type 7 contact are changed to recommended values as shown below.
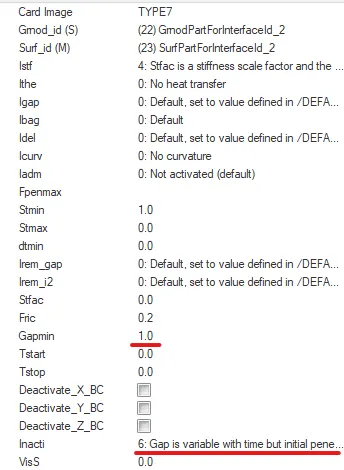
The INACTI - which defines the method for resolving initial penetrations has been set to 6, where the gap definition varies with time. The Gapmin value is set to 1.0.
The model is simulated using the RADIOSS solver and the results are discussed below.
Results
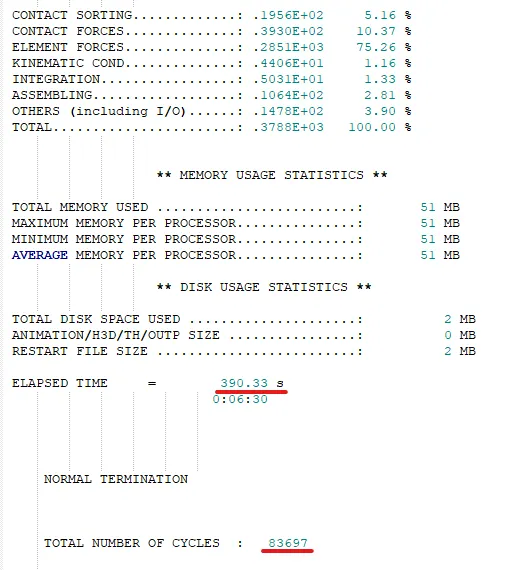
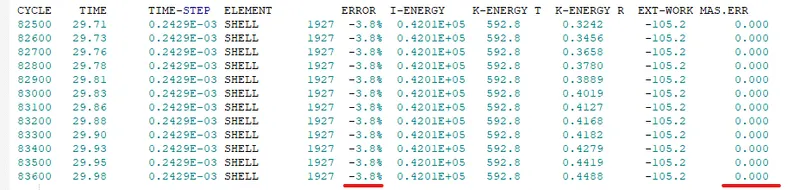
The important results of the simulation run, such as number of cycles, simulation time, mass and energy errors, can be viewed in the 0001.out file, as shown below.
Energy Plot
The internal, kinetic, hourglass and the total energies can be plotted using the TO1 file in Hypergraph 2D, as shown below.
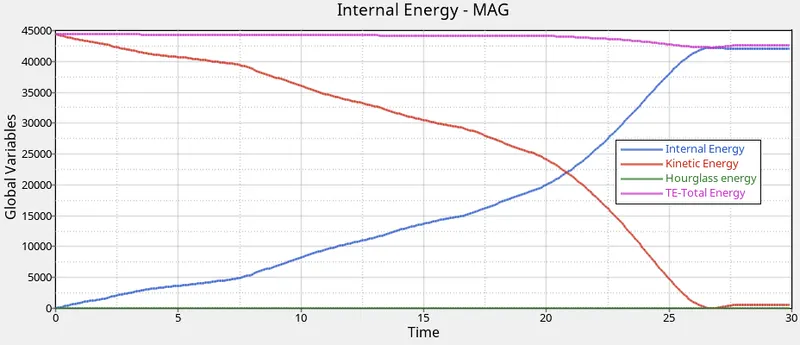
The internal energy, which is representative of the energy absorbed, increases with time, as the tube makes contact with the rigid wall. We can observe a small peak and a drop off at around 27 seconds, which is the time when the tube is completely crushed and no more energy can be absorbed by the system.
The hourglass energy is zero, since the QEPH 24 element formulation has integrated hourglass control.
Internal and Contact energies
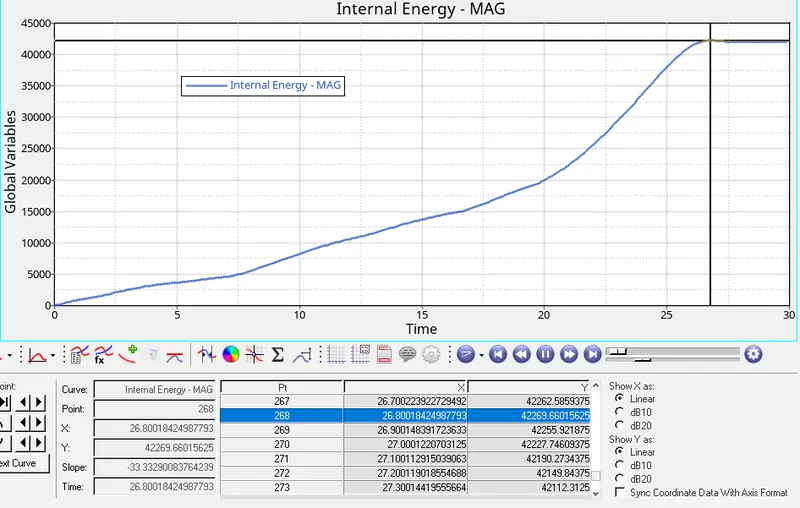
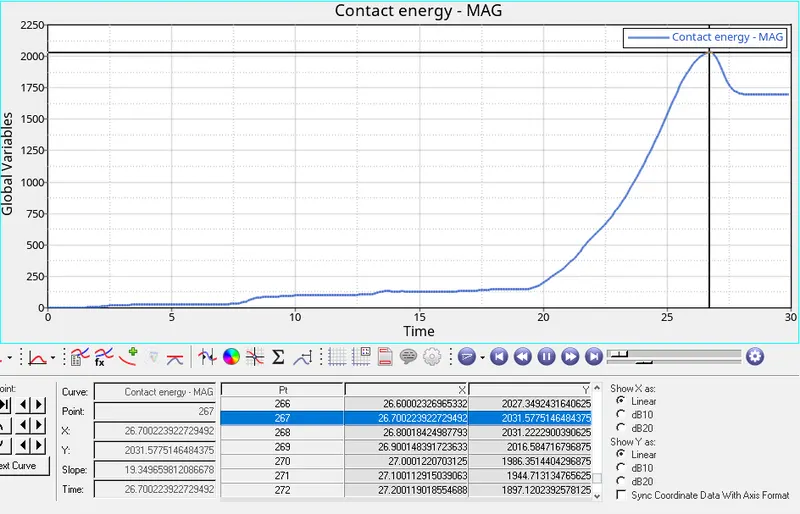
The plots below show the maximum values of the internal and the contact energies.
The max internal energy is 42269.66
The max contact energy is 2031.57
RIGID WALL FORCE
The force on the rigid wall due to the impact, over the course of the simulation is shown in the figure below.
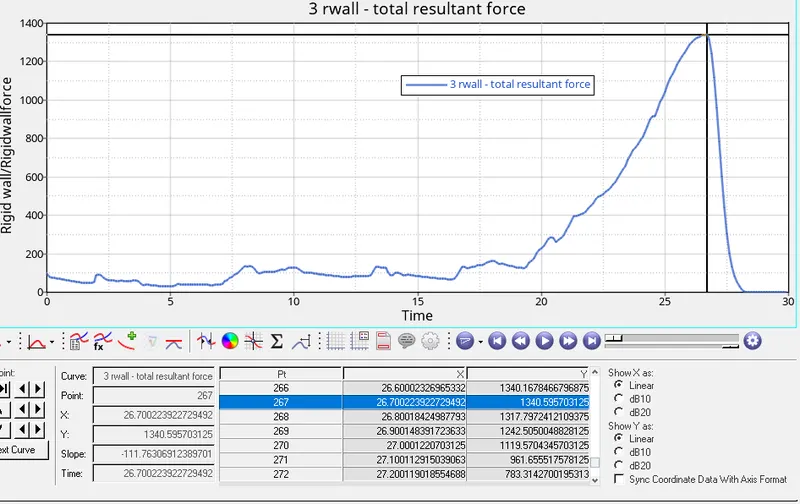
The max force is 1340.59 N, which coincides with the point at which the the internal energy peak is achieved. This represents the point in the simulation, at which the crush tube is completely deformed, and the rigid wall has to react the forces due to the impact motion of the rigid body.
The value of the force drops rapidly thereafter, since the entire crush tube bounces away after the impact and loses contact with the rigid wall.
SELF CONTACT FORCE
The self contact force from the TH inter card helps identify the forces due to the Type 7 contact formulation.
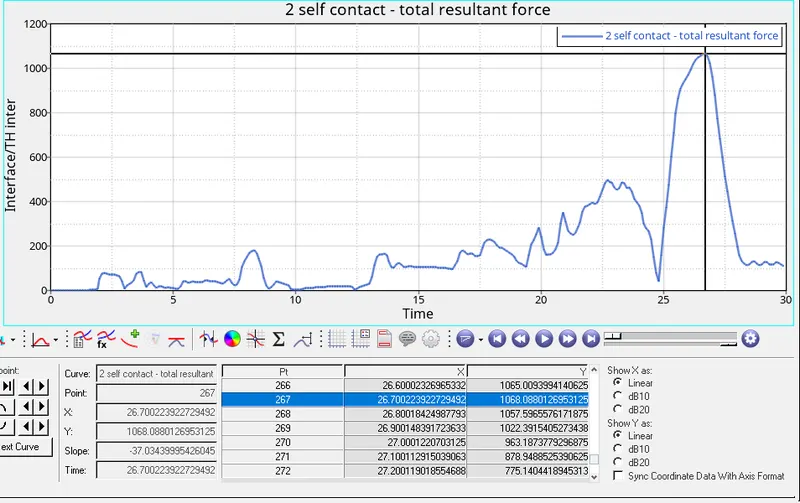
The max self contact force is 1068.08 N, which occurs at the end of the simulation, when the crush tube is completely deformed and maximum number of master and slave segments are in contact with each other.
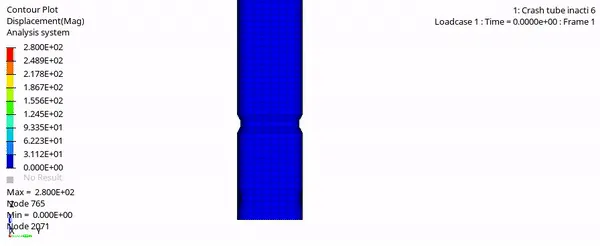
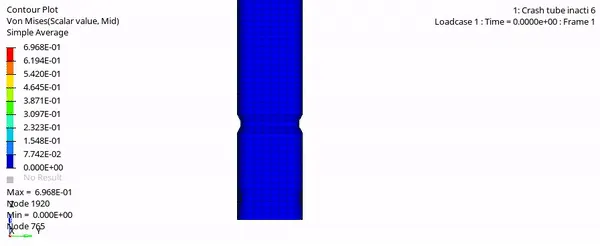
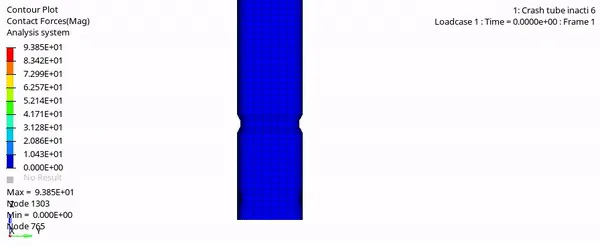
This behaviour can also be visualized in the displacement and stress animations shown below.
Displacement, von mises stress and contact forces
The values of the displacement, von mises stress and the contact forces can be visualized in the animations below.
Case 3: Crush tube - Type 11
The contact is now defined using a Type 11 contact card with recommended parameters as shown below.
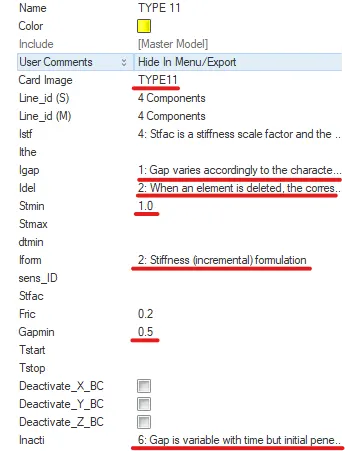
The Type 11 card uses a edge - edge contact and since it is being used here to define a self contact, the same 4 components have been selected for the master and slave Line IDs.
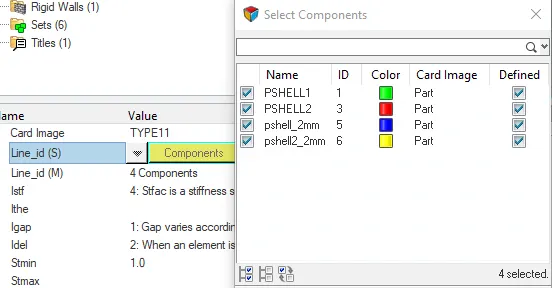
The model is simulated using the RADIOSS solver and the results are discussed below.
Results
The important results of the simulation run, such as number of cycles, simulation time, mass and energy errors, can be viewed in the 0001.out file, as shown below.
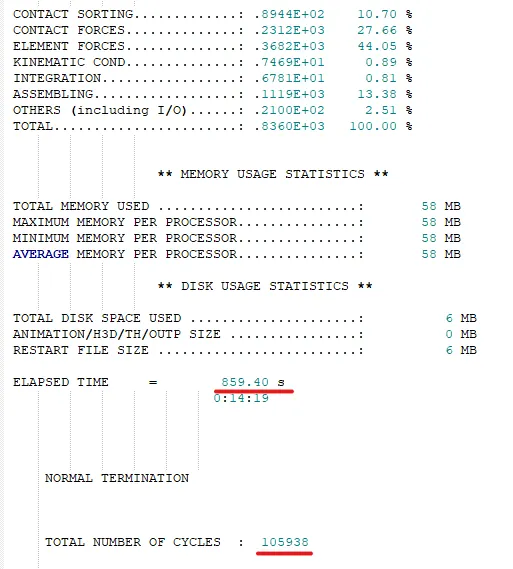
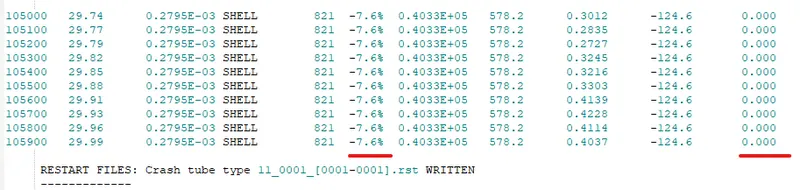
Energy Plot
The internal, kinetic, hourglass and the total energies can be plotted using the TO1 file in Hypergraph 2D, as shown below.
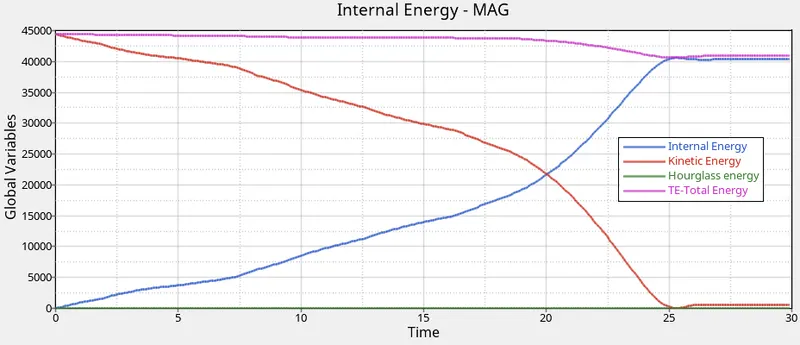
The internal energy, which is representative of the energy absorbed, increases with time, as the tube makes contact with the rigid wall. We can observe a small peak and a drop off at around 27 seconds, which is the time when the tube is completely crushed and no more energy can be absorbed by the system.
The hourglass energy is zero, since the QEPH 24 element formulation has integrated hourglass control.
Internal and Contact energies
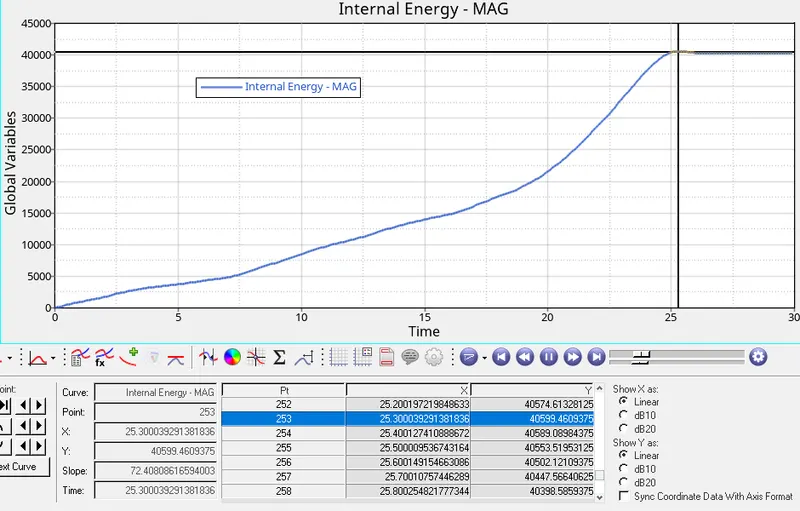
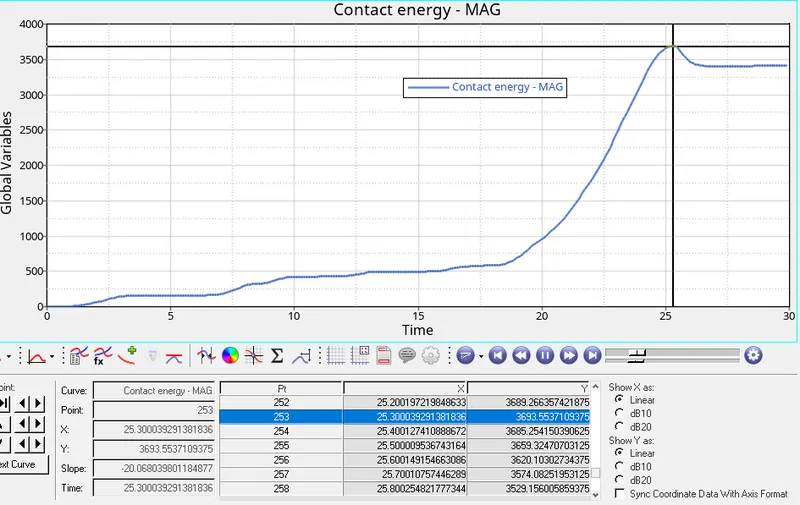
The plots below show the maximum values of the internal and the contact energies.
The max internal energy is 40599.46
The max contact energy is 3693.55
RIGID WALL FORCE
The force on the rigid wall due to the impact, over the course of the simulation is shown in the figure below.
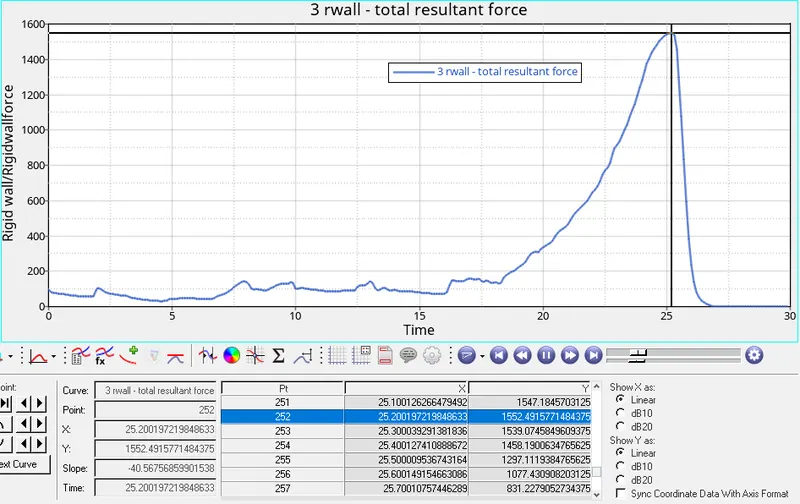
The max force is 1552.49 N, which coincides with the point at which the the internal energy peak is achieved. This represents the point in the simulation, at which the crush tube is completely deformed, and the rigid wall has to react the forces due to the impact motion of the rigid body.
The value of the force drops rapidly thereafter, since the entire crush tube bounces away after the impact and loses contact with the rigid wall.
SELF CONTACT FORCE
The self contact force from the TH inter card helps identify the forces due to the Type 11 contact formulation.
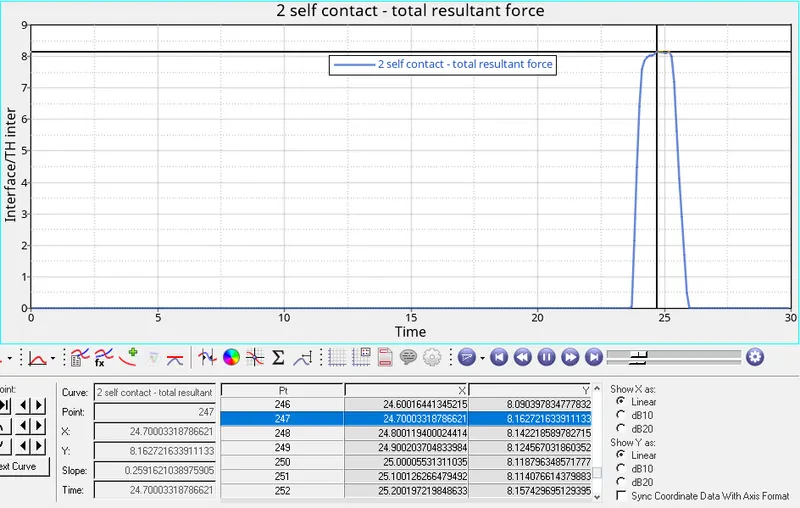
The max self contact force is 8.16 N, which occurs at the end of the simulation, when the crush tube is completely deformed and maximum number of master and slave segments are in contact with each other.
It can be observed, that the self contact energy is zero for most of the simulation until the end, since the contact now defined is an edge-edge contact, which is activated only when edges of the same component come in contact with each other.
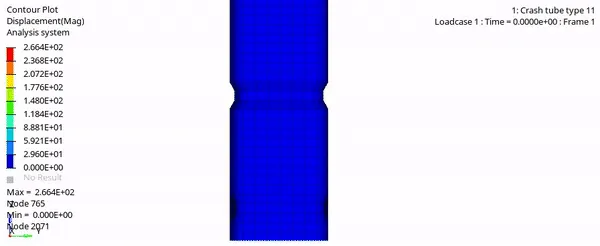
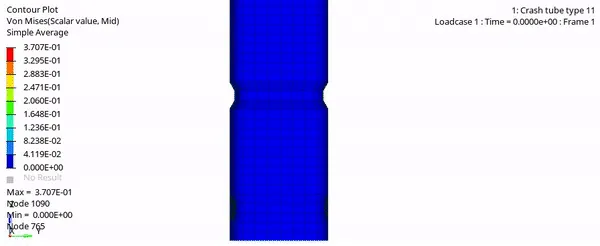
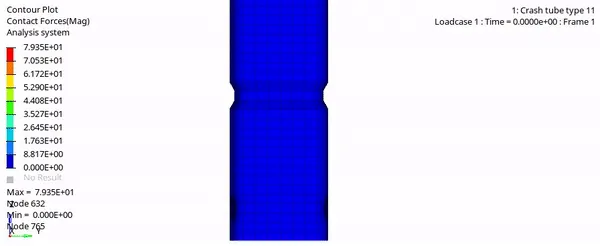
This behaviour can also be visualized in the displacement and stress animations shown below.
Displacement, von mises stress and contact forces
The values of the displacement, von mises stress and the contact forces can be visualized in the animations below.
Case 4: Removal of notches
The two notches at the lower portion of the model are removed and the boundary conditions are removed, so that all the degrees of freedom are enabled.
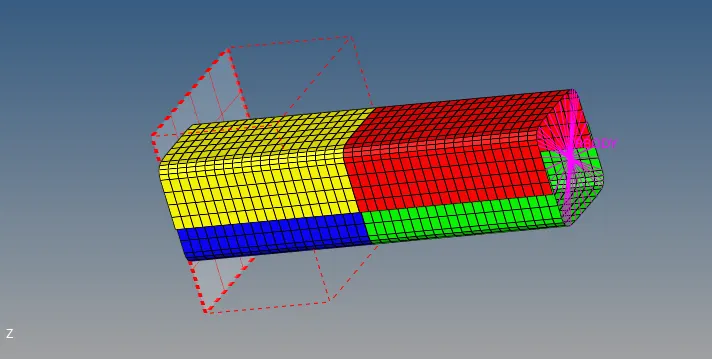
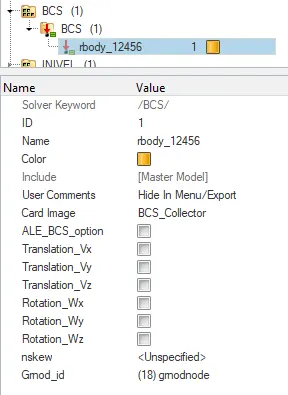
The model is simulated using the RADIOSS solver and the results are discussed below.
Results
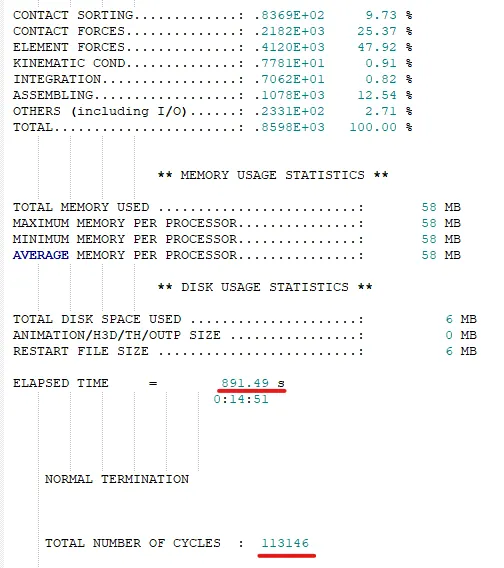
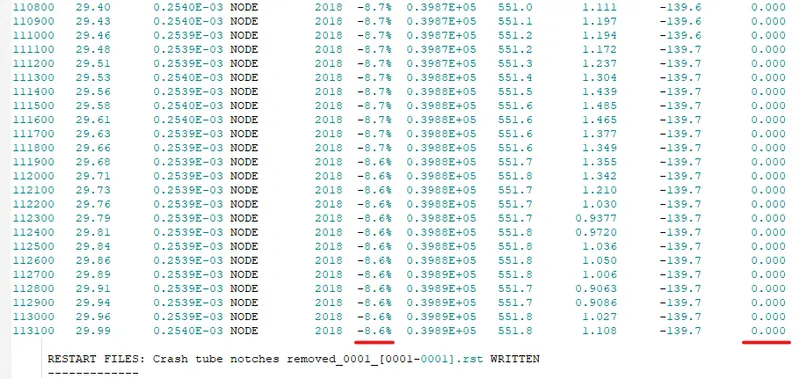
The important results of the simulation run, such as number of cycles, simulation time, mass and energy errors, can be viewed in the 0001.out file, as shown below.
Energy Plot
The internal, kinetic, hourglass and the total energies can be plotted using the TO1 file in Hypergraph 2D, as shown below.
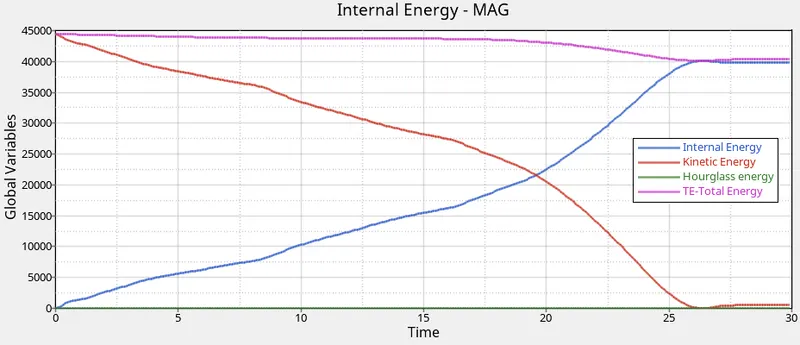
The internal energy, which is representative of the energy absorbed, increases with time, as the tube makes contact with the rigid wall. We can observe a small peak and a drop off at around 27 seconds, which is the time when the tube is completely crushed and no more energy can be absorbed by the system.
The hourglass energy is zero, since the QEPH 24 element formulation has integrated hourglass control.
Internal and Contact energies
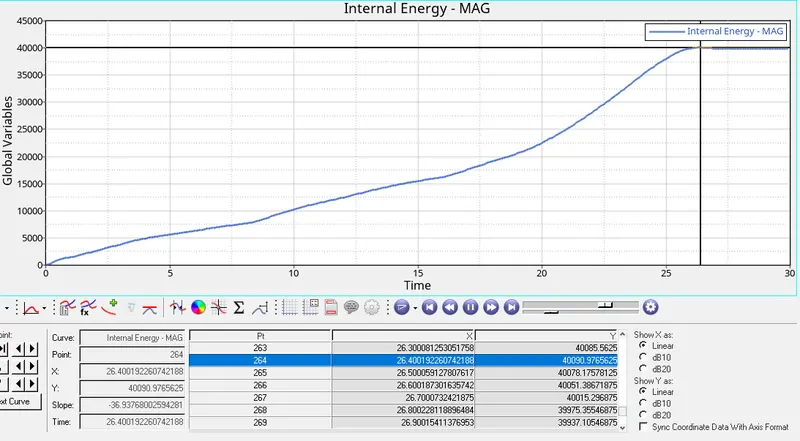
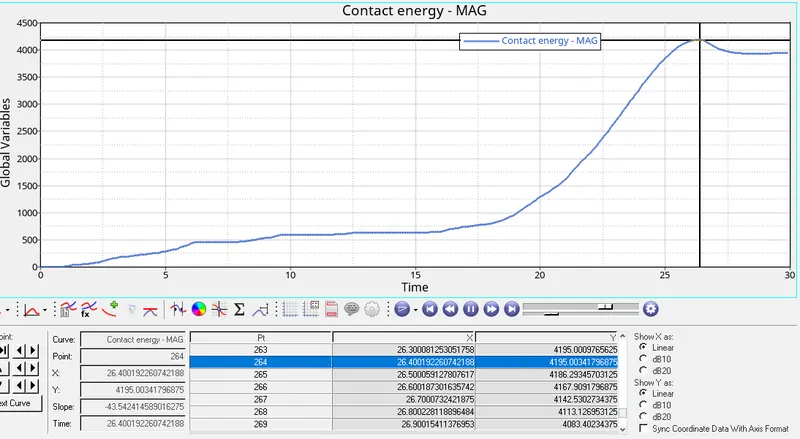
The plots below show the maximum values of the internal and the contact energies.
The max internal energy is 40090.97
The max contact energy is 4195.00
RIGID WALL FORCE
The force on the rigid wall due to the impact, over the course of the simulation is shown in the figure below.
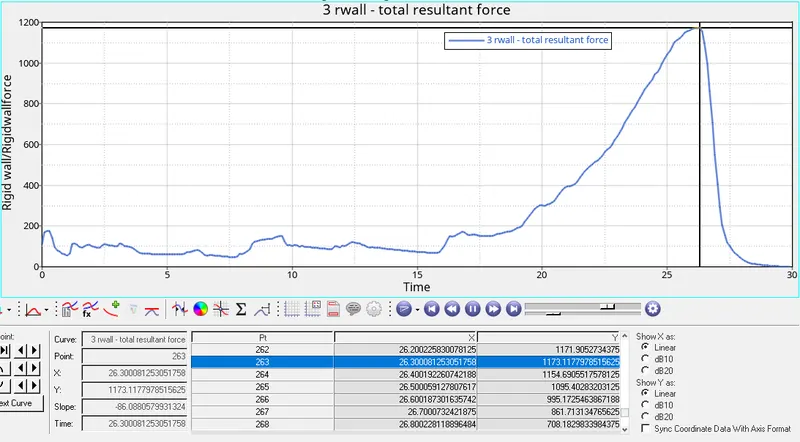
The max force is 1173.11 N, which coincides with the point at which the the internal energy peak is achieved. This represents the point in the simulation, at which the crush tube is completely deformed, and the rigid wall has to react the forces due to the impact motion of the rigid body.
The value of the force drops rapidly thereafter, since the entire crush tube bounces away after the impact and loses contact with the rigid wall.
SELF CONTACT FORCE
The self contact force from the TH inter card helps identify the forces due to the Type 11 contact formulation.
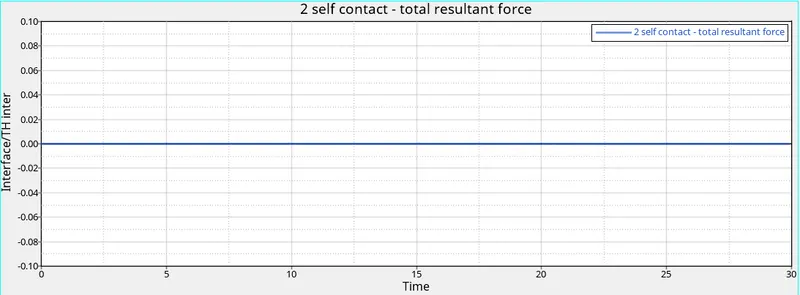
The self contact force is zero, throughout the simulation, since the removal of notches results in a phased deformation of the crush tube from the lower to the upper point, where none of the component edges come in contact with each other.
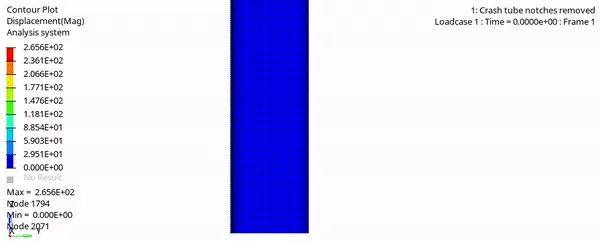
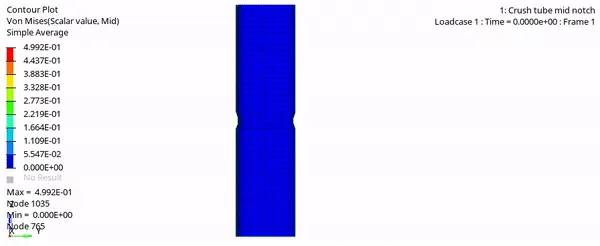
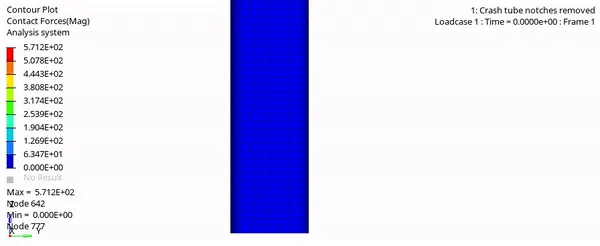
This behaviour can also be visualized in the displacement and stress animations shown below.
Displacement, von mises stress and contact forces
The values of the displacement, von mises stress and the contact forces can be visualized in the animations below.
Case 5: MID NOTCH
From the above model used in CASE 4, a notch is created in the middle of the tube using Project tool in Hypermesh.
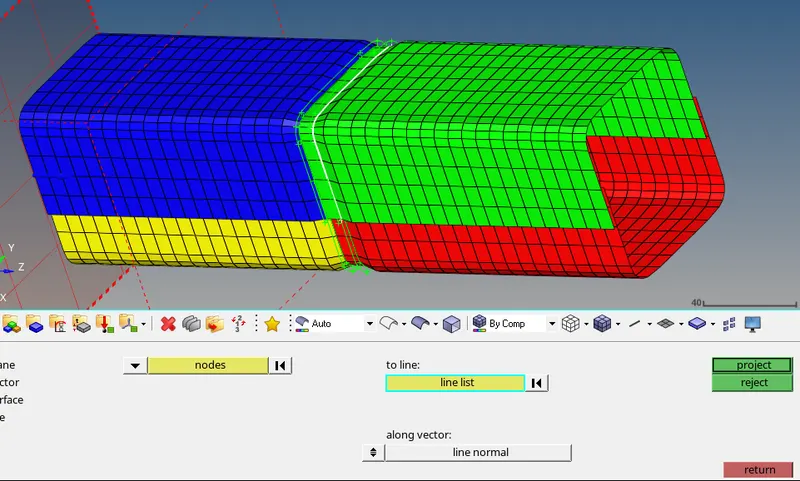
The depth of the notch created is 3.5 mm.
The model is simulated using the RADIOSS solver and the results are discussed below.
Results
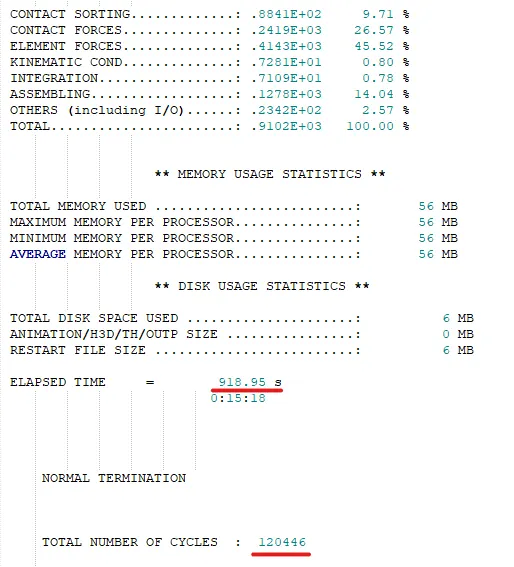
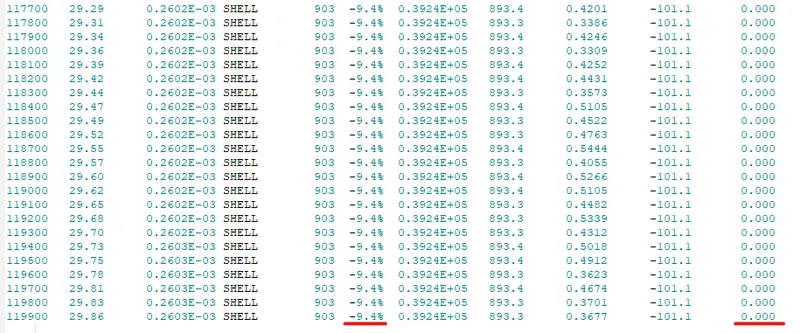
The important results of the simulation run, such as number of cycles, simulation time, mass and energy errors, can be viewed in the 0001.out file, as shown below.
Energy Plot
The internal, kinetic, hourglass and the total energies can be plotted using the TO1 file in Hypergraph 2D, as shown below.
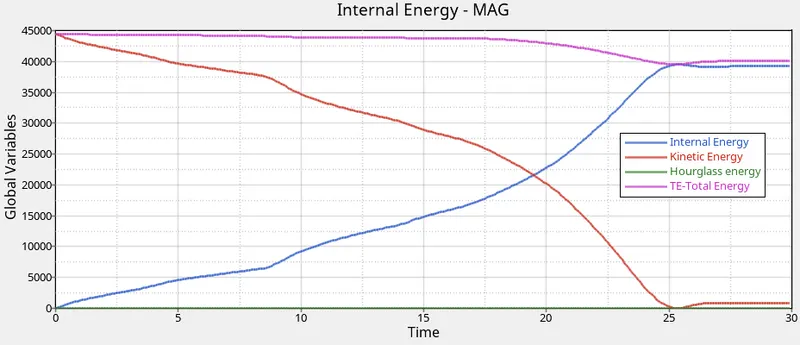
The internal energy, which is representative of the energy absorbed, increases with time, as the tube makes contact with the rigid wall. We can observe a small peak and a drop off at around 27 seconds, which is the time when the tube is completely crushed and no more energy can be absorbed by the system.
The hourglass energy is zero, since the QEPH 24 element formulation has integrated hourglass control.
Internal and Contact energies
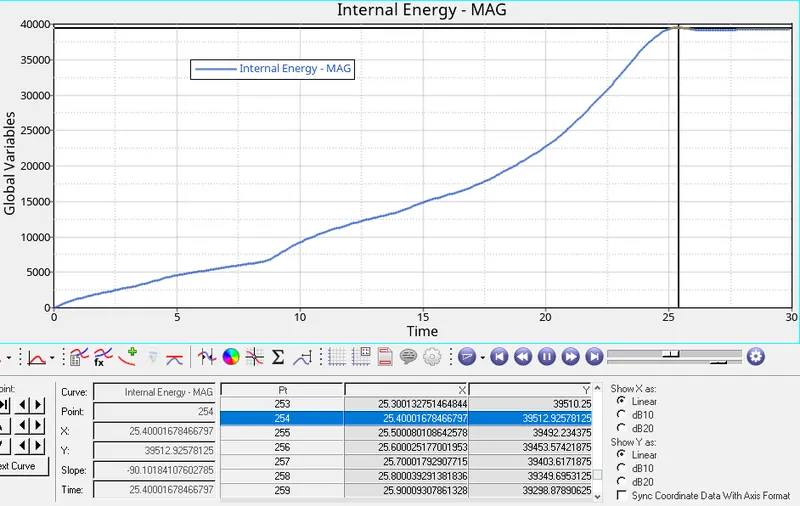
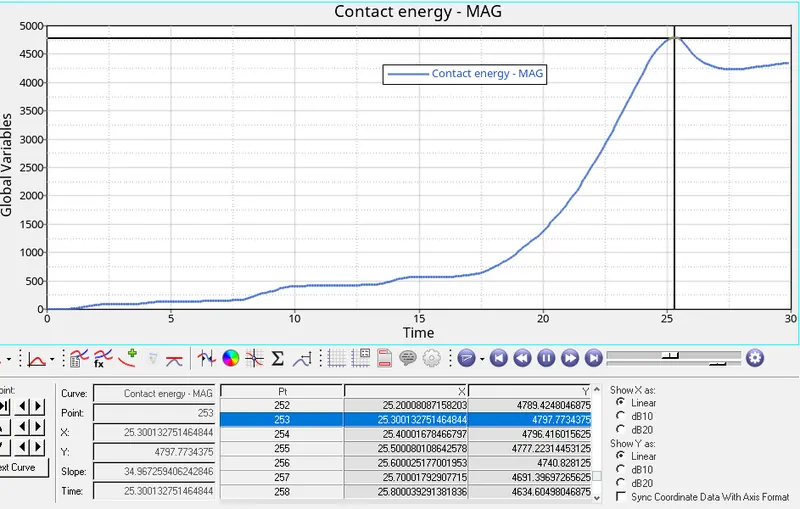
The plots below show the maximum values of the internal and the contact energies.
The max internal energy is 39512.92
The max contact energy is 4797.77
RIGID WALL FORCE
The force on the rigid wall due to the impact, over the course of the simulation is shown in the figure below.
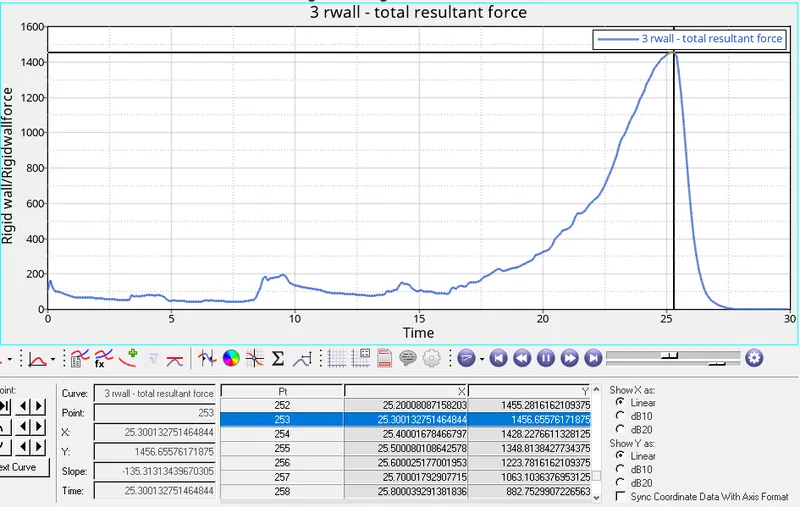
The max force is 1456.65 N, which coincides with the point at which the the internal energy peak is achieved. This represents the point in the simulation, at which the crush tube is completely deformed, and the rigid wall has to react the forces due to the impact motion of the rigid body.
The value of the force drops rapidly thereafter, since the entire crush tube bounces away after the impact and loses contact with the rigid wall.
SELF CONTACT FORCE
The self contact force from the TH inter card helps identify the forces due to the Type 11 contact formulation.
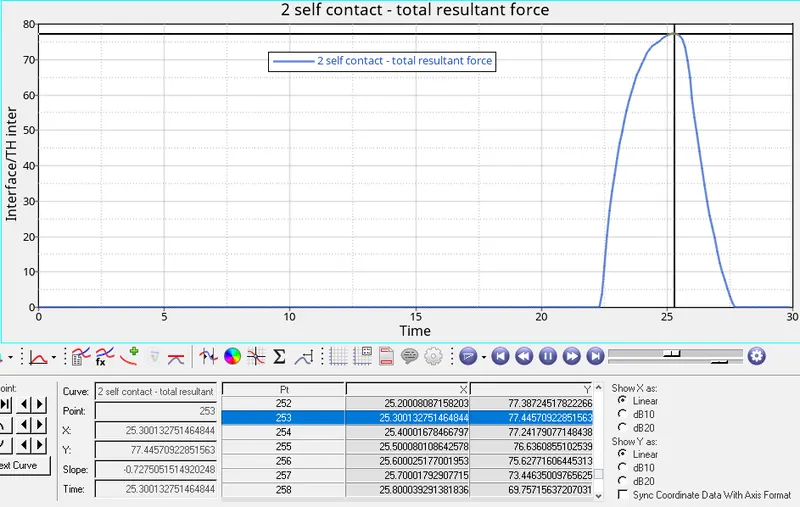
The max self contact force is 77.44 N, which occurs at the end of the simulation, when the crush tube is completely deformed and maximum number of master and slave segments are in contact with each other.
It can be observed, that the self contact energy is zero for most of the simulation until the end, since the contact now defined is an edge-edge contact, which is activated only when edges of the same component come in contact with each other.
This behaviour can also be visualized in the displacement and stress animations shown below.
Displacement, von mises stress and contact forces
The values of the displacement, von mises stress and the contact forces can be visualized in the animations below.
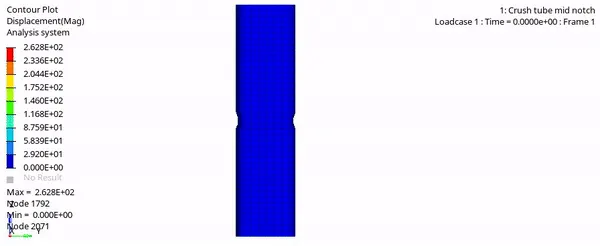
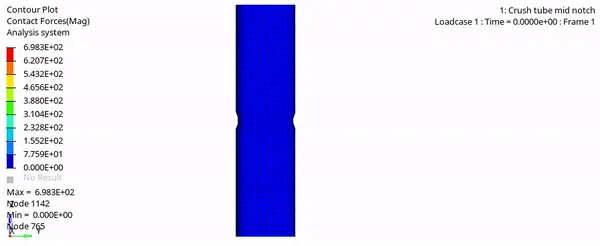
Case 6: Notches on opposite faces
Notches are created on the opposing faces at the middle of the tube using the Project tool as shown below.
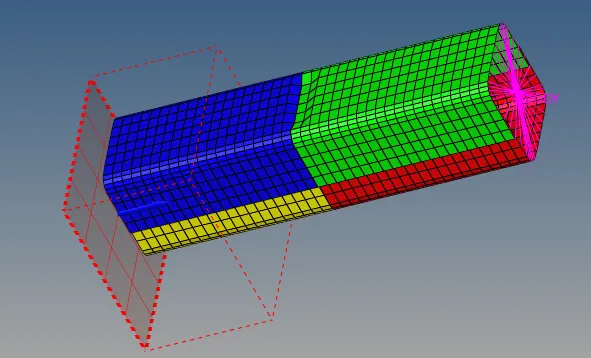
The depth of the notch created is 3.5 mm.
The model is simulated using the RADIOSS solver and the results are discussed below.
Results
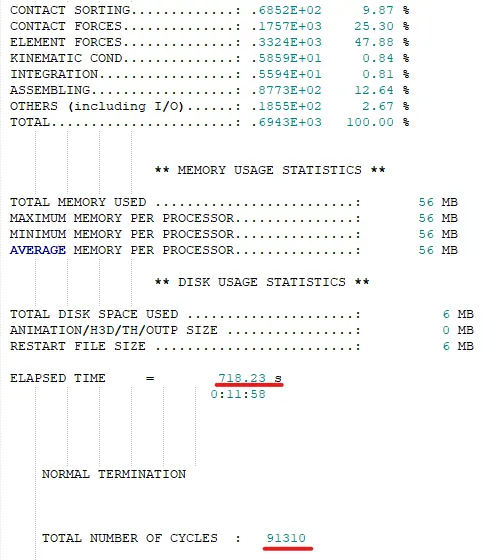
The important results of the simulation run, such as number of cycles, simulation time, mass and energy errors, can be viewed in the 0001.out file, as shown below.
Energy Plot
The internal, kinetic, hourglass and the total energies can be plotted using the TO1 file in Hypergraph 2D, as shown below.
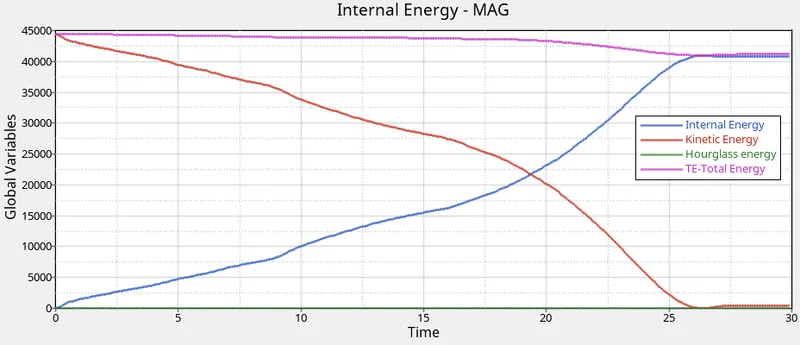
The internal energy, which is representative of the energy absorbed, increases with time, as the tube makes contact with the rigid wall. We can observe a small peak and a drop off at around 27 seconds, which is the time when the tube is completely crushed and no more energy can be absorbed by the system.
The hourglass energy is zero, since the QEPH 24 element formulation has integrated hourglass control.
Internal and Contact energies
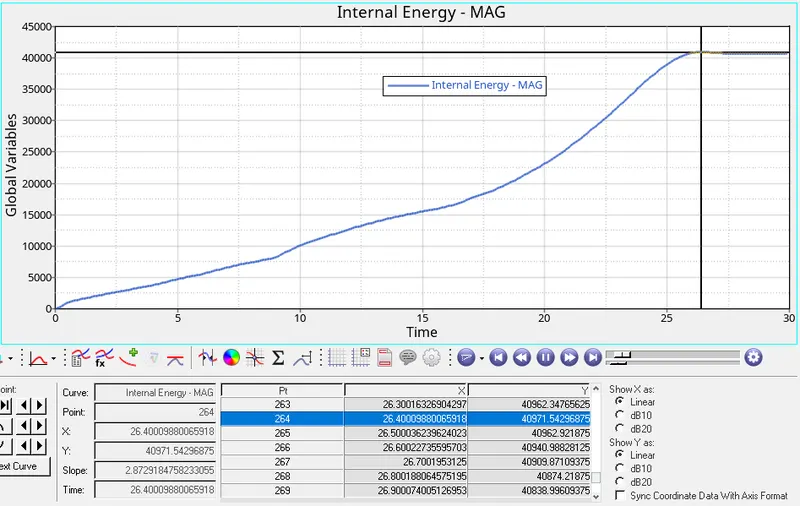
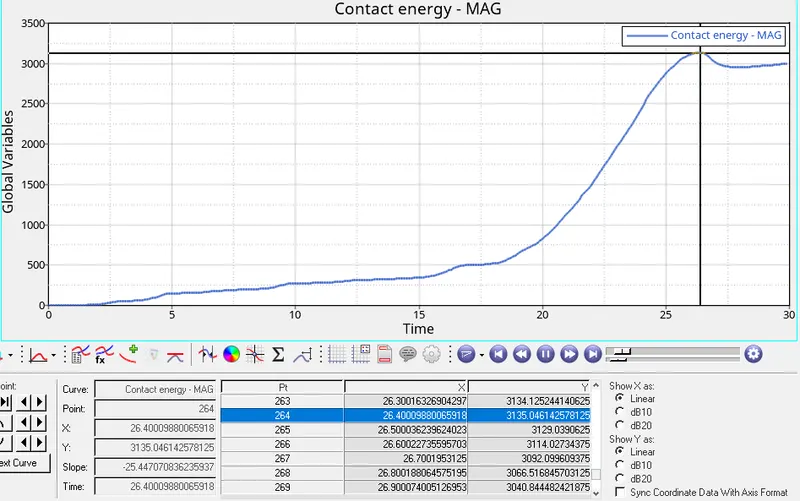
The plots below show the maximum values of the internal and the contact energies.
The max internal energy is 40971.54
The max contact energy is 3135.04
RIGID WALL FORCE
The force on the rigid wall due to the impact, over the course of the simulation is shown in the figure below.
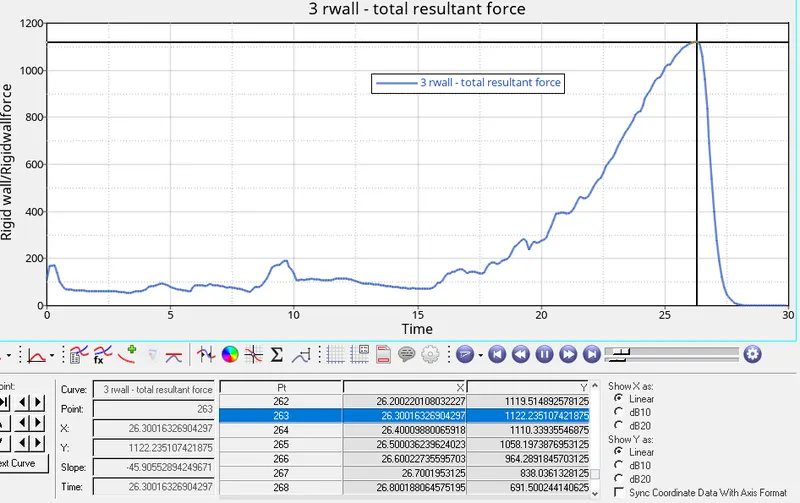
The max force is 1122.23 N, which coincides with the point at which the the internal energy peak is achieved. This represents the point in the simulation, at which the crush tube is completely deformed, and the rigid wall has to react the forces due to the impact motion of the rigid body.
The value of the force drops rapidly thereafter, since the entire crush tube bounces away after the impact and loses contact with the rigid wall.
SELF CONTACT FORCE
The self contact force from the TH inter card helps identify the forces due to the Type 11 contact formulation.
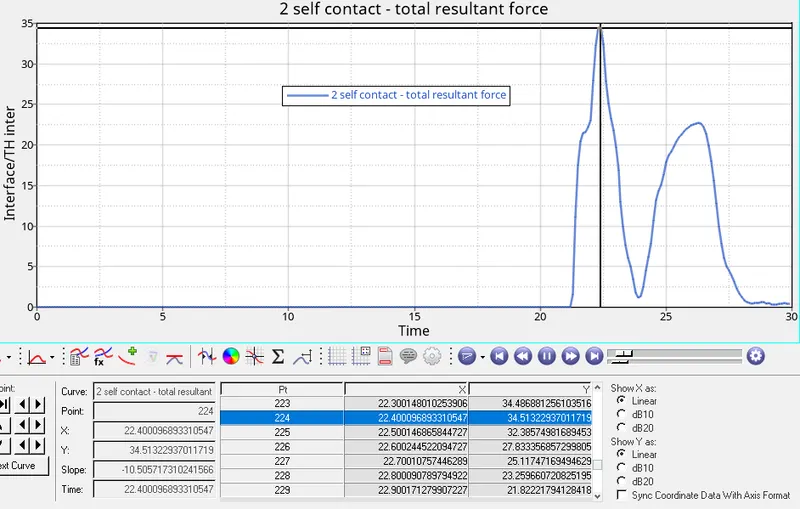
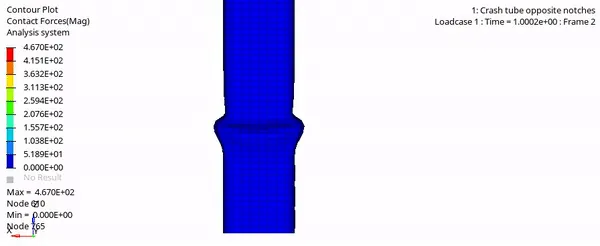
The max self contact force is 34.51 N, which occurs at the end of the simulation, when the crush tube is completely deformed and maximum number of master and slave segments are in contact with each other.
It can be observed, that the self contact energy has a peak at around 22 seconds, when most of the tube is completely deformed. We can see a secondary peak at around 26 seconds, which is due to the tube being fully compressed at this point, which leads to maximum contact of the edges of adjacent components with each other.
This behaviour can also be visualized in the displacement and stress animations shown below.
Displacement, von mises stress and contact forces
The values of the displacement, von mises stress and the contact forces can be visualized in the animations below.
Comparison of results
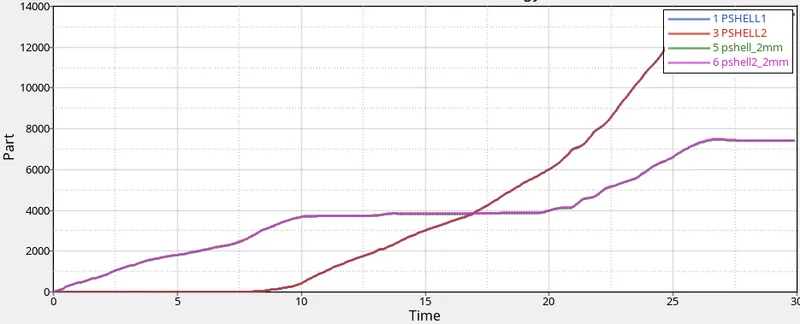
Apart from the results of each simulation illustrated above, the results obtained from the TH PART card can used to compare each case.
TH PART RESULTS
Case 1: Type 7 - default - INACTI - 0
Case 2: Type 7 - INACTI - 6
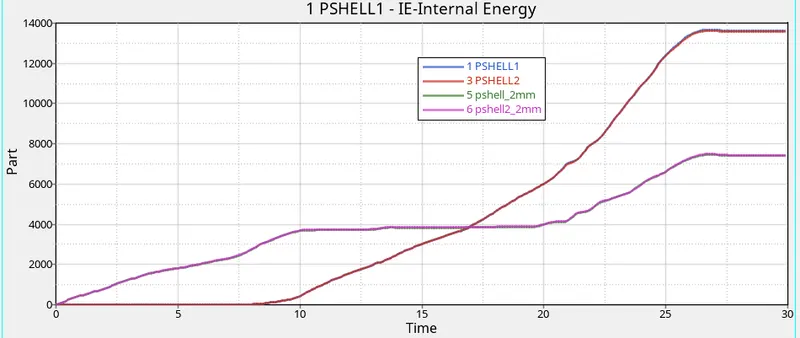
In both Case 1 and Case 2, where the type 7 node - surface contact has been used, the internal energy plots of the 4 parts look identical. The upper shell elements which have a thickness of 3 mm absorb more energy than the lower shell elements, since the lower shell elements are deformed earlier in the initial part of the simulation.
The internal energy of the 2 mm shell elements remains constant after 10 seconds, when the lower part of the tube has been almost completely deformed and it increases slightly at the end, due to the upper shell elements coming into contact with them and compressing them at the end of the simulation.
The max energy of the PSHELL 3 mm elements is approximately 13500 and that of the PSHELL 2 mm elements is approximately 7500.
Case 3: Type 11
Case 4: Notches removed
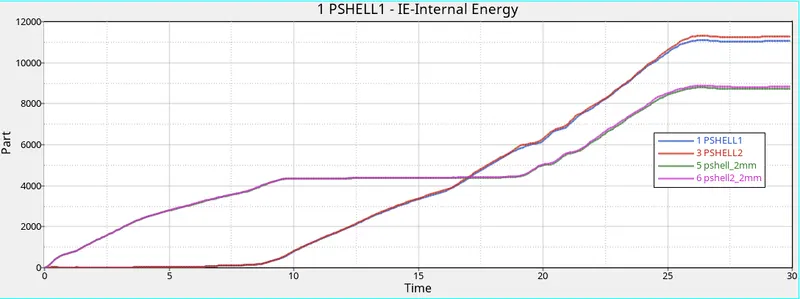
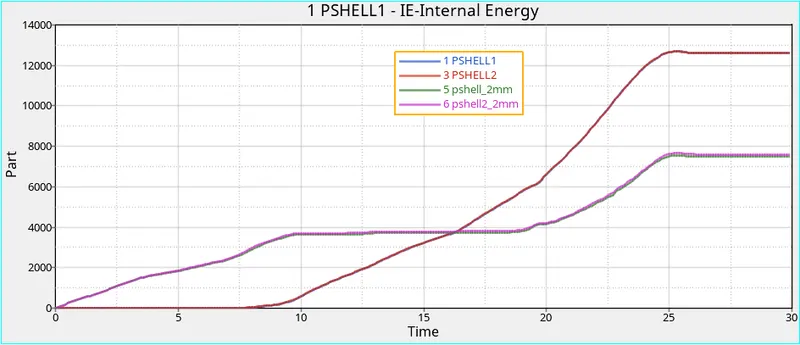
On comparing case 3 and case 4, where the type 11 contact has been used, we see that the behaviour remains similar to cases one and two, but the maximum values of the energy have increased for both the elements.
The max energy of the PSHELL 3 mm elements is approximately 11000 and that of the PSHELL 2 mm elements is approximately 9000.
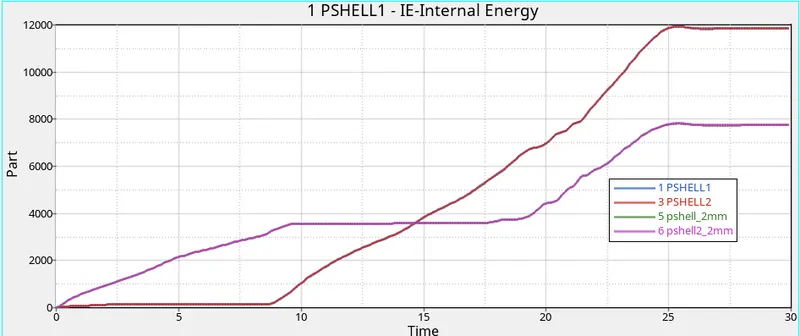
Case 5: Mid notch
Case 6: Opposing notch
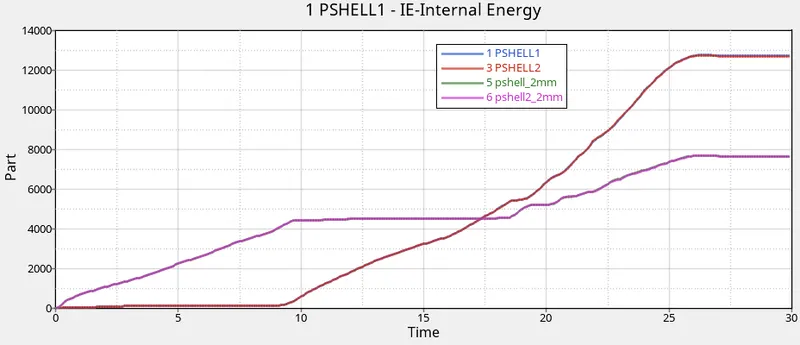
On comparing case 5 and 6, where a notch is present in the middle of the tube, we see that the internal energy of the PSHELL 2 mm elements is non zero, right from the beginning of the simulation, which is also observed from the deformation behaviour.
The max energy of the PSHELL 3 mm elements is approximately 13000 and that of the PSHELL 2 mm elements is approximately 7800.
Apart from the above comparison, the key values of all the 6 simulations are summarized in the table below
|
CASE |
Number of cycles |
Simulation Time (sec) |
Final Energy error (%) |
Final Mass error (%) |
Max displacement (mm) |
Max von mises stress (kg/mm.ms^2) |
Max internal energy (kg.mm^2/ms^2) |
Max contact force (kg.mm)/ms^2 |
|
1 |
83697 |
415.64 |
-3.8 |
0.00 |
280 |
.696 |
42269.66 |
93.85 |
|
2 |
83697 | 390.33 | -3.8 |
0.00 |
280 |
.696 |
42269.66 |
93.85 |
|
3 |
105938 | 859.40 | -7.6 |
0.00 |
266.4 | .5214 | 40599.46 | 89.28 |
|
4 |
113146 | 891.49 | -8.6 |
0.00 |
255.6 | .4992 | 40090.97 | 57.12 |
|
5 |
120446 | 918.95 | -9.4 |
0.00 |
262.8 | .4992 |
39512.92 |
69.83 |
|
6 |
91310 | 718.23 | -6.6 |
0.00 |
263.7 | .6393 |
40971.54 |
46.70 |
Conclusion
The comparison of the 6 test cases yielded a large degree of variation in the results, which emphasises the importance of choosing the right interface (contact) formulation, and the effect of notches in controlling the impact energy and the resulting forces.
The bumper model and the models for the six cases have been attached in the challenge box below.