ANALYSIS OF A CRUSH TUBE WITH DIFFERENT CONTACT INTERFACES AND NOTCH CREATIONS BY USING RADIOSS
AIM:
To create the mesh for bumper assembly and to study simulation of a crush tube in different cases.
OBJECTIVE:
- To create the mesh for bumper assembly, mesh size should be 6mm.
- To run the crash tube model as it is.
- To change the Inacti=6 and run.
- To create the type 11 contact and run.
- To remove both notches and remove boundary conditions on a rigid body node then run.
- To create a new notch in the middle, select the whole section and run.
- To create a new notch with nodes only from opposing 2 faces and run.
SOFTWARE USED: HYPERMESH (Radioss).
KEYWORDS: Internal energy, Kinetic energy, Contact forces, Von Mises stress.
THEORY:
PENALTY METHOD:
The penalty method treats the behavior between the slave node and master segments as springs that generate resistive force as a function of penetration.
Spring elements are created between the slave node and its projection. The spring stiffness is automatically computed according to the material and property of both the master segment and the slave node.
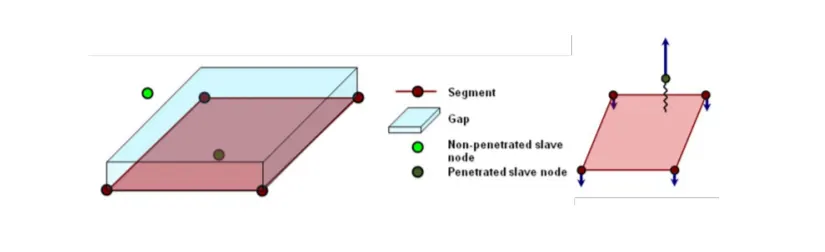
Interface Type 7: Nodes to Surface Contact
- Automatic node to surface contact interface using the penalty method with variable stiffness
- A gap is defined around the master segment and the slave nodes
- The contact gap can be constant or variable
- Resistive forces are applied to keep slave nodes out of the contact gap
- The interface time step is computed to insure stability
- Interface type 7 is a general-purpose interface and can simulate all types of impact between a set of nodes and a master surface. Contrary to interface types 3 and 5, interface type 7 is non-oriented and slave nodes can belong to the master surface. Therefore, this interface can simulate auto-impact, especially buckling during a highspeed crash. Interface type 7 solves all problems and limitations encountered with interface types 3 and 5. The search for the closest segment is done via a direct search algorithm; therefore, there are no search limitations and all possible contacts are found. The energy jumps induced by a node impacting from the shell edges are
removed by the use of a cylindrical gap around the edges.
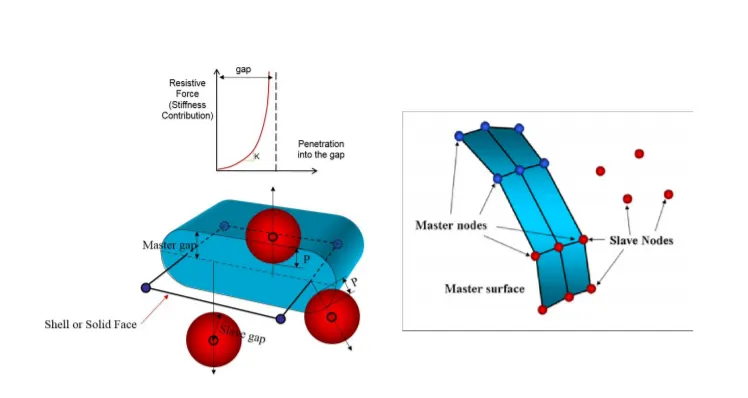
Interface Type 11: Edge to Edge Contact
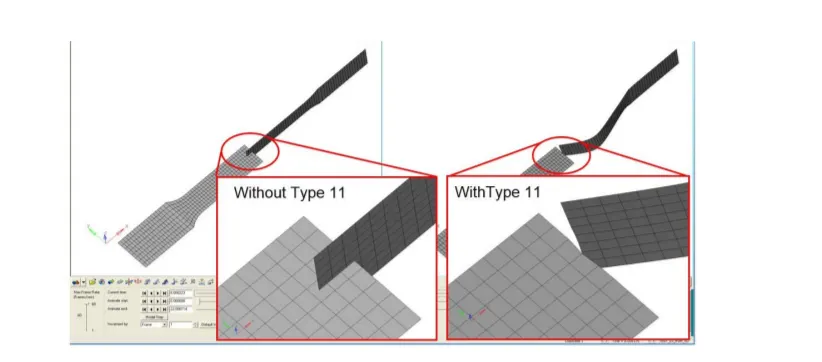
- This interface simulates the impact between edge to Edge or lines. A line can be a beam or truss element or a shell edge or spring elements. In association with interface TYPE7, interface TYPE11 solves the locking cases
- Defined by identifying master and slave lines (edges)
- Impacts occur between a master and a slave line. A slave line can impact on one or more master lines. A line can belong to the master and the slave side. This allows self-impact.
- Works similar to Type 7 in terms of Penalty formulation, Gap definition, and Search method
- Uses complicated mathematical algorithms; therefore, it is strongly advised to use it only when necessary. A huge interface TYPE11 can slow down the computation.
- Note: Create the line segments by finding the free edges for the component and creating a set for the same from Analysis>Contact Surfaces and choose card image as LineSeg.
IMPORTANT INTERFACE PARAMETERS:
Igap - Determines how the size of the gap is calculated.
Gap_min - Minimum gap for activation of the interface.
Inactiv - Action to take if initial penetration exists.
Istf - Affects how the stiffness of the interface is calculated.
Iform - Friction formulation
St_min - Minimum stiffness to use in the interface.
Idel - What do with slave nodes and master segments if an element fails(deleted) that they are attached to.
BUMPER ASSEMBLY:
STEPS TO BE FOLLOWED:
- In the first step we want to open the model into the hypermesh software by selecting the File>open>model>select file name>click open option.
- The downloaded geometry will be displayed on the screen, now save the model by using the save as option in the File menu Click File>save as>model. Now the model is opened and that is shown as below,
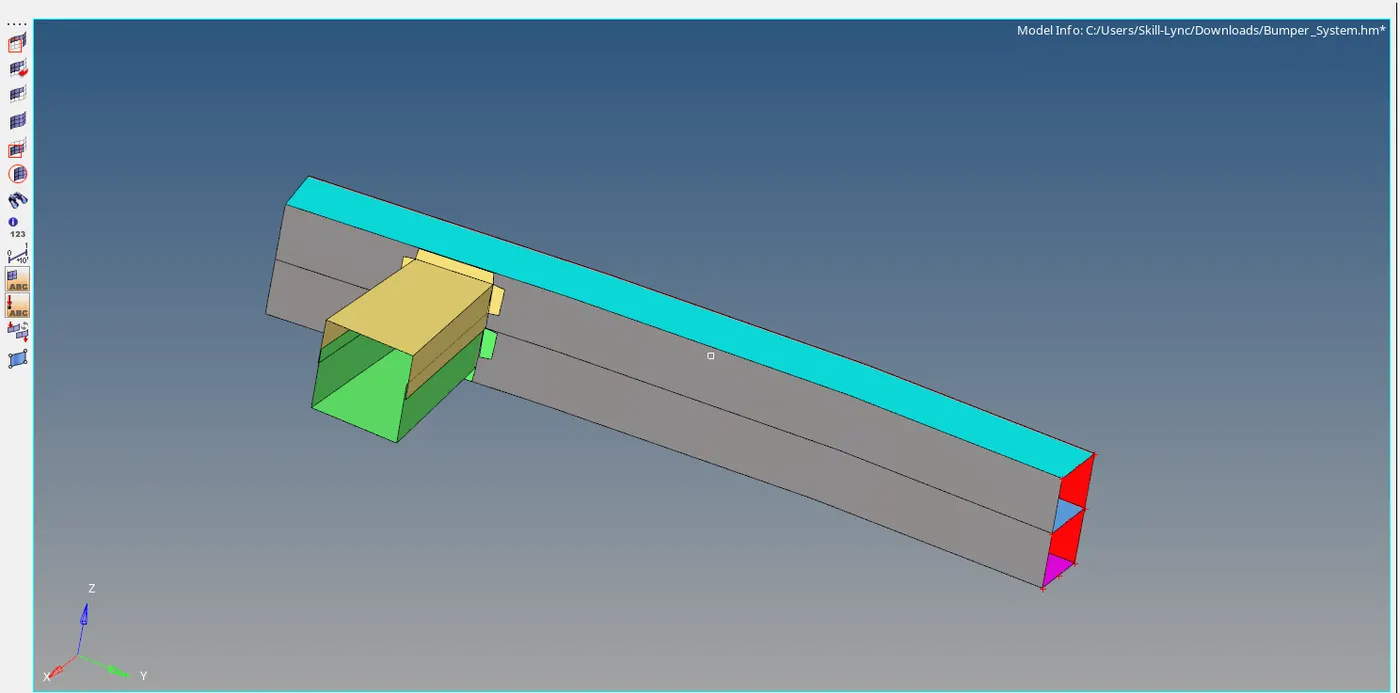
Fig: Open model
- After open the model we want to clear the geometry clean up in that model. A geometrical error will lead to a change in geometry it will also affect the mesh.
- Geometry cleanup is performed to make sure that there are no free edges, duplicate faces, or any surface void in the model and no unwanted extended surface.
- During the geometry cleanup errors are identified and rectified by using some of the tools in the hypermesh software. In this model, we identified the error that is shown below,
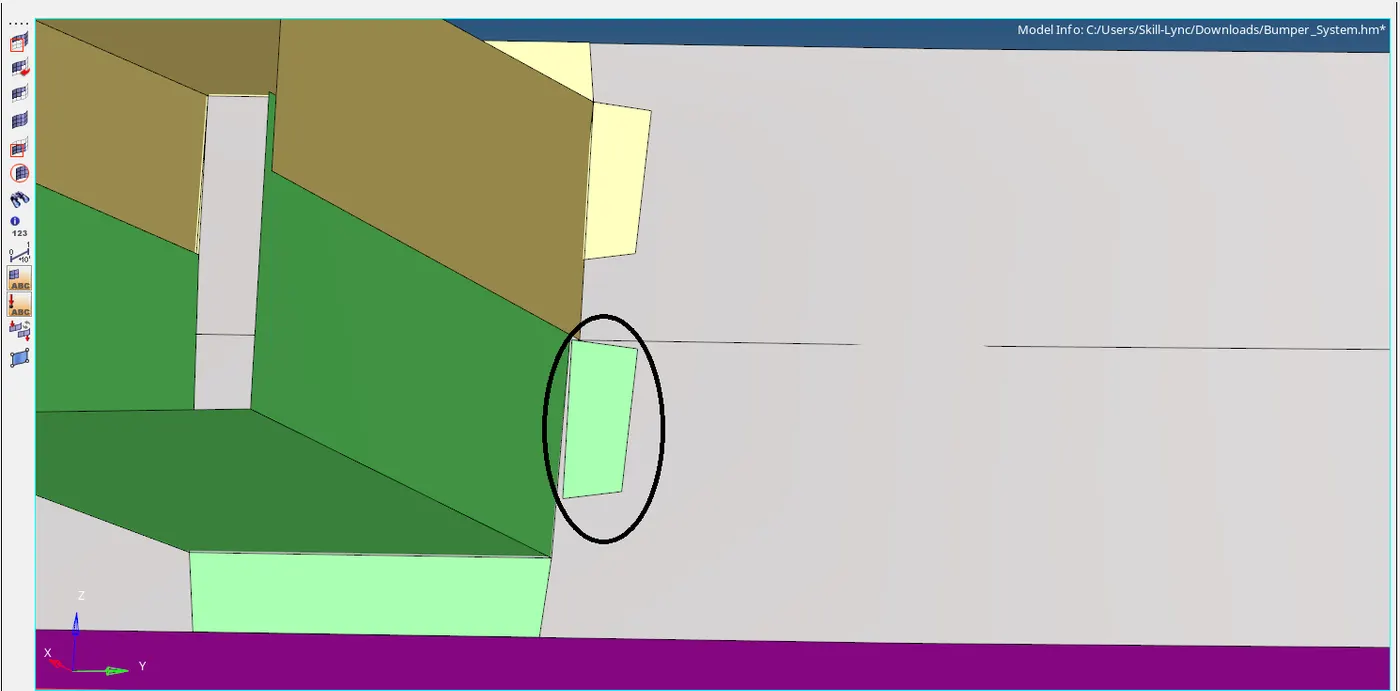
Fig: Error portion
- The above error is cleared by using the toggle option which is present under the Geo>quick edit>toggle edge the toolbar that is shown as below,

- By selecting this option and initiate that two lines to get toggle the edge now it seems clear in that edge of geometry. A cleared area in that model is shown below,
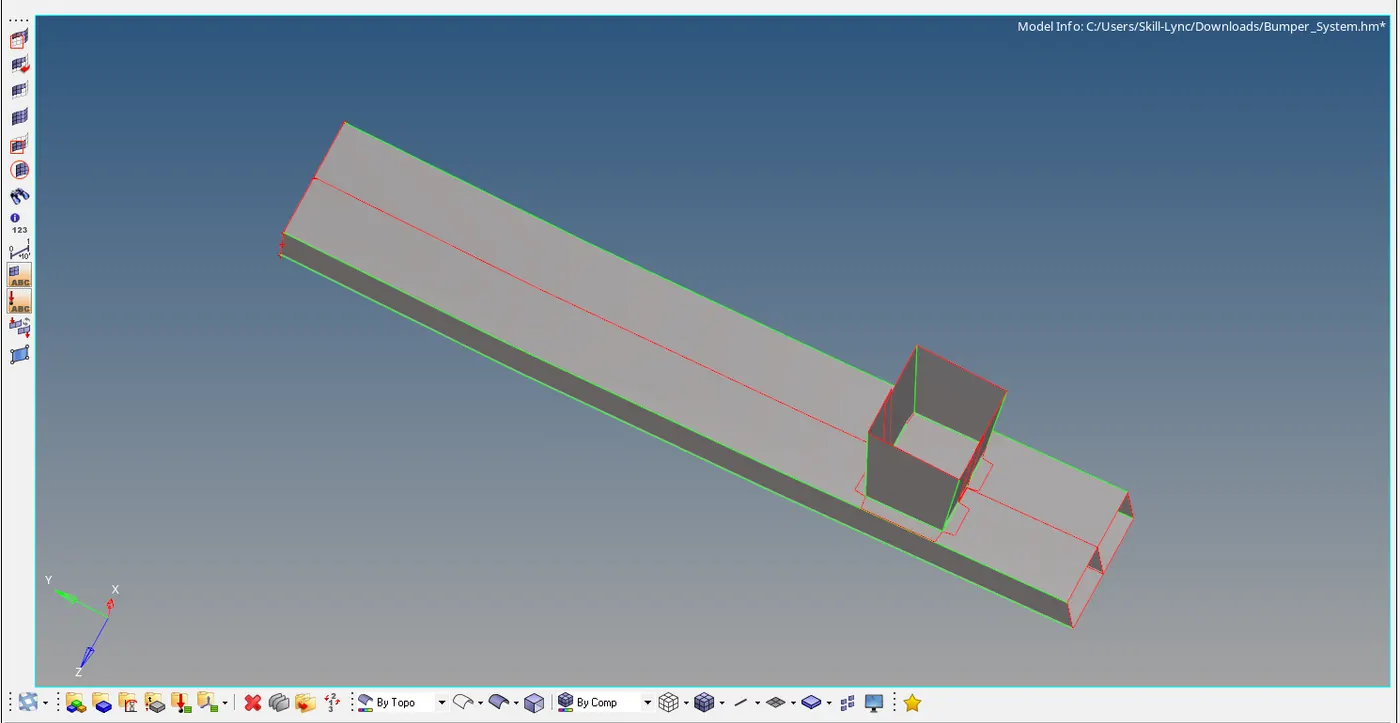
Fig: Geometry cleanup model
- Now we want to mesh the model by selecting the 2D > Automesh and select the element or face that you want to mesh on that and select the element size and give value 6mm as per the question and finally select mesh option. The mesh size is represented in the element size table that is shown below,

- A mesh will be obtained on that model by selecting the auto mesh option. The mesh flow is controlled by increasing and decreasing mesh density around edges.
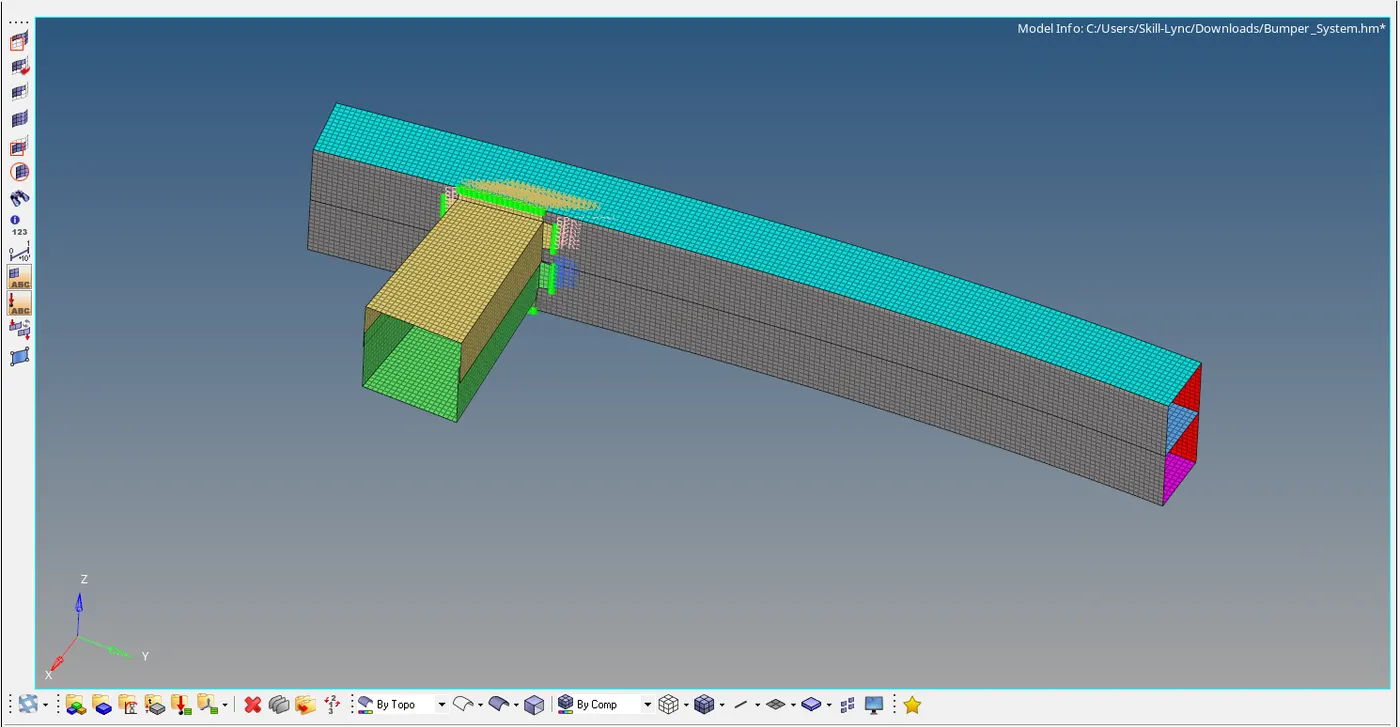
Fig: Meshed model
- The quality is cleared in this model that are shown below,
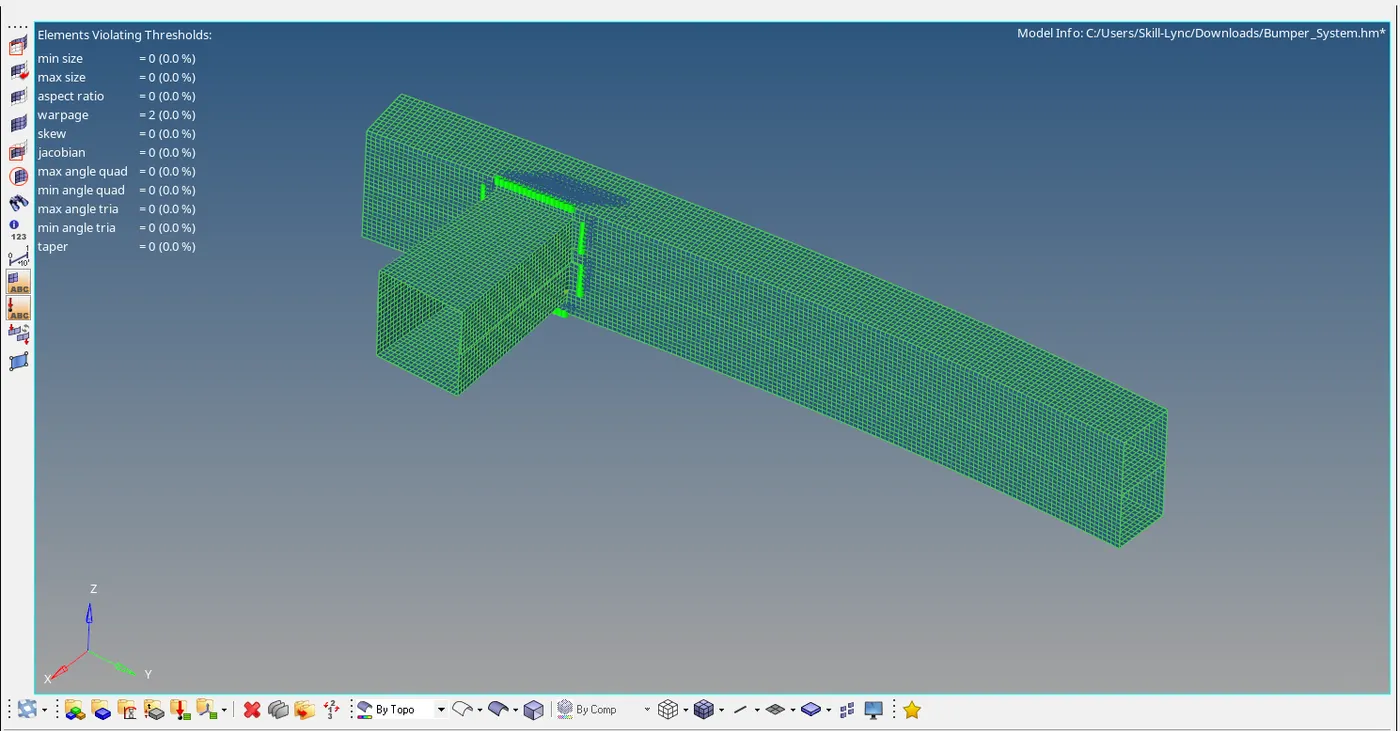
- After finished the mesh we want to weld the crash_box upper and crash_box lower in that BumperBeam_rear by selecting the 1D>connectors>>seam weld>and enter the value of spacing as 6mm >change the location by line to a node path>set tolerance as 3mm> select the line that we want to create the weld from > change the type as type2(spring single row) then click create option. The edited options for creating the seam weld table is shown below,

- Now the weld is created between the crash_box upper to BumperBeam_rear and crash_box lower to BumperBeam_rear that is shown as below,
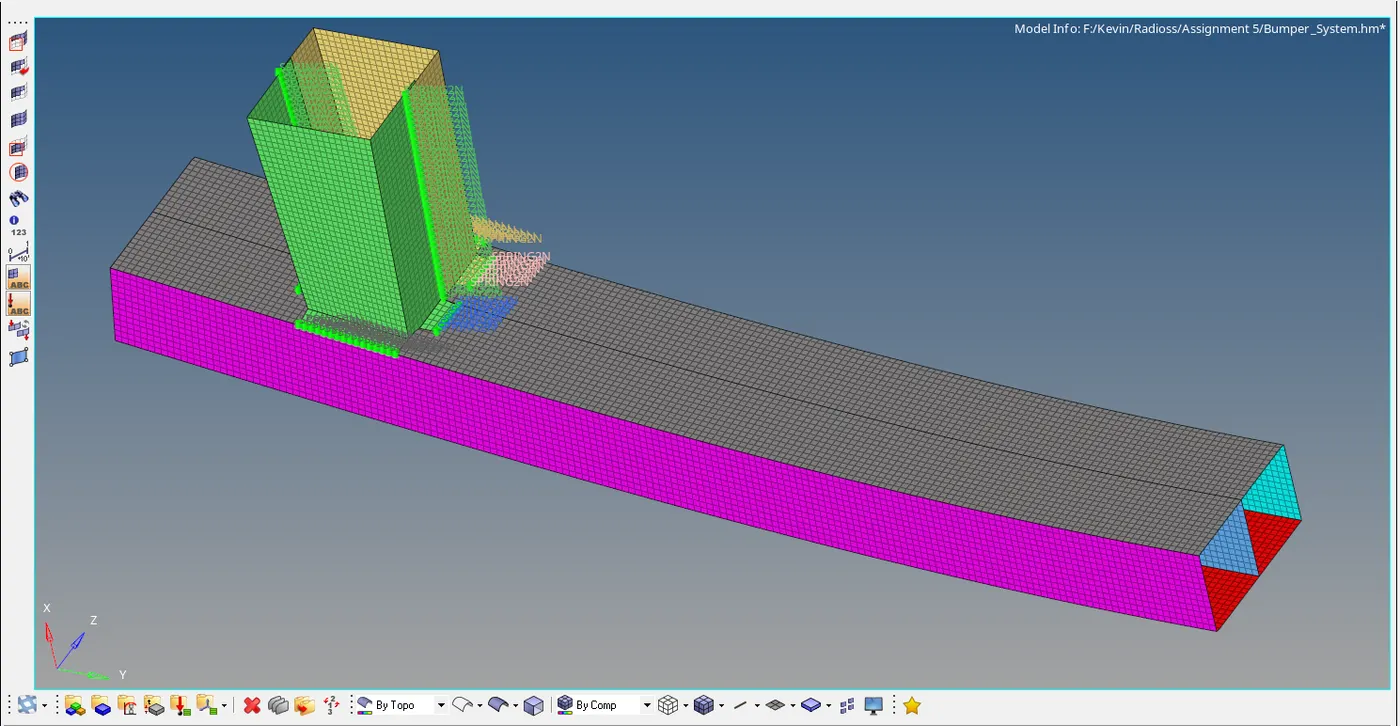
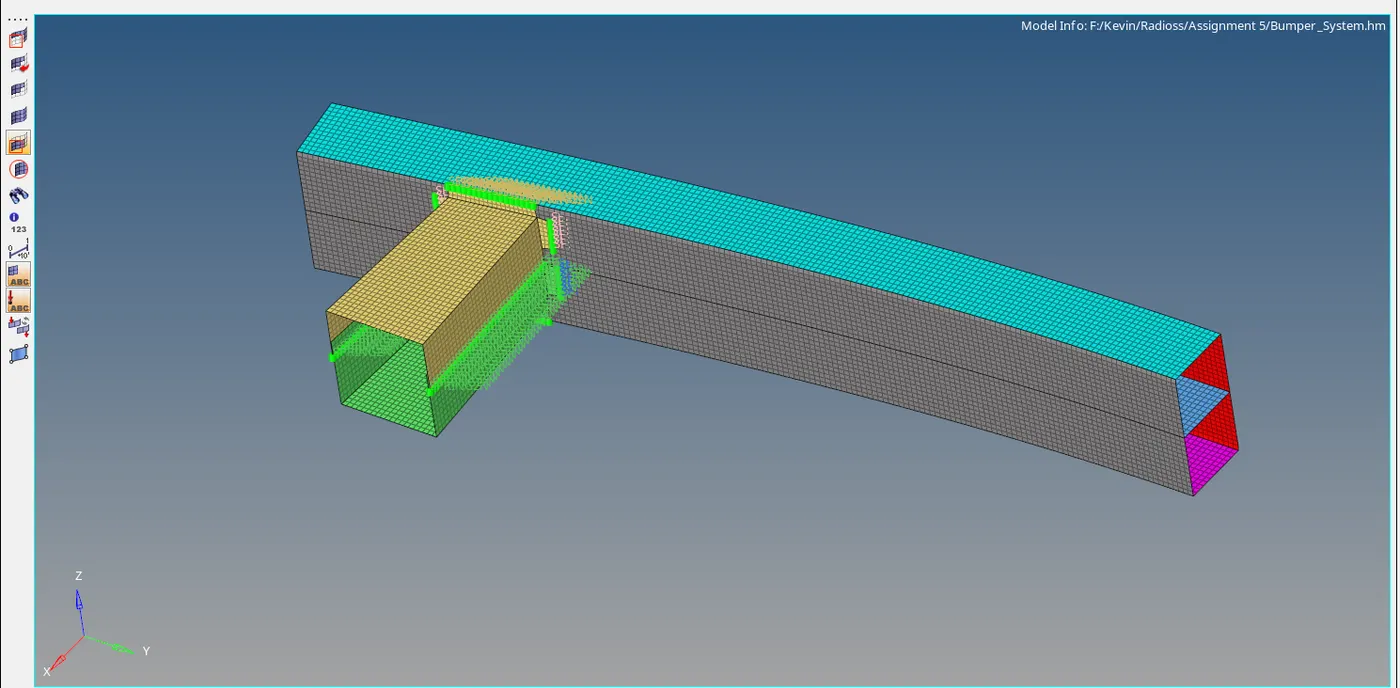
Fig: Welded model
The property ID is created for seam weld and that ID is shown below,
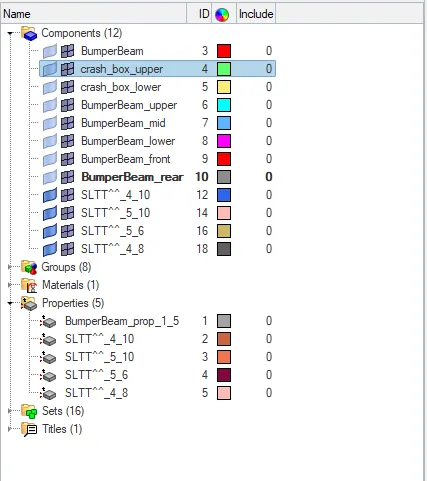
Fig: Property table
CRASH TUBE (CASE-1):
- First, we want to import the crush tube file by using the import option and select the file that we want to import the data of file name as crush_tube_0000.rad that is referred to as an input file of the simulation and click import. Now the file is imported and the import selection process and import file dialog box is shown below,
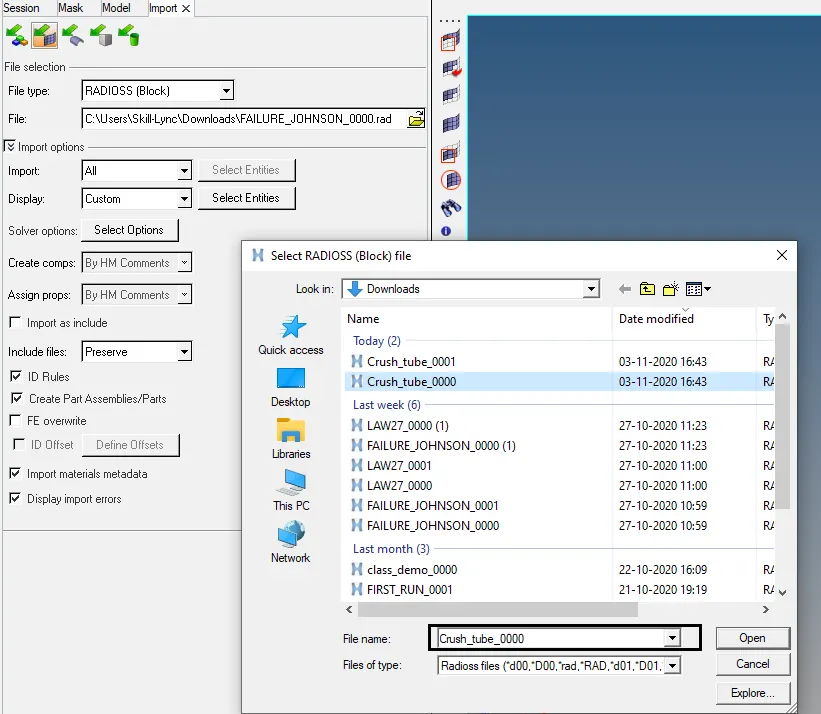
Fig: Import Table
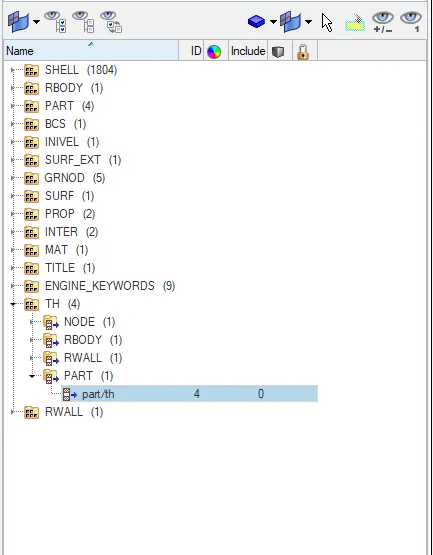
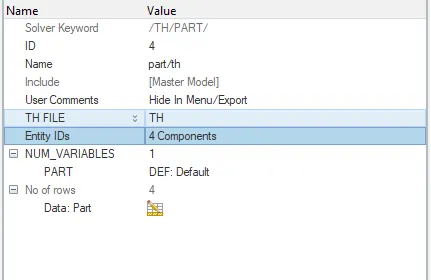
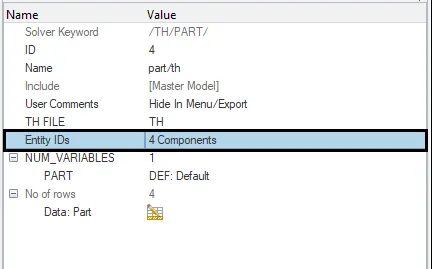
- In this case we want to create TH_part and to select the four components in that time history TH_part that image is shown below,
- After importing that crush tube file a model will open and that model is shown below,
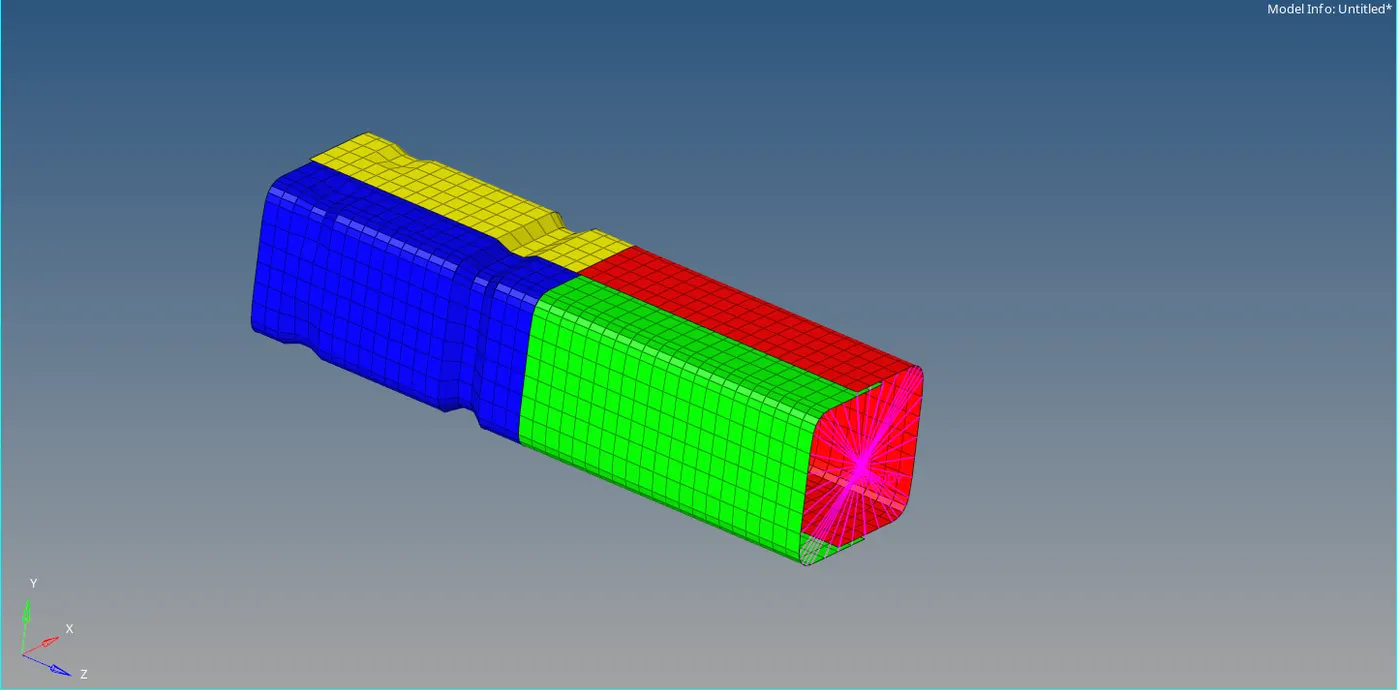
Fig: Open model
- Now we want to run the model as default Type-7 without changing any values by selecting the Tool>radioss>select the input file>and click radioss option to run the simulation that dialog box is shown as below,
- To increase the speed of simulation we can type with a command ie, -nt 4
- Here “nt” means the number of threads (ie, means 4 CPU for solving the problem)

- Now the result is obtained in the respective given folder, open the folder, and analysis the errors like energy error and mass error. These errors are shown in the Engine Out file that is shown below,
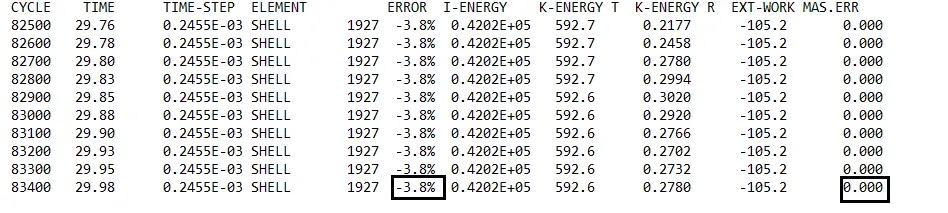
Fig: Energy error and Mass error
- Here the result shows the two errors, energy error as -3.8 % and mass error as 0.000 %. An energy error should be in -5% is considered as better for simulation.
- The total number of cycles and the simulation time also noticed in that output and the values are shown below,
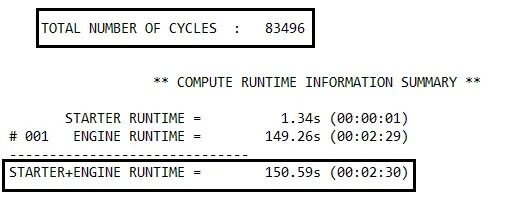
Fig: CycleTime
- Now open the hyper view and load Crush_tube.h3d model file and select the apply option to open that model in hyper view. Therefore the model is opened and now to change the result type as Von Mises(s) to get the Von Mises Stress Contour Plot select the components and edit the averaging method as simple and click apply to get the animation of the crush tube on a rigid wall.
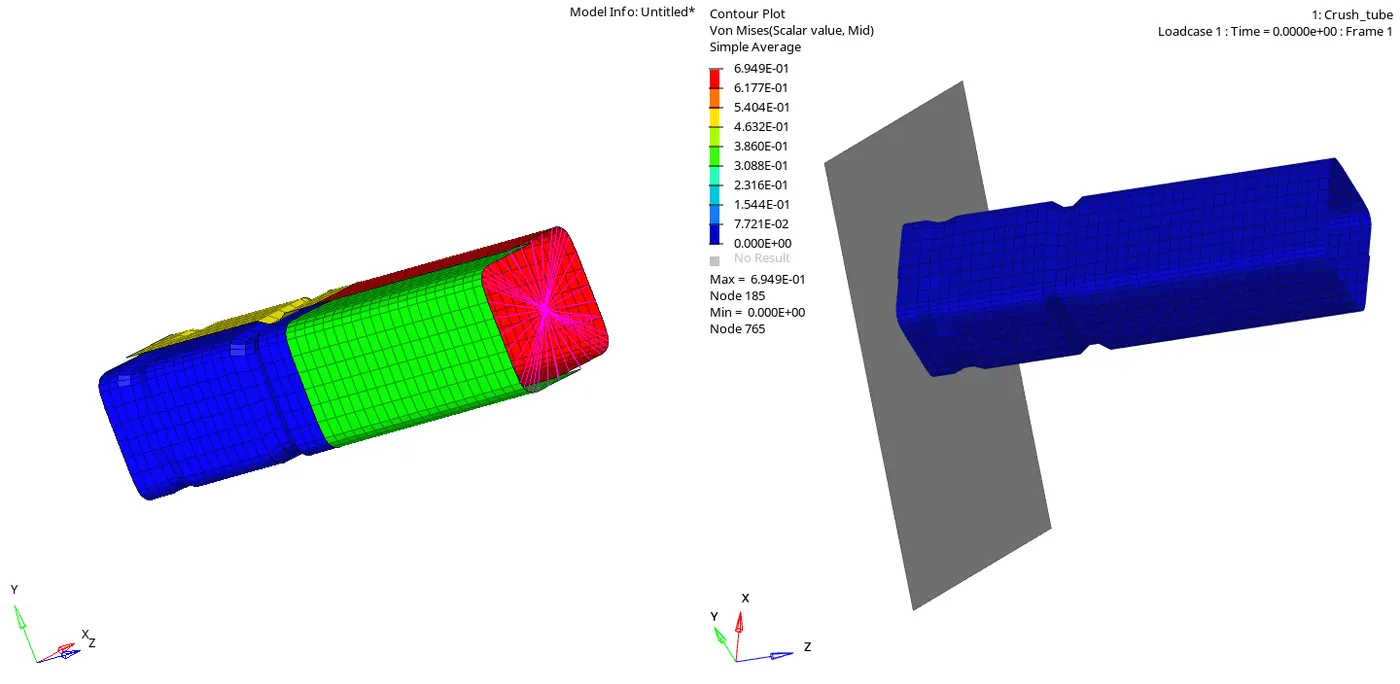
Fig: Open model Vonmises stress Contour Plot
- Now the contour plot is generated click the mesh icon to visualize the deformation of elements in each node. Here if you see in the plot contour above is Von Mises stress, here the component going to crash with time as we run our simulation. It shows a different range of colors as stress increases on the component. Von Mises stress is a value used to determine if a given material will yield or fracture. It is mostly used for ductile materials, such as metals. Von Mises stress is computed and compared to the yield stress material. If the von mises is smaller than the yield stress the computed stress is the one used in order to compute the internal force of the element
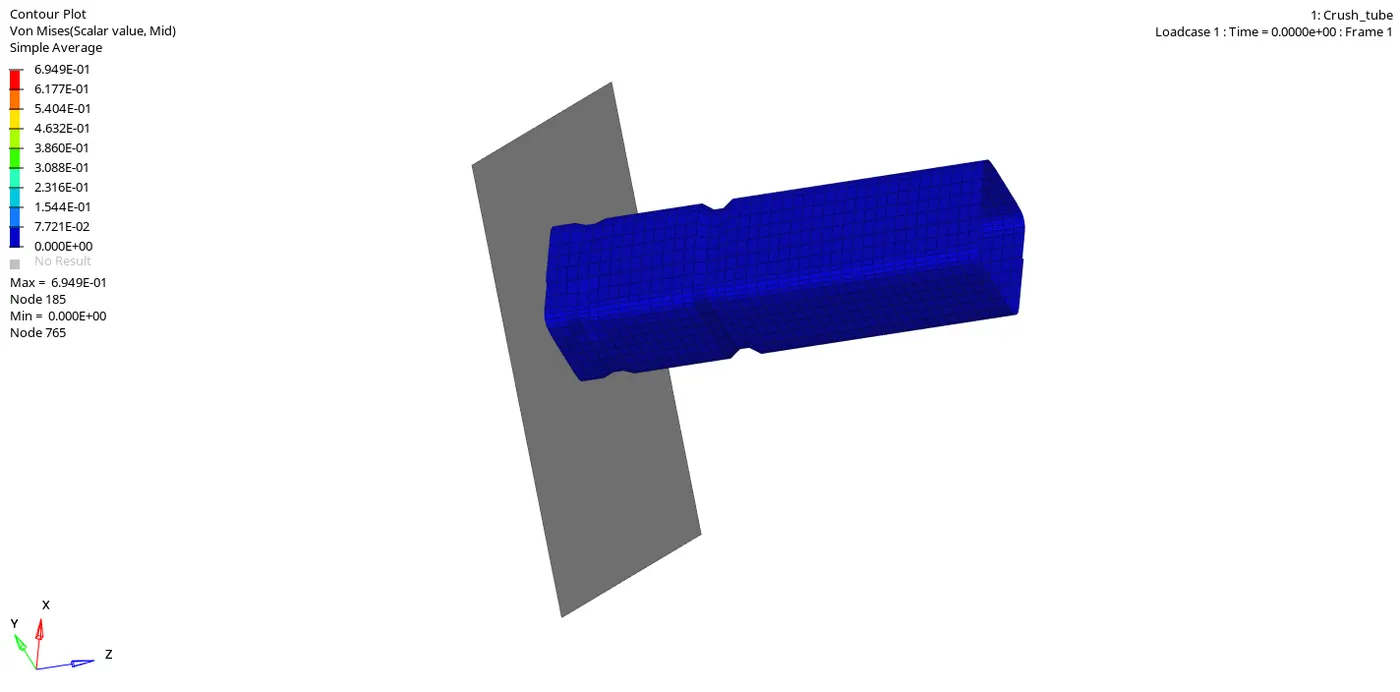
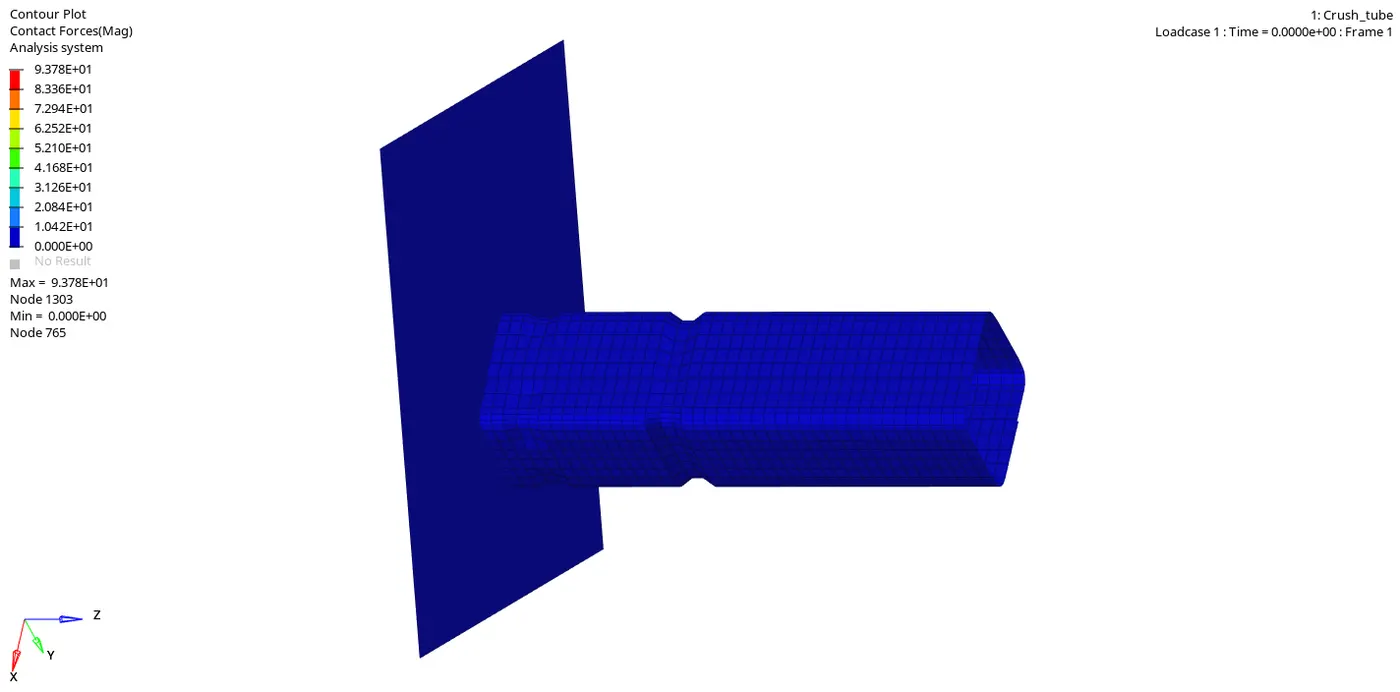
Fig: Vonmises stress Contour Plot Vs Contact forces plot
- In this case, we want to create the contact force of the tube while crashing on a rigid wall so change the result type as contact forces and click apply to get the animation of the crush tube on a rigid wall.
- Here above Von mises stress plot shows that the maximum value of stress is 6.949E-01Mpa and the minimum value of stress as 0 and the contact forces plot shows that the maximum value of contact force is 9.378E+01Mpa and the minimum value as 0 during the tube crashed in the rigid wall that value is shown as below,
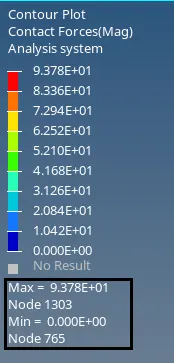
Fig: Contact forces
- Hence the max contact force is created from this simulation is 93.78N whereas the time history (TH) for all the components is created in order to study the deformation and energy variation in each component.
ENERGY PLOTS:
- To create the plot for each energy and absorbs that what was happening during the crash and how could the element gets deforming while applying some force. Now select hyperchart option that will give the empty graph as a display. Import the file crush_tubeT01 and click the apply option.
RIGID WALL FORCE:
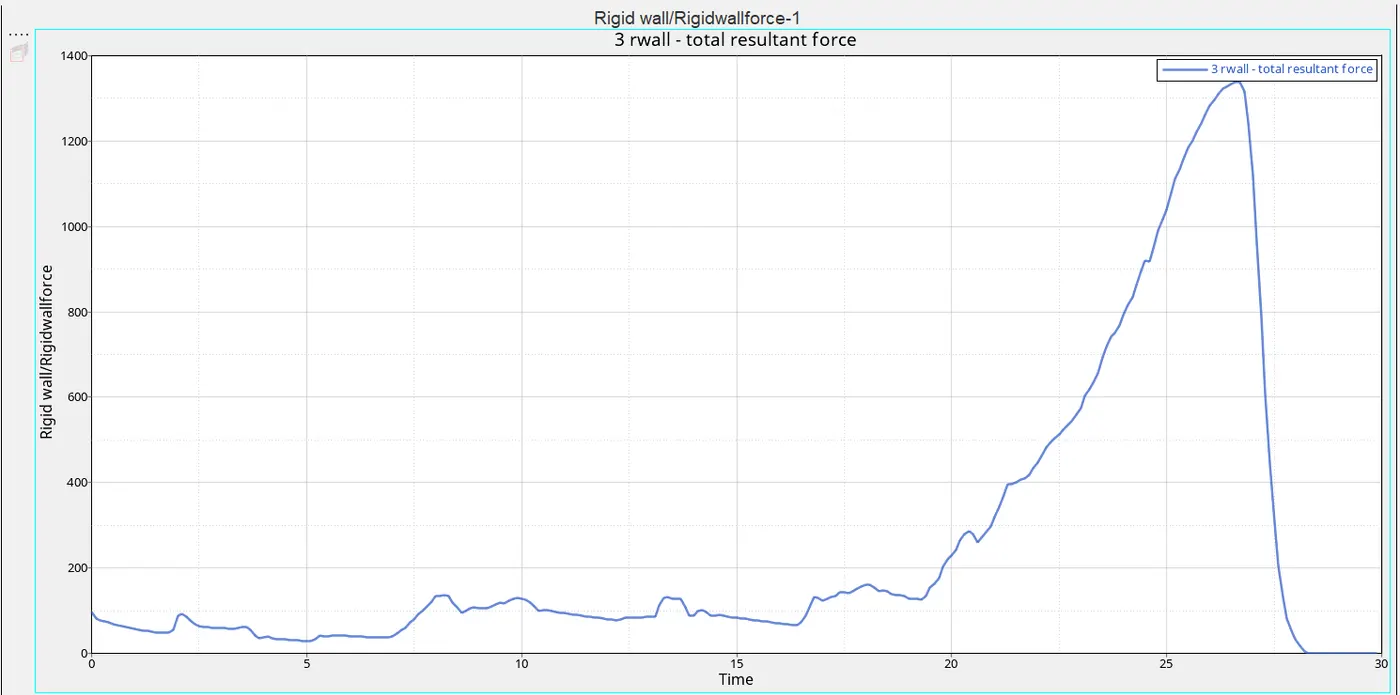
Fig: Rigidwall force
- A rigid wall force is created when the tube is crashed on the wall it creates some force. This above plot shows that a gradual increase flow of force is obtained in the initial stage and a sudden peak occurs up to elements fail and it again decreases because the rebound force is created after the failure of the element.
- Here the maximum rise in force is 1400N at the time of 27ms, it occurs while in the complete deformation of elements. Then it decreased due to rebound force acting after the element failure.
INTERNAL ENERGY:
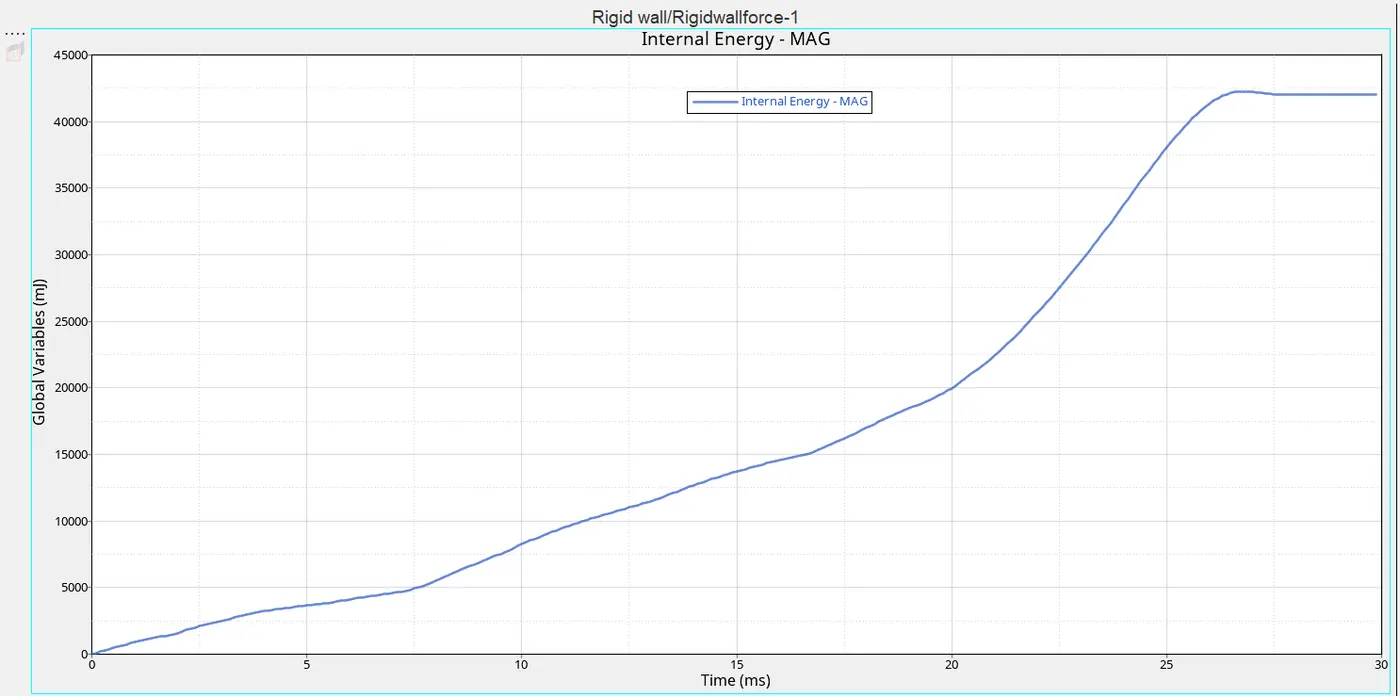
Fig: Internal Energy Plot
- This energy plot shows that increase in energy while the tube crashed on the rigid wall because of the contacts in the element it rises and after it reaches the maximum hitting point it will flow constantly.
- When the internal energy is observed due to contact of the tube and rigid wall. During the crash, there is a velocity is acted along the tube and it creates internal energy, after the completion of failure in the element it will remain stable.
- It reaches above 40000mJ when the time of 27ms and after that there is no velocity is acting on the tube so it keeps the constant flow.
KINETIC ENERGY:
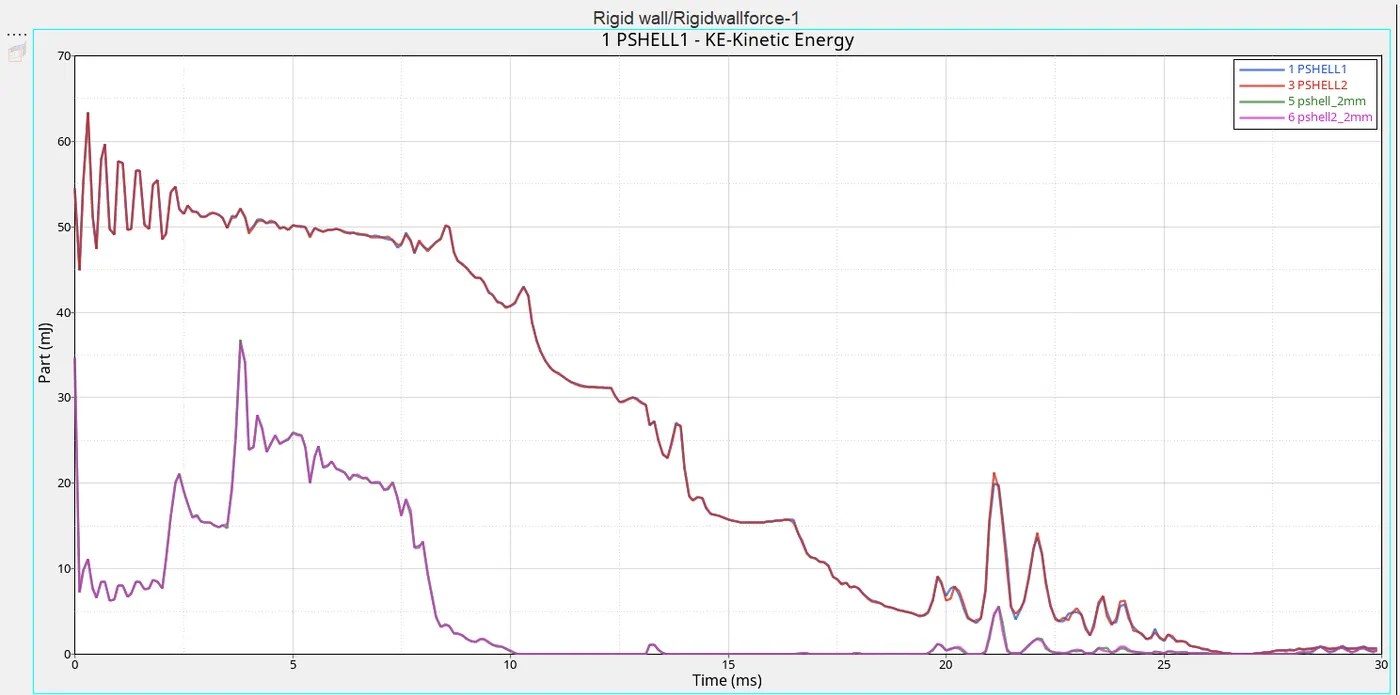
Fig: Kinetic Energy Plot
- In this energy, the plot shows that while the kinetic energy is acting between the tube and the rigid wall, In the initial stage there is a decrease in energy flow because the velocity of the tube is acted in a wall that increases the internal energy so kinetic energy is decreased.
- After it reaches 20ms a small peak is occurred suddenly due to rebound force acted on the portion.
CONTACT ENERGY:
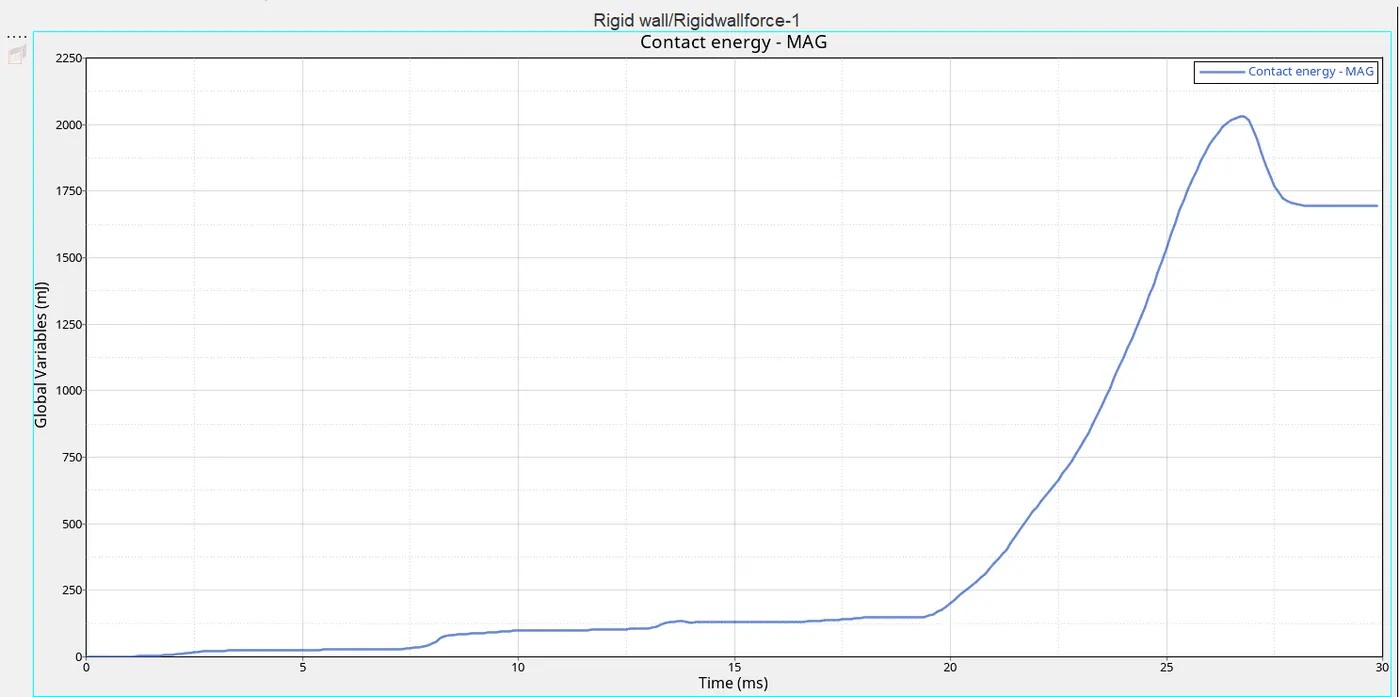
Fig: Contact Energy Plot
- The above figure shows that the contact energy is slightly varying at the beginning which defines the deformation occurred is slow and increasing after 15ms which reaches at the peak of 2000 mJ at the time of 27ms where there is a large deformation has occurred.
TOTAL ENERGY PLOT:
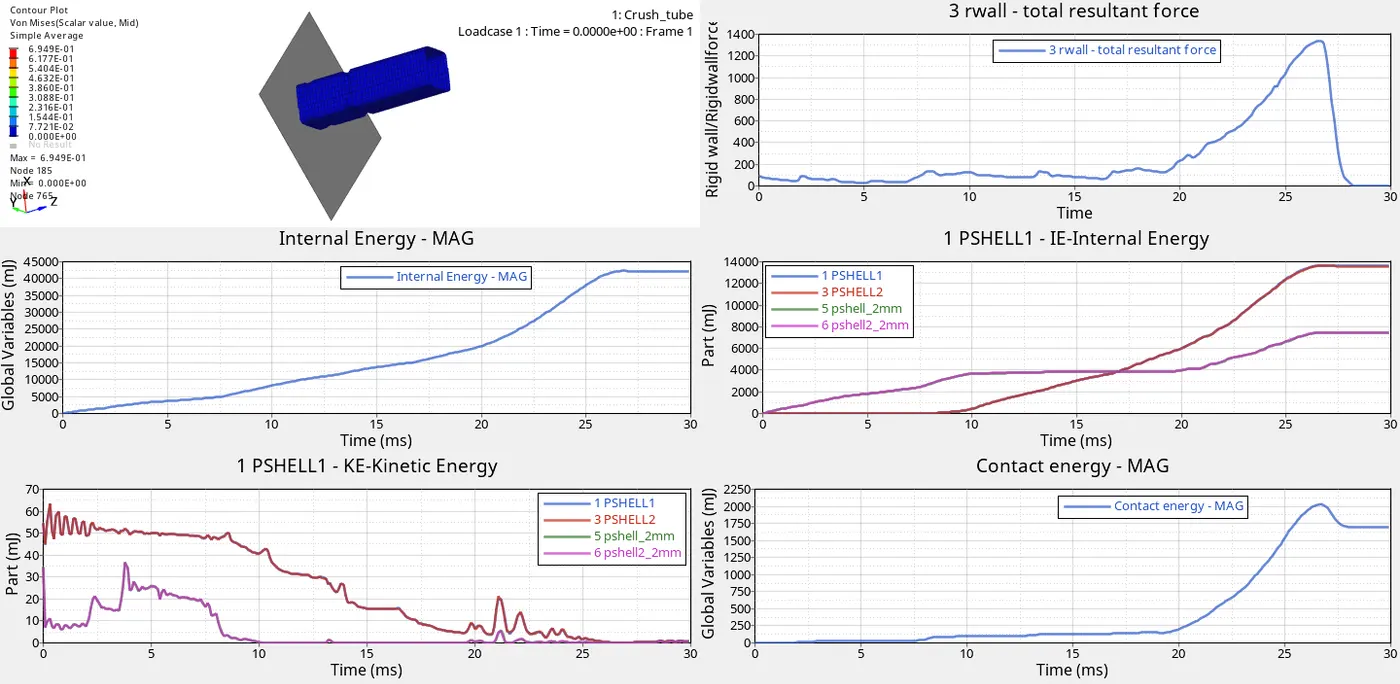
Fig: Total Energy Plot
CASE-2
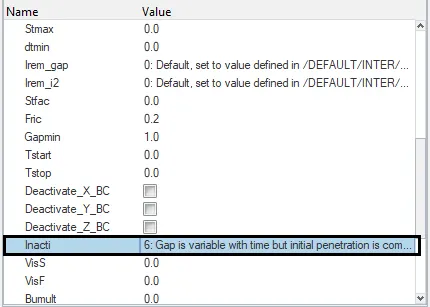
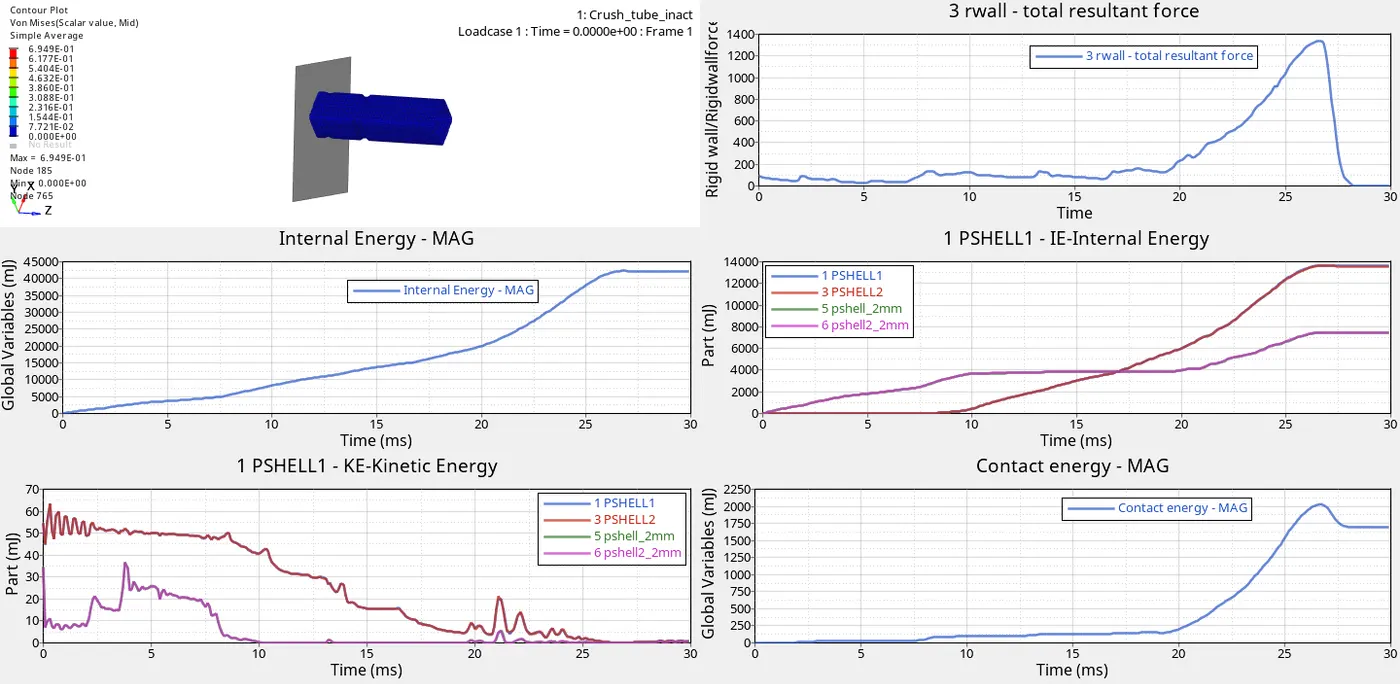
- In this case, the same procedures are followed as like as case-1 first we want to import the model then create TH_part and select the four components now change the iactv value as 6 in default type 7 contact that image is shown below,
- In this case we want to create TH_part and to select the four components in that time history TH_part that image is shown below,
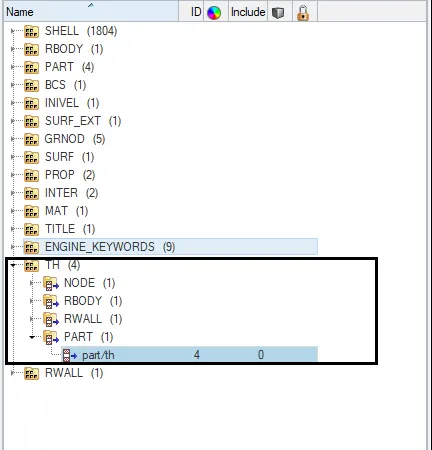
- Now we want to run the model as default Type-7 without changing any values by selecting the Tool>radioss>select the input file>and click radioss option to run the simulation that dialog box is shown as below,
- To increase the speed of simulation we can type with a command ie, -nt 4
- Hence the result is obtained in the respective given folder, open the folder, and analysis the errors like energy error and mass error. These errors are shown in the Engine Out file that is shown below,
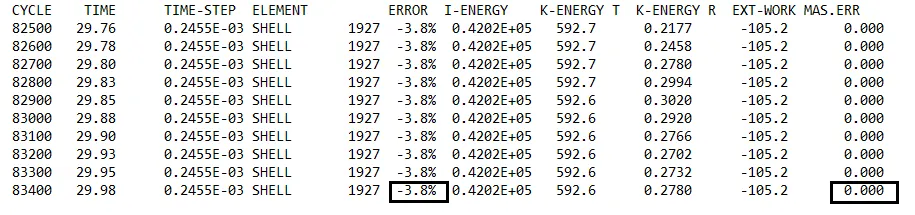
Fig: Energy error and Mass error
- Here the result shows the two errors, energy error as -3.8 % and mass error as 0.000 %. An energy error should be in -5% is considered as better for simulation.
- The total number of cycles and the simulation time also noticed in that output and the values are shown below,
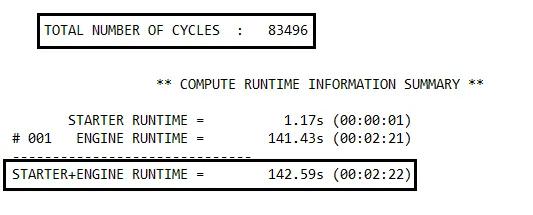
Fig: CycleTime
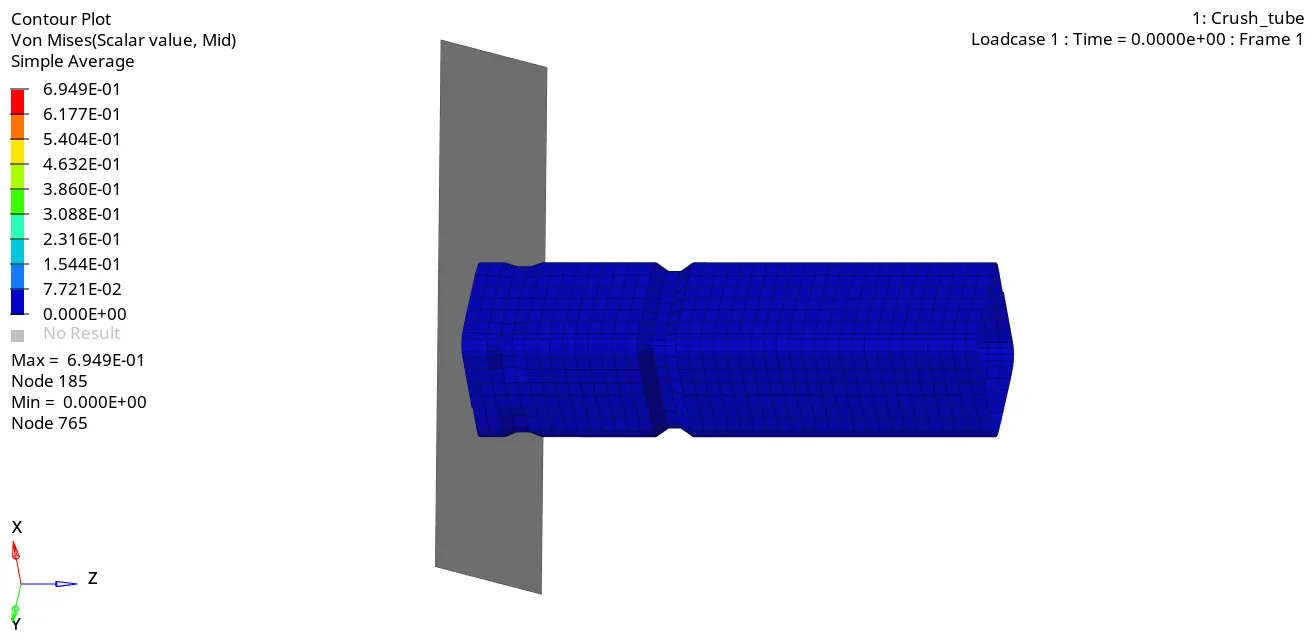
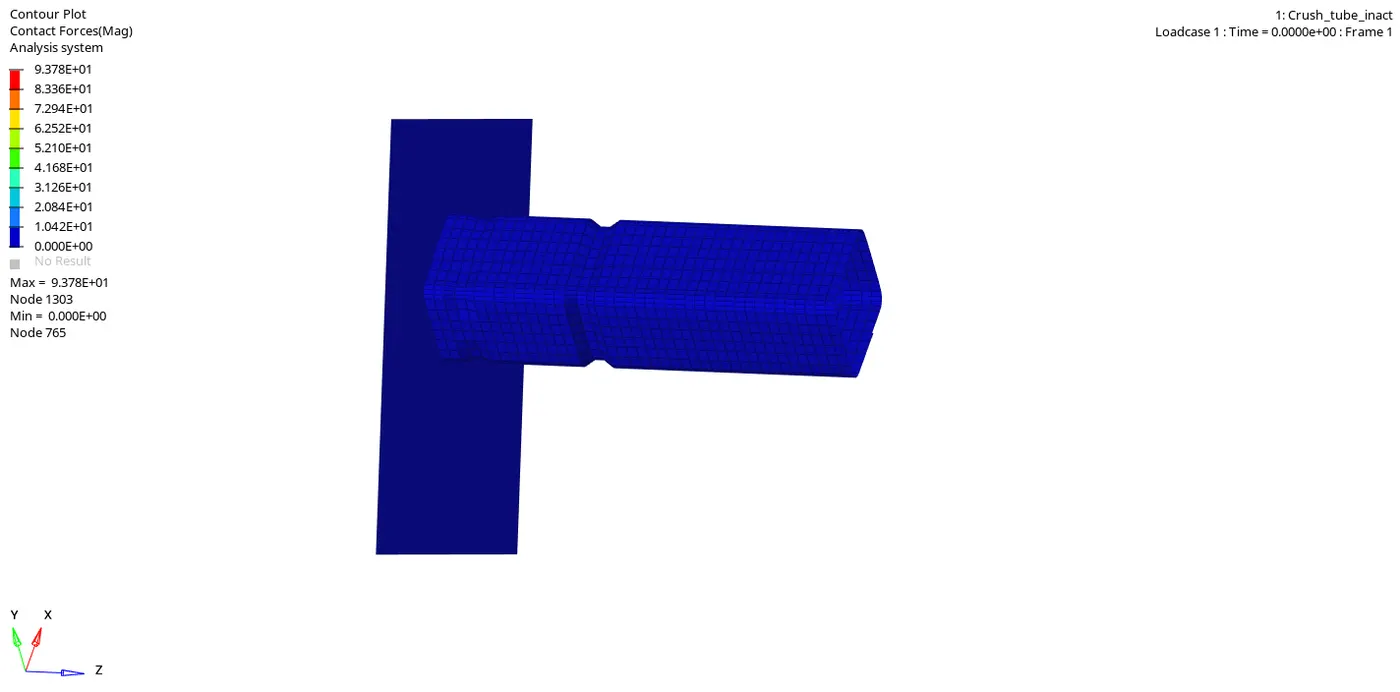
Fig: Vonmises stress Contour Plot Vs Contact forces plot
- In this case, we want to create the contact force of the tube while crashing on a rigid wall so change the result type as contact forces and click apply to get the animation of the crush tube on a rigid wall.
- Here above Von mises stress plot shows that the maximum value of stress is 6.949E-01Mpa and the minimum value of stress as 0 and the contact forces plot shows that the maximum value of contact force is 9.378E+01Mpa and the minimum value as 0 during the tube crashed in the rigid wall that value is shown as below,
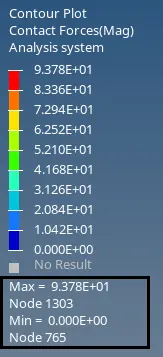
Fig: Contact forces
- Hence the max contact force is created from this simulation is 93.78N whereas the time history (TH) for all the components is created in order to study the deformation and energy variation in each component.
ENERGY PLOTS:
- To create the plot for each energy and absorbs that what was happening during the crash and how could the element gets deforming while applying some force. Now select hyperchart option that will give the empty graph as a display. Import the file crush_tubeT01 and click the apply option.
RIGID WALL FORCE:
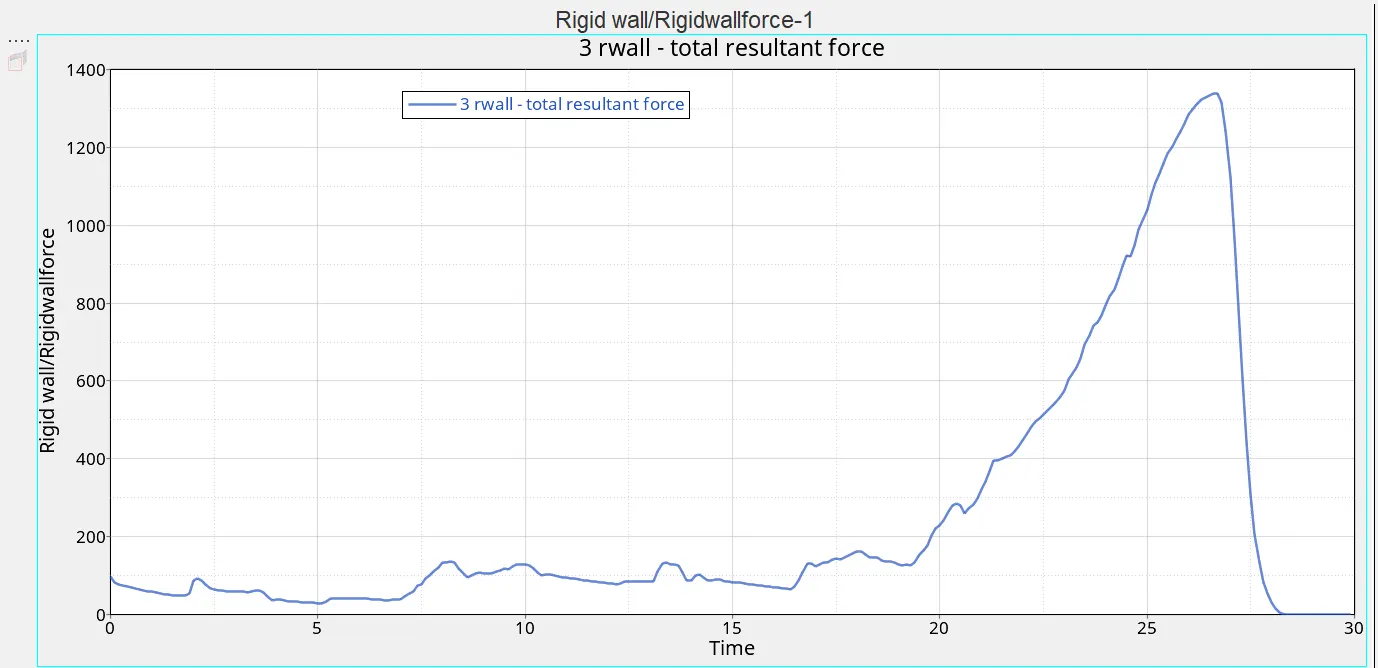
Fig: Rigidwall force
- A rigid wall force is created when the tube is crashed on the wall it creates some force. This above plot shows that a gradual increase flow of force is obtained in the initial stage and a sudden peak occurs up to elements fail and it again decreases because the rebound force is created after the failure of the element.
- Here the maximum rise in force is 1400N at the time of 27ms, it occurs while in the complete deformation of elements. Then it decreased due to rebound force acting after the element failure.
INTERNAL ENERGY:
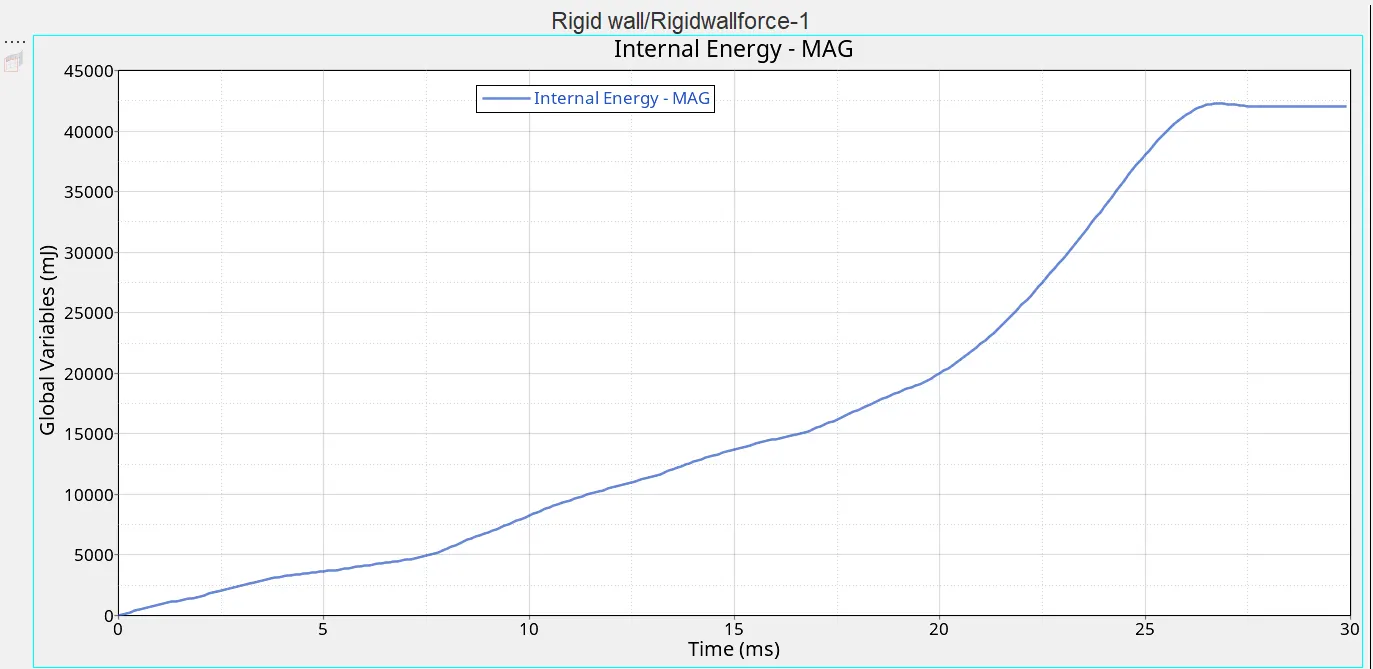
Fig: Internal Energy Plot
- This energy plot shows that increase in energy while the tube crashed on the rigid wall because of the contacts in the element it rises and after it reaches the maximum hitting point it will flow constantly.
- When the internal energy is observed due to contact of the tube and rigid wall. During the crash, there is a velocity is acted along the tube and it creates internal energy, after the completion of failure in the element it will remain stable.
- It reaches above 40000mJ when the time of 27ms and after that there is no velocity is acting on the tube so it keeps the constant flow.
KINETIC ENERGY:
Fig: Kinetic Energy Plot
- In this energy, the plot shows that while the kinetic energy is acting between the tube and the rigid wall, In the initial stage there is a decrease in energy flow because the velocity of the tube is acted in a wall that increases the internal energy so kinetic energy is decreased.
- After it reaches 20ms a small peak is occurred suddenly due to the rebound force acted on the portion.
CONTACT ENERGY:
Fig: Contact Energy Plot
- The above figure shows that the contact energy is slightly varying at the beginning which defines the deformation occurred is slow and increasing after 15ms which reaches at the peak of 2000 mJ at the time of 27ms where there is a large deformation is occurred.
TOTAL PLOTS:
CASE-3
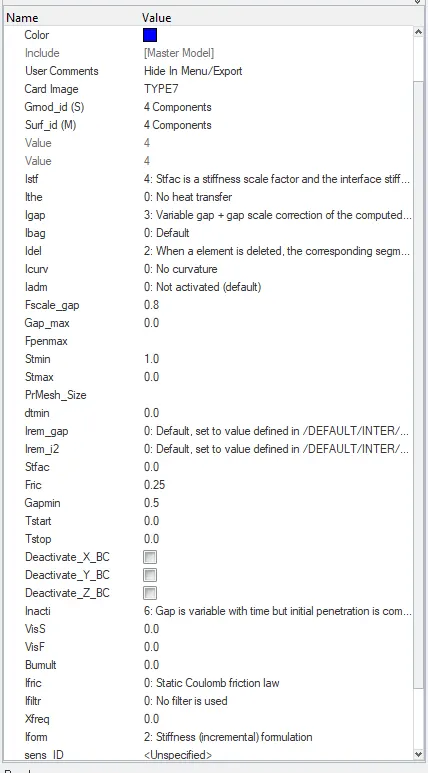
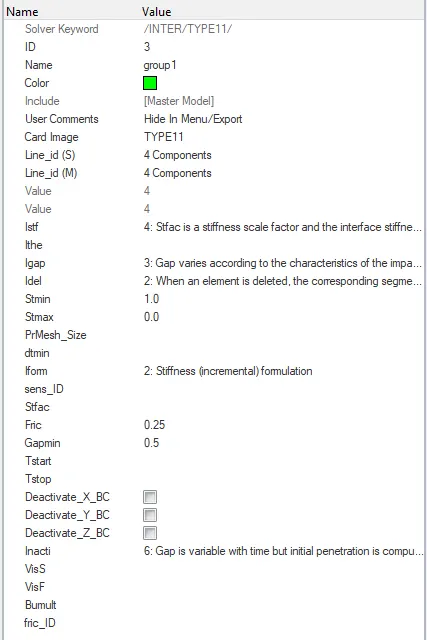
- In this case we are creating Type 11 contact with default Type 7 along same recommended values for both type and they are shown below,
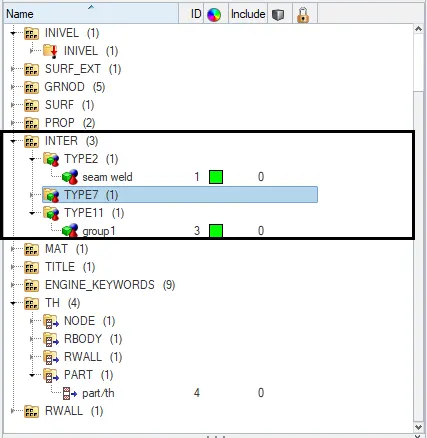
Both types are indicated in INTER that is shown below,
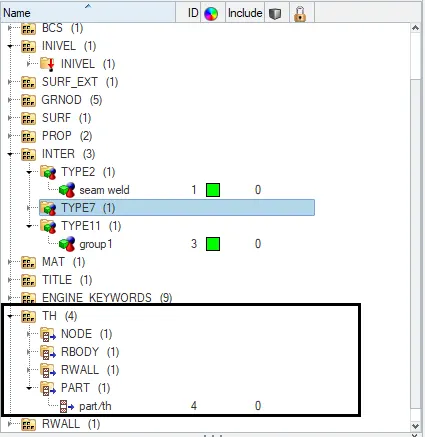
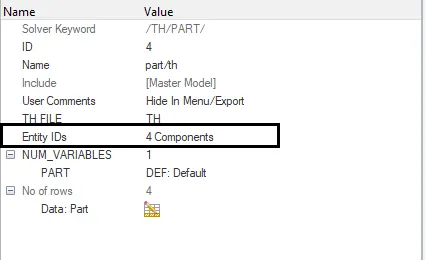
- Here we want to create TH_part and to select the four components in that time history TH_part that image is shown below,
- Now we want to run the model by selecting the Tool>radioss>select the input file>and click radioss option to run the simulation that dialog box is shown as below,
- To increase the speed of simulation we can type with a command ie, -nt 4
- Hence the result is obtained in the respective given folder, open the folder, and analysis the errors like energy error and mass error. These errors are shown in the Engine Out file that is shown below,

Fig: Energy error and Mass error
- Here the result shows the two errors, energy error as -6.7 % and mass error as 0.000 %. An energy error should be in -5% is considered as better for simulation.
- The total number of cycles and the simulation time also noticed in that output and the values are shown below,
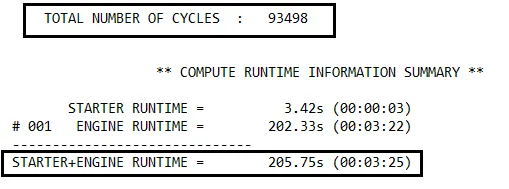
Fig: CycleTime
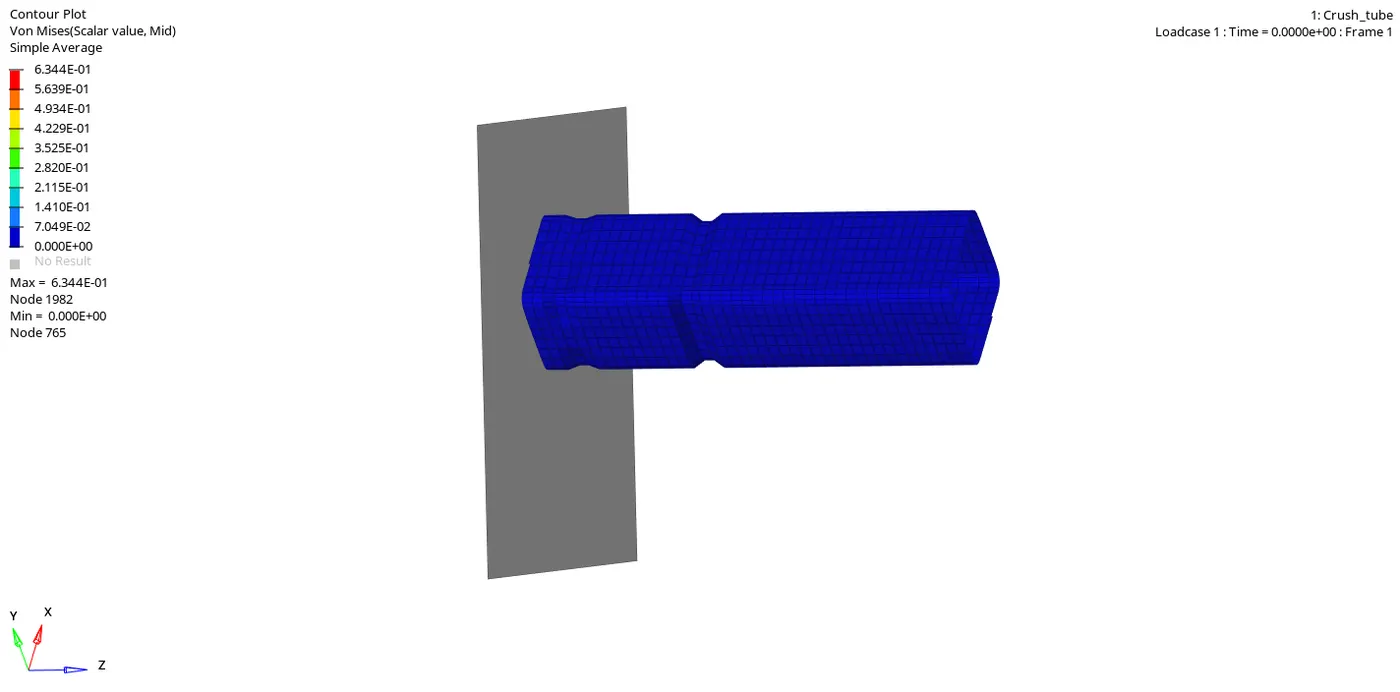
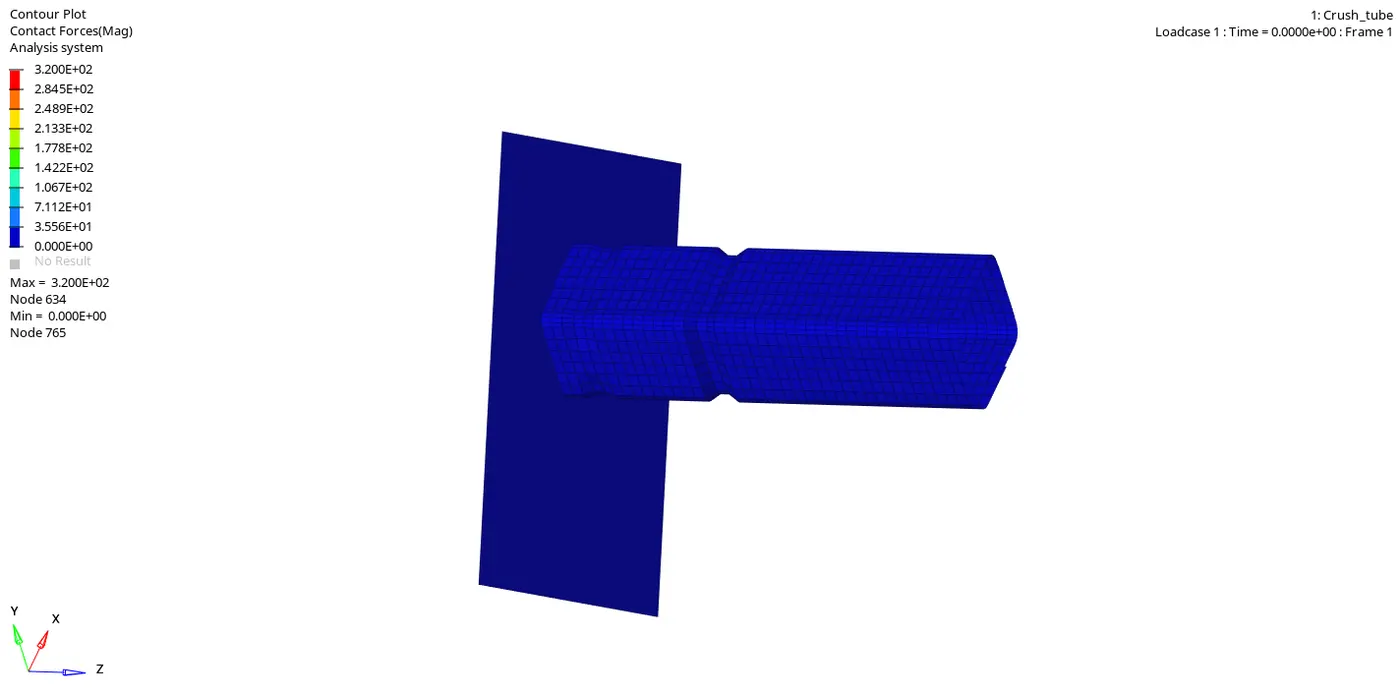
Fig: Vonmises stress Contour Plot Vs Contact forces plot
- In this case, we want to create the contact force of the tube while crashing on a rigid wall so change the result type as contact forces and click apply to get the animation of the crush tube on a rigid wall.
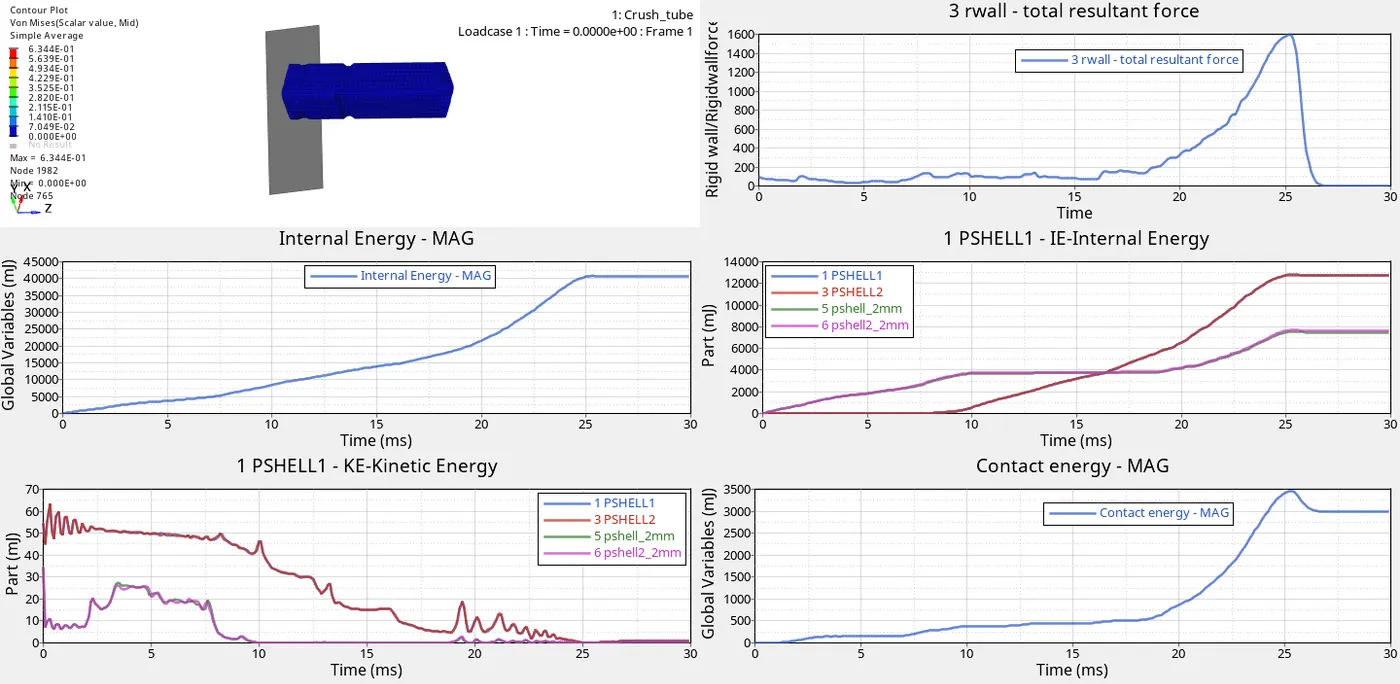
- Here above Von mises stress plot shows that the maximum value of stress is 6.344E-01Mpa and the minimum value of stress as 0 and the contact forces plot shows that the maximum value of contact force is 3.200E+01Mpa and the minimum value as 0 during the tube crashed in the rigid wall that value is shown as below,
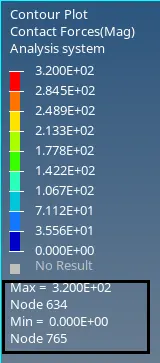
Fig: Contact forces
- Hence the max contact force is created from this simulation is 32.00N whereas the time history (TH) for all the components is created in order to study the deformation and energy variation in each component.
ENERGY PLOTS:
- To create the plot for each energy and absorbs that what was happening during the crash and how could the element gets deforming while applying some force. Now select hyperchart option that will give the empty graph as a display. Import the file crush_tube_type11_T01 and click the apply option.
RIGID WALL FORCE:
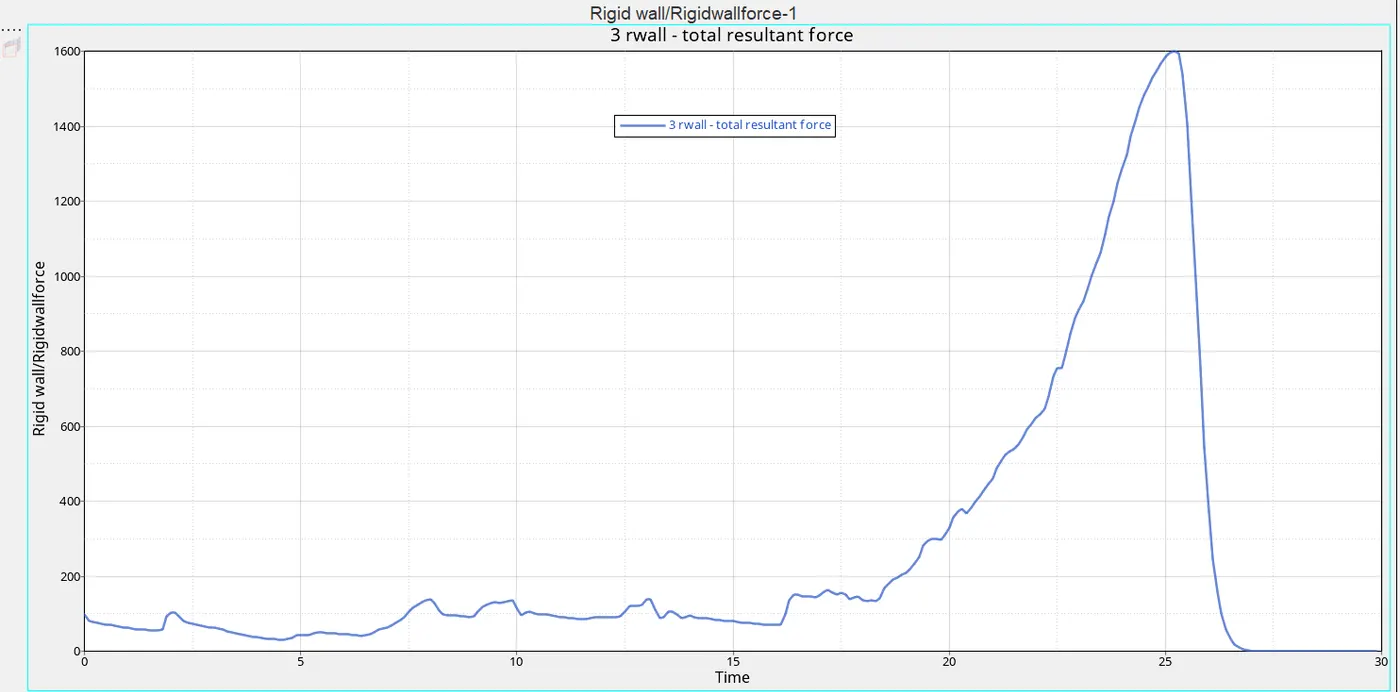
Fig: Rigidwall force
- A rigid wall force is created when the tube is crashed on the wall it creates some force. This above plot shows that a gradual increase flow of force is obtained in the initial stage and a sudden peak occurs up to elements fail and it again decreases because the rebound force is created after the failure of the element.
- Here the maximum rise in force is 1600N at the time of 26ms, it occurs while in the complete deformation of elements. Then it decreased due to rebound force acting after the element failure.
INTERNAL ENERGY:
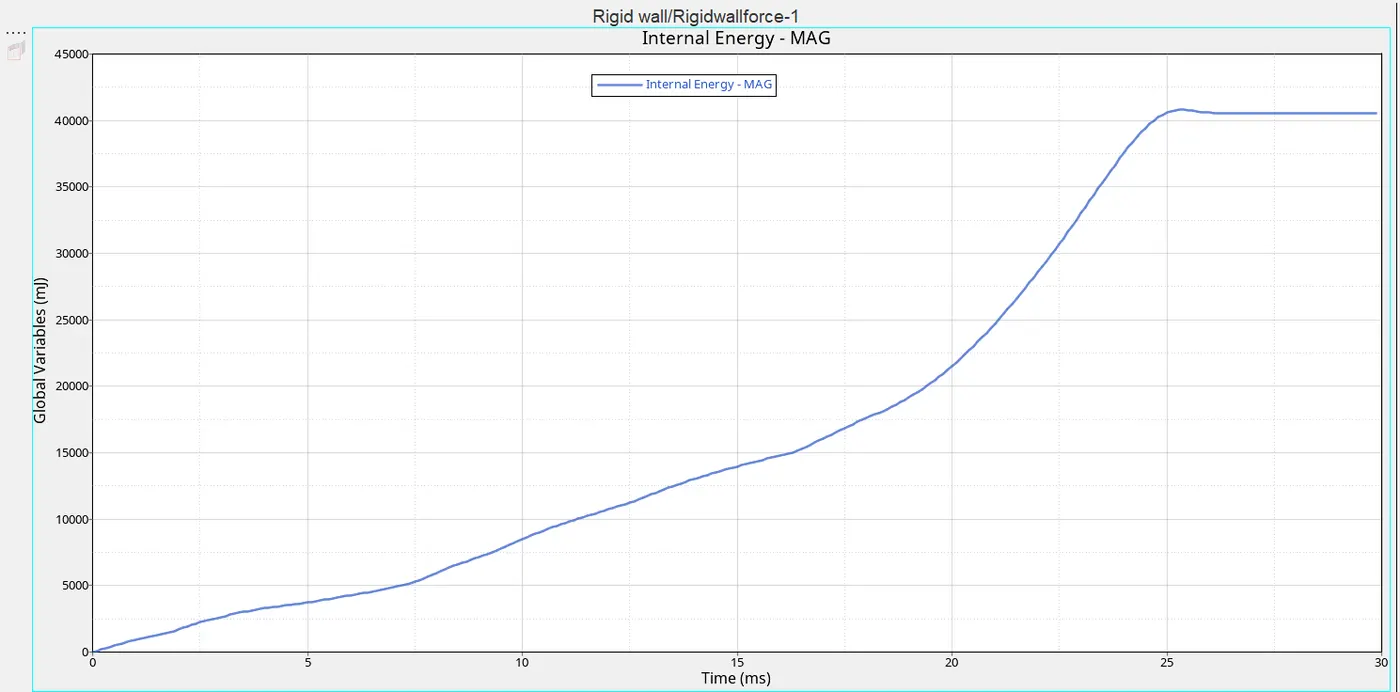
Fig: Internal Energy Plot
- This energy plot shows that increase in energy while the tube crashed on the rigid wall because of the contacts in the element it rises and after it reaches the maximum hitting point it will flow constantly.
- When the internal energy is observed due to contact of the tube and rigid wall. During the crash, there is a velocity is acted along the tube and it creates internal energy, after the completion of failure in the element it will remain stable.
- It reaches above 42000mJ when the time of 25ms and after that there is no velocity is acting on the tube so it keeps the constant flow.
KINETIC ENERGY:
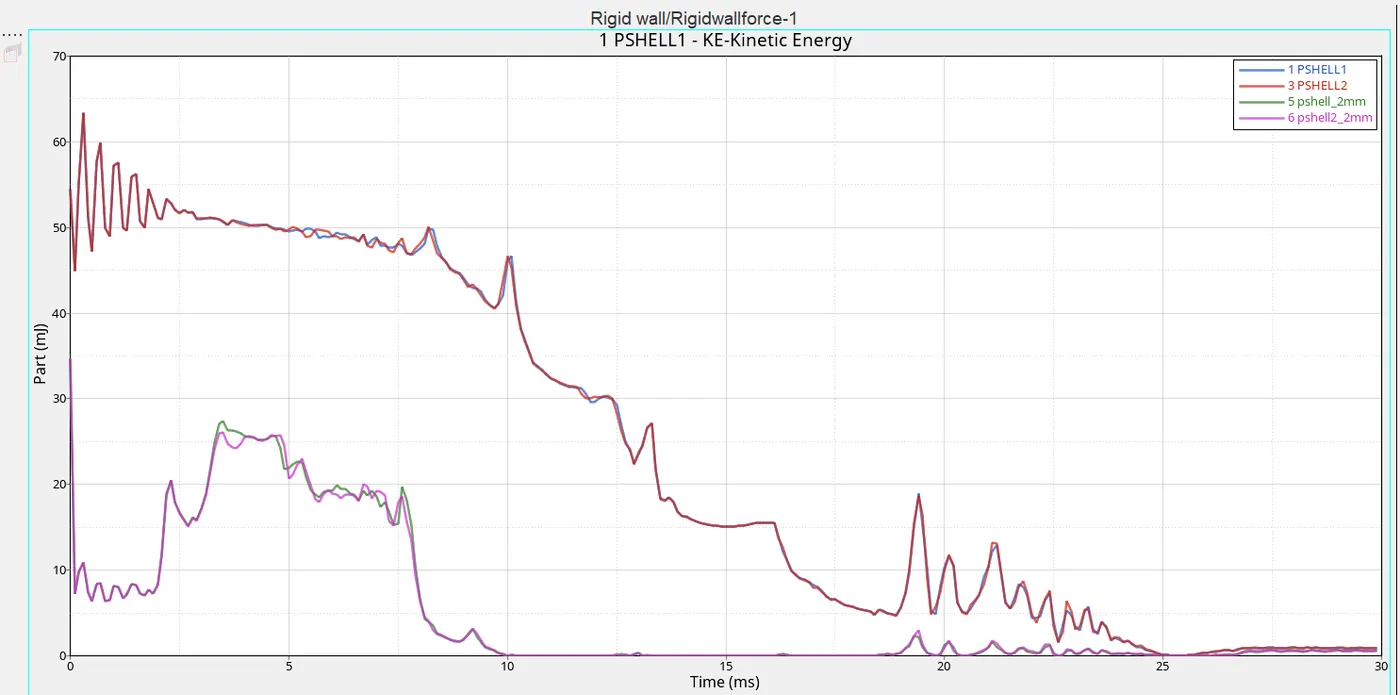
Fig: Kinetic Energy Plot
- In this energy, the plot shows that while the kinetic energy is acting between the tube and the rigid wall, In the initial stage there is a decrease in energy flow because the velocity of the tube is acted in wall that increases the internal energy so kinetic energy is decreased.
- After it reaches 20ms a small peak is occurred suddenly due to the rebound force acted on the portion.
- But this case among four-part the two-part energy is varied because the shell thickness for the boundary condition side part is 3mm and the wall side part is 2mm hence the wall side part will deform quickly compared with other two parts.
CONTACT ENERGY:
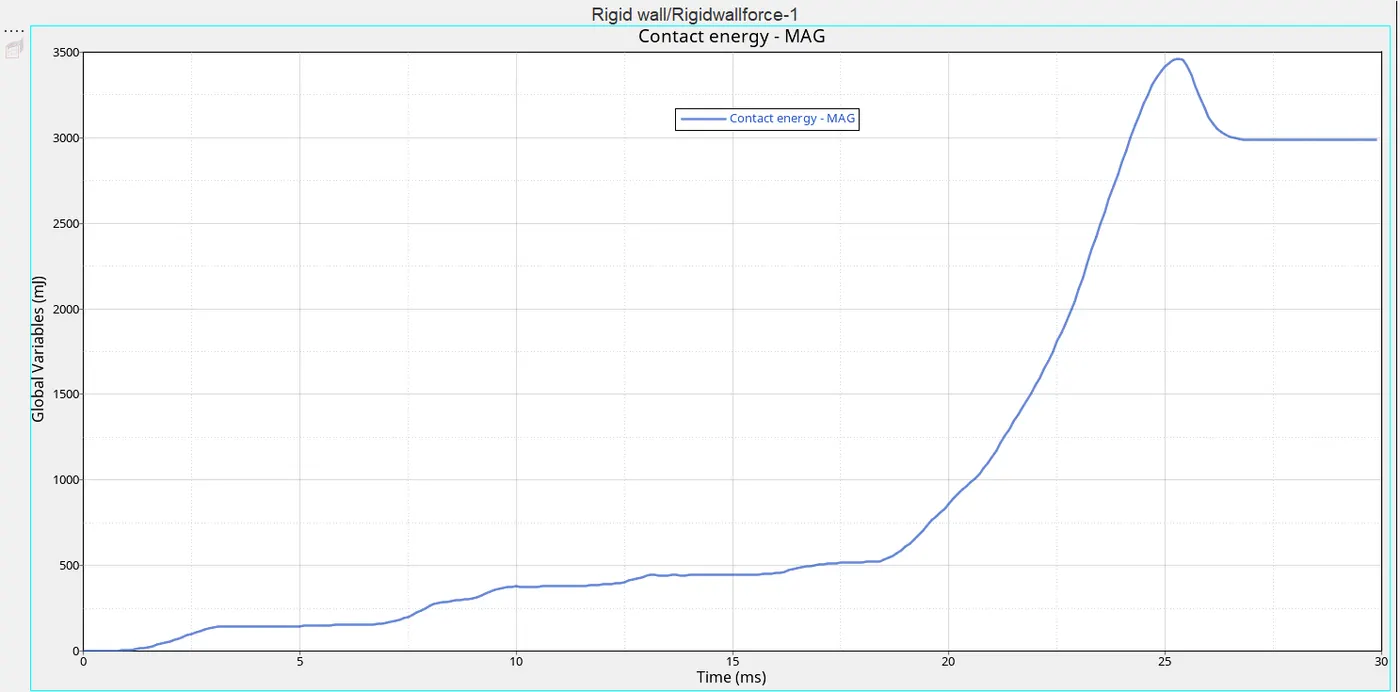
Fig: Contact Energy Plot
- The above figure shows that the contact energy is slightly varying at the begining which defines the deformation occurred is slow and increasing after 18ms which reaches a peak of 3500 mJ at the time of 27ms where there is a large deformation has occurred.
CASE-4
- In this case, the same procedures are followed as case-1 first we want to import the model then create TH_part and select the four components. Here remove both notches and remove boundary condition on rigid body node then run the simulation. Here the boundary condition removed image is shown as below,
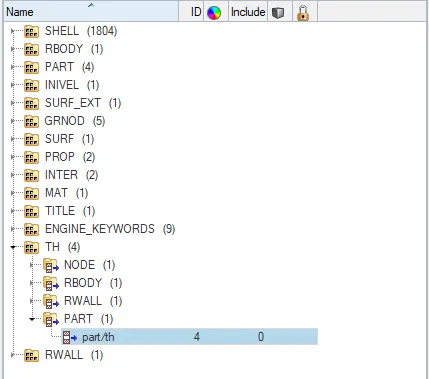
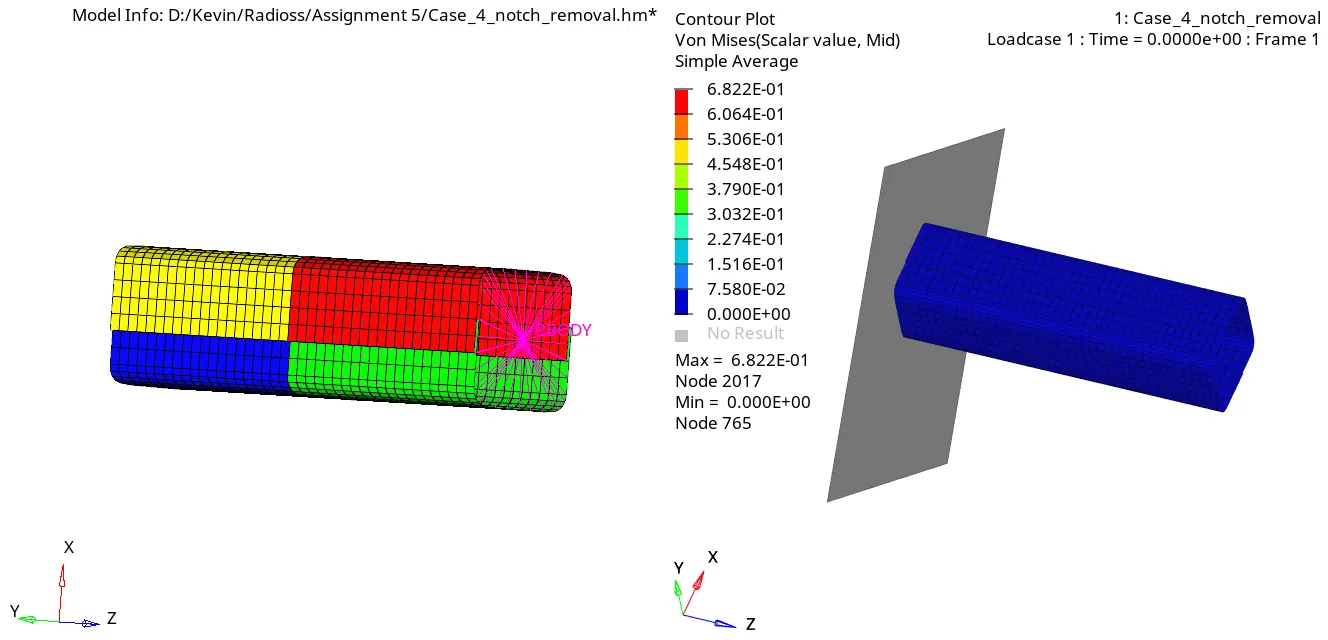
Fig: Open model Vonmises stress Contour Plot
- Now we want to run the model by selecting the Tool>radioss>select the input file>and click radioss option to run the simulation that dialog box is shown as below,
- To increase the speed of simulation we can type with a command ie, -nt 4
- Hence the result is obtained in the respective given folder, open the folder, and analysis the errors like energy error and mass error. These errors are shown in the Engine Out file that is shown below,

Fig: Energy error and Mass error
- Here the result shows the two errors, energy error as -3.0% and mass error as 0.000 %. An energy error should be in -5% is considered as better for simulation.
- The total number of cycles and the simulation time also noticed in that output and the values are shown below,
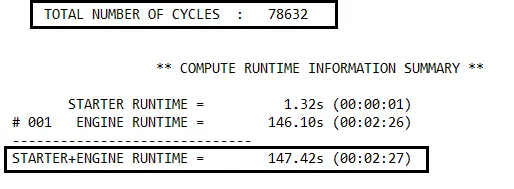
Fig: CycleTime
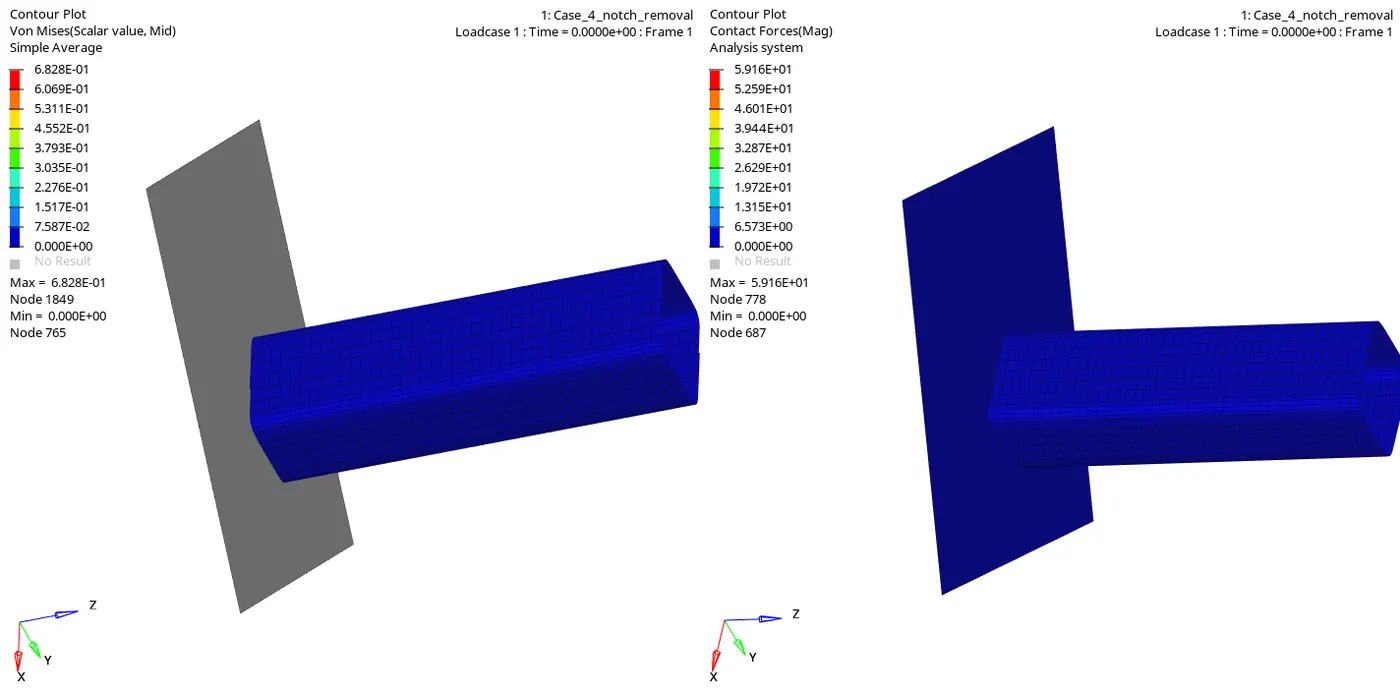
Fig: Vonmises stress Contour Plot Vs Contact forces plot
- In this case, we want to create the contact force of the tube while crashing on a rigid wall so change the result type as contact forces and click apply to get the animation of the crush tube on a rigid wall.
- Here above Von mises stress plot shows that the maximum value of stress is 6.828E-01Mpa and the minimum value of stress as 0 and the contact forces plot shows that the maximum value of contact force is 5.916E+01Mpa and the minimum value as 0 during the tube crashed in the rigid wall.
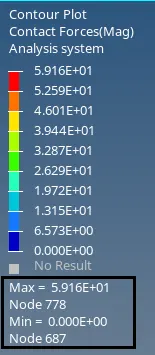
Fig: Contact forces
- Hence the max contact force is created from this simulation is 59.16N whereas the time history (TH) for all the components is created in order to study the deformation and energy variation in each component.
ENERGY PLOTS:
- To create the plot for each energy that absorbs what was happening during the crash and how could the element get deforming while applying some force. Now select hyperchart option that will give the empty graph as a display. Import the file case4 _notch_removal_T01 and click the apply option.
RIGID WALL FORCE:
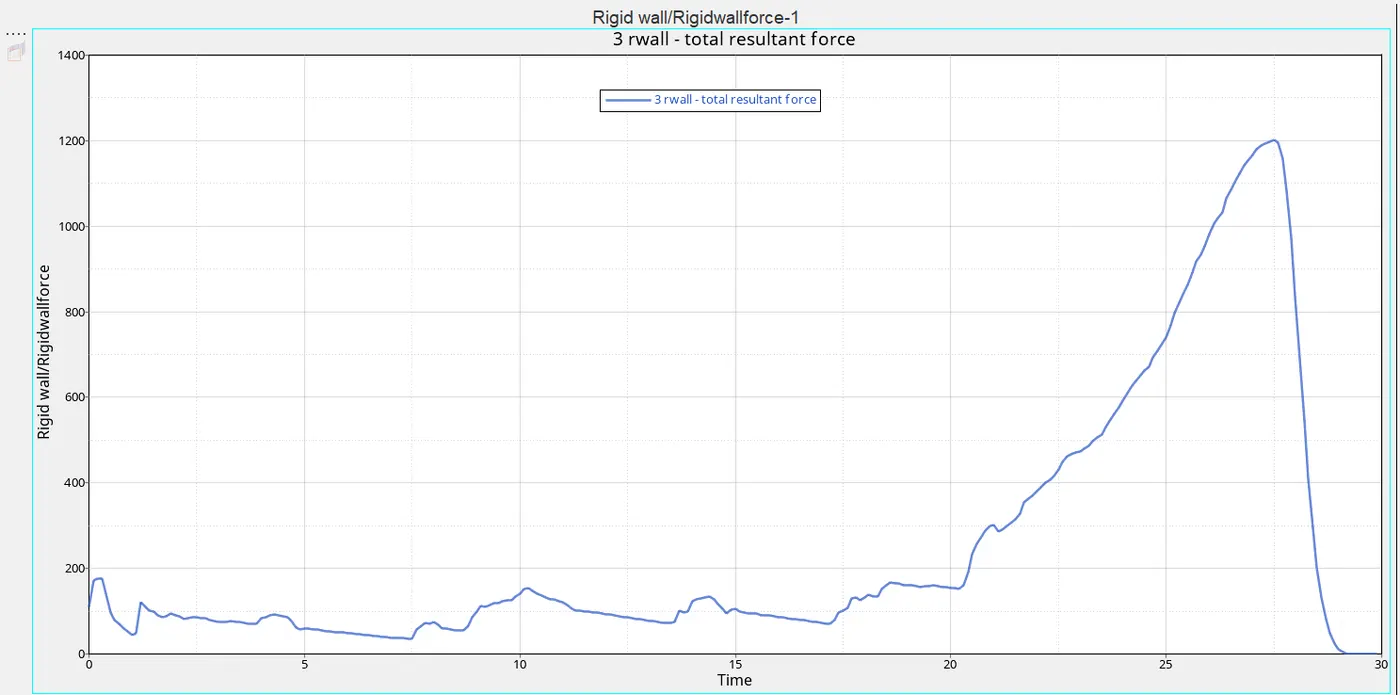
Fig: Rigidwall force
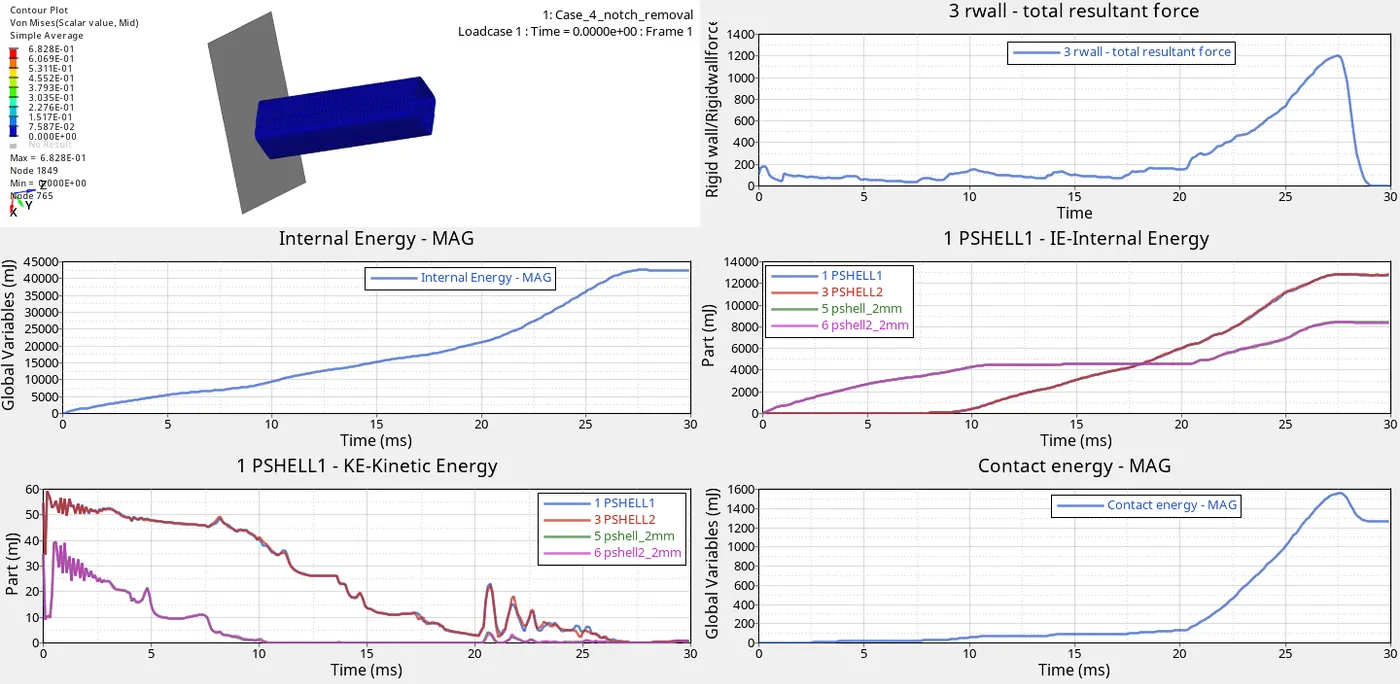
- A rigid wall force is created when the tube is crashed on the wall it creates some force. This above plot shows that a gradual increase flow of force is obtained in the initial stage and a sudden peak occurs up to elements fail and it again decreases because the rebound force is created after the failure of the element.
- Here the maximum rise in force is 1200N at the time of 27ms, it occurs while in the complete deformation of elements. Then it decreased due to rebound force acting after the element failure.
- Comparing with case1 and case2 this force is low because the removal of notch leads to element deformation in better form.
INTERNAL ENERGY:
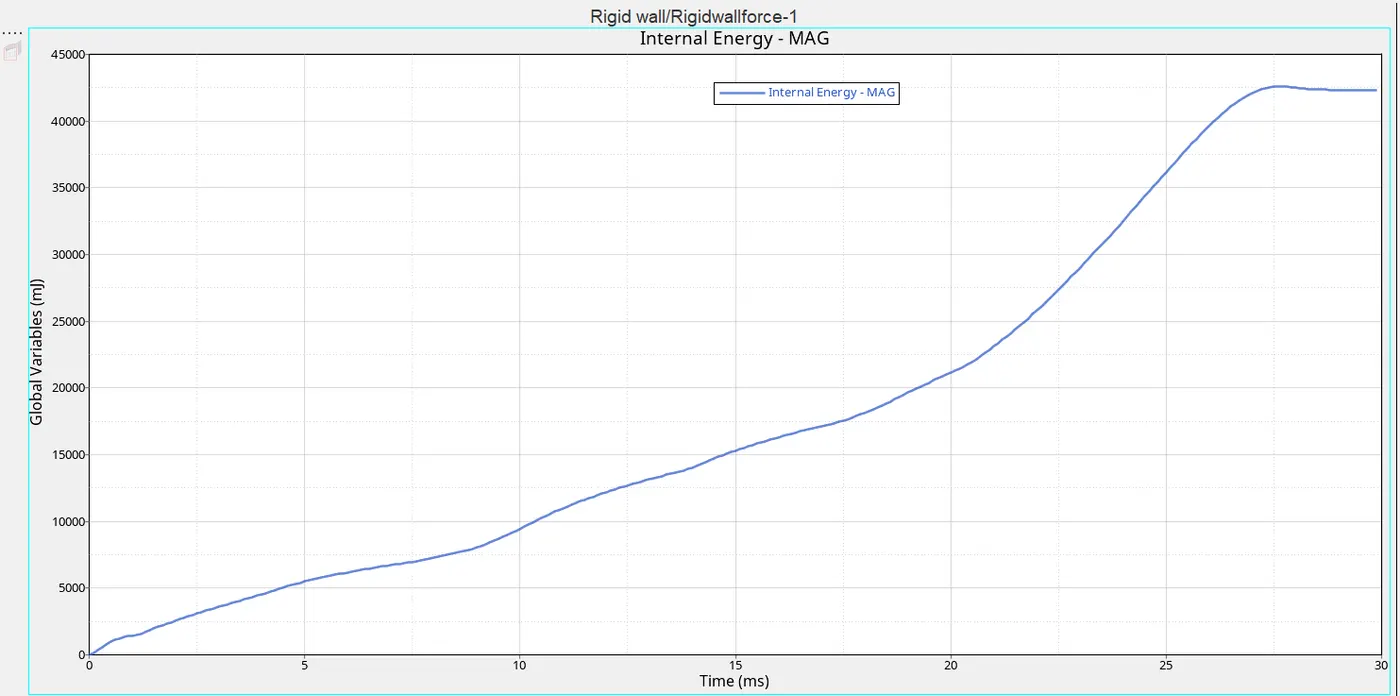
Fig: Internal Energy Plot
- This energy plot shows that increase in energy while the tube crashed on the rigid wall because of the contacts in the element it rises and after it reaches the maximum hitting point it will flow constantly.
- When the internal energy is observed due to contact of the tube and rigid wall. During the crash, there is a velocity is acted along the tube and it creates internal energy, after the completion of failure in the element it will remain stable.
- It reaches above 42000mJ when the time of 25ms and after that there is no velocity is acting on the tube so it keeps the constant flow.
KINETIC ENERGY:
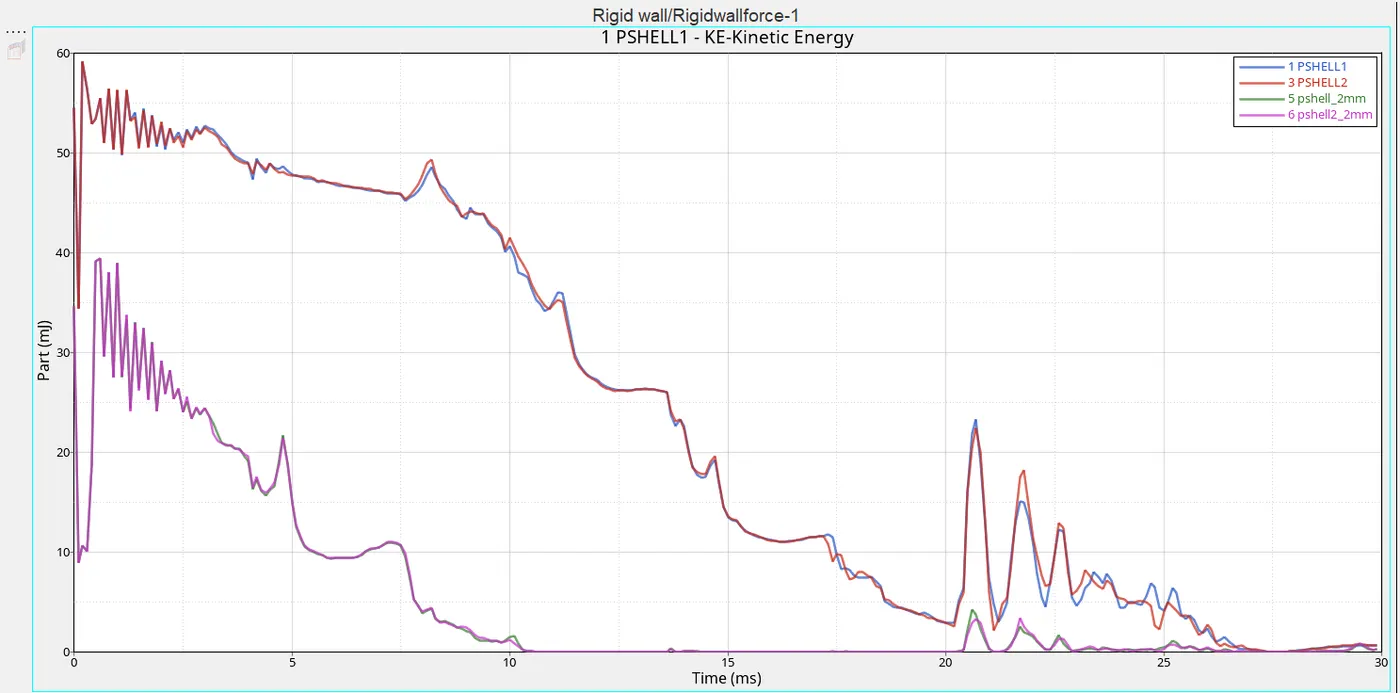
Fig: Kinetic Energy Plot
- In this energy, the plot shows that while the kinetic energy is acting between the tube and the rigid wall, In the initial stage there is an decrease in energy flow because the velocity of the tube is acted in a wall that increases the internal energy so kinetic energy is decreased.
- After it reaches 20ms a small peak is occurred suddenly due to the rebound force acted on the portion.
- But this case among four part the two part energy is varied because the shell thickness for boundary condition side part is 3mm and the wall side part is 2mm hence the wall side part will deform quickly compared with other two parts.
CONTACT ENERGY:
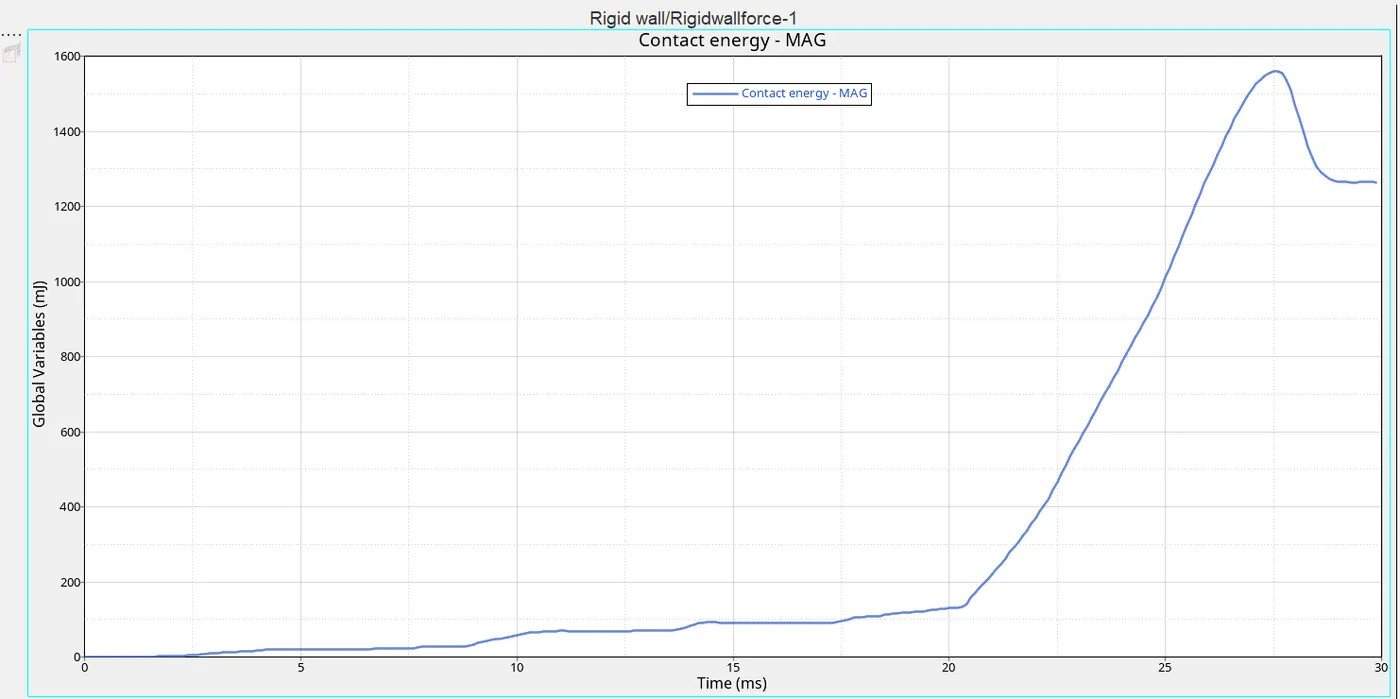
Fig: Contact Energy Plot
- The above figure shows that the contact energy is slightly varying at the beginning which defines the deformation occurred is slow and increasing after 18ms which reaches at the peak of 1600 mJ at the time of 27ms where there is a large deformation has occurred.
- Comparing with case1 and case2 this force is low because the removal of the notch.
TOTAL PLOTS:
CASE-5
- In this case, the same procedures are followed as case-1 first we want to import the model then create TH_part and select the four components. Here a new notch in the middle and tun the simulation.
- The created middle notch is shown as below,
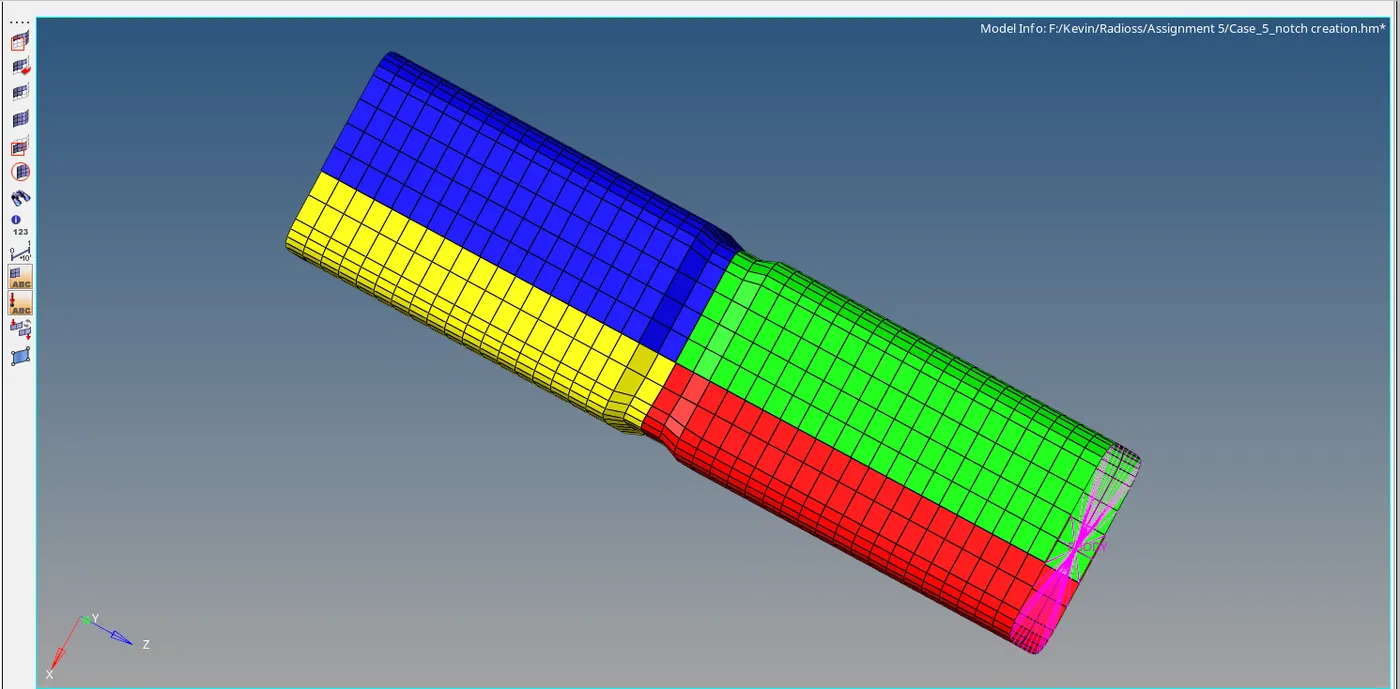
Fig: Middle notch model
- Now we want to run the model by selecting the Tool>radioss>select the input file>and click radioss option to run the simulation that dialog box is shown as below,
- To increase the speed of simulation we can type with a command ie, -nt 4
- Hence the result is obtained in the respective given folder, open the folder, and analysis the errors like energy error and mass error. These errors are shown in the Engine Out file that is shown below,
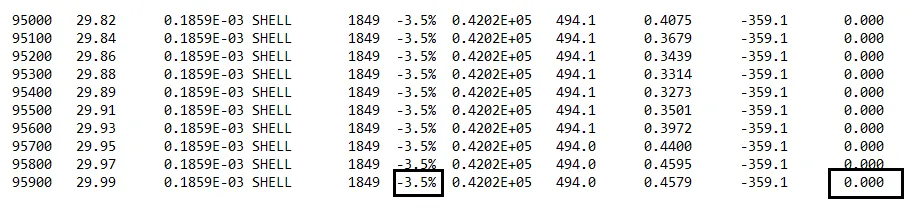
Fig: Energy error and Mass error
- Here the result shows the two errors, energy error as -3.5% and mass error as 0.000 %. An energy error should be in -5% is considered as better for simulation.
- The total number of cycles and the simulation time also noticed in that output and the values are shown below,
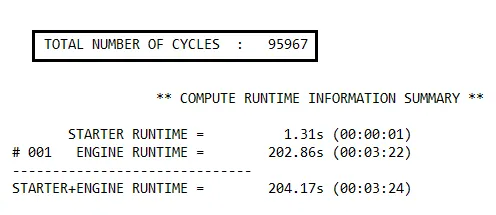
Fig: CycleTime
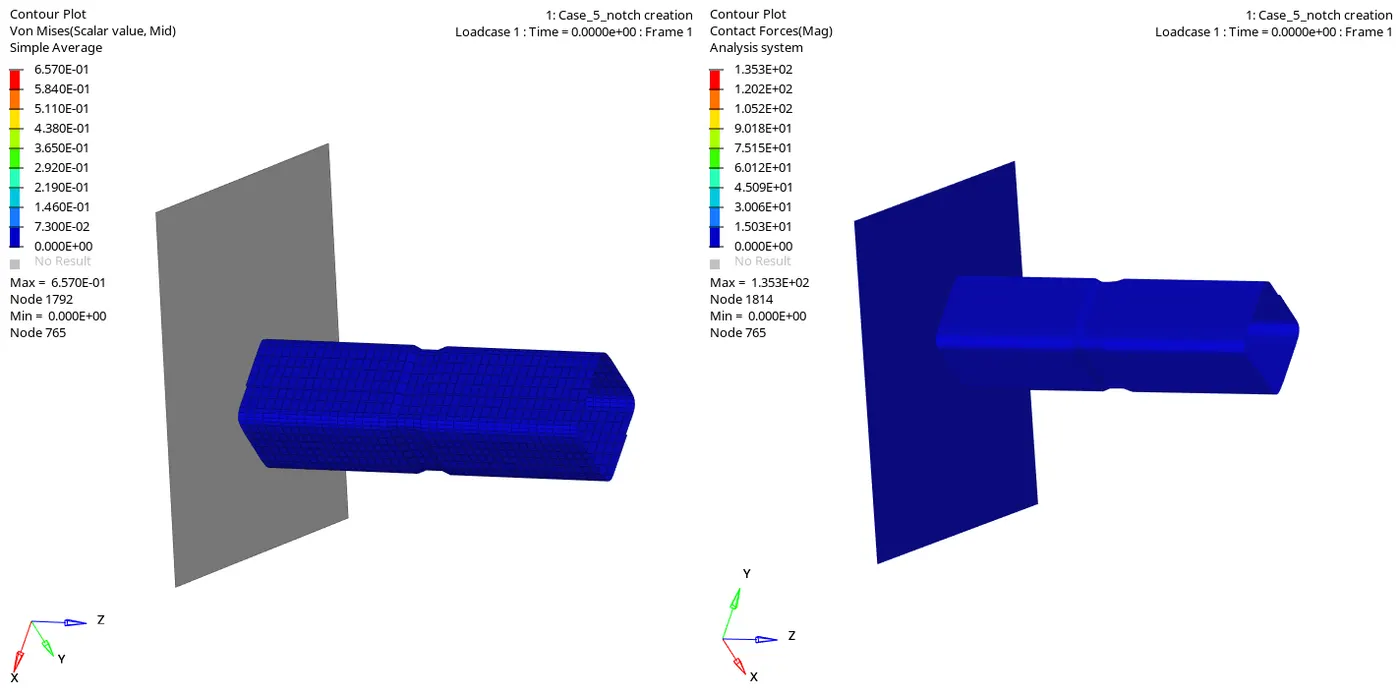
Fig: Vonmises stress Contour Plot Vs Contact forces plot
- In this case, we want to create the contact force of the tube while crashing on a rigid wall so change the result type as contact forces and click apply to get the animation of the crush tube on a rigid wall.
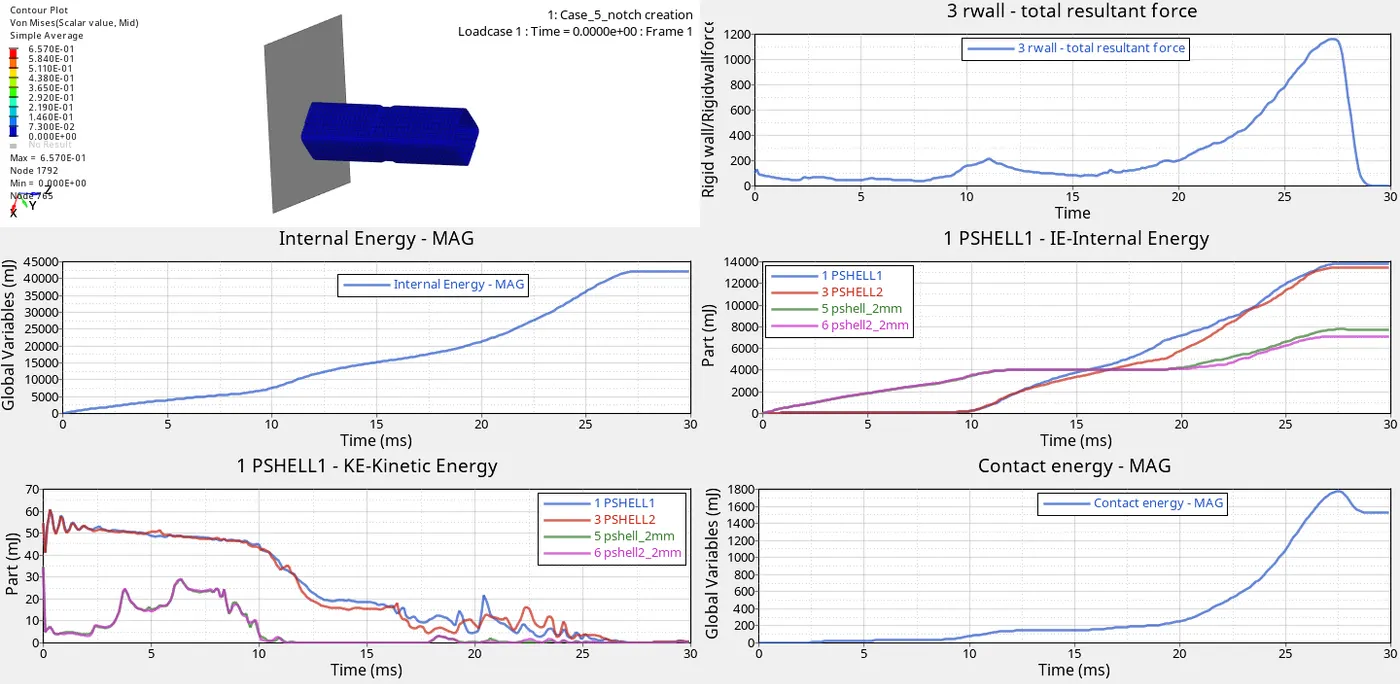
- Here above Von mises stress plot shows that the maximum value of stress is 6.570E-01Mpa and the minimum value of stress as 0 and the contact forces plot shows that the maximum value of contact force is 1.353E+02Mpa and the minimum value as 0 during the tube crashed in the rigid wall.
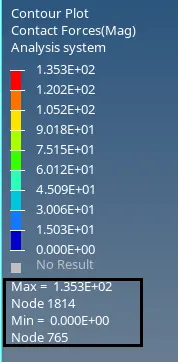
Fig: Contact forces
- Hence the max contact force is created from this simulation is 135.3N whereas the time history (TH) for all the components is created in order to study the deformation and energy variation in each component.
ENERGY PLOTS:
- To create the plot for each energy and absorbs that what was happening during the crash and how could the element gets deforming while applying some force. Now select hyperchart option that will give the empty graph as a display. Import the file case4 _create_notch_T01 and click the apply option.
RIGID WALL FORCE:
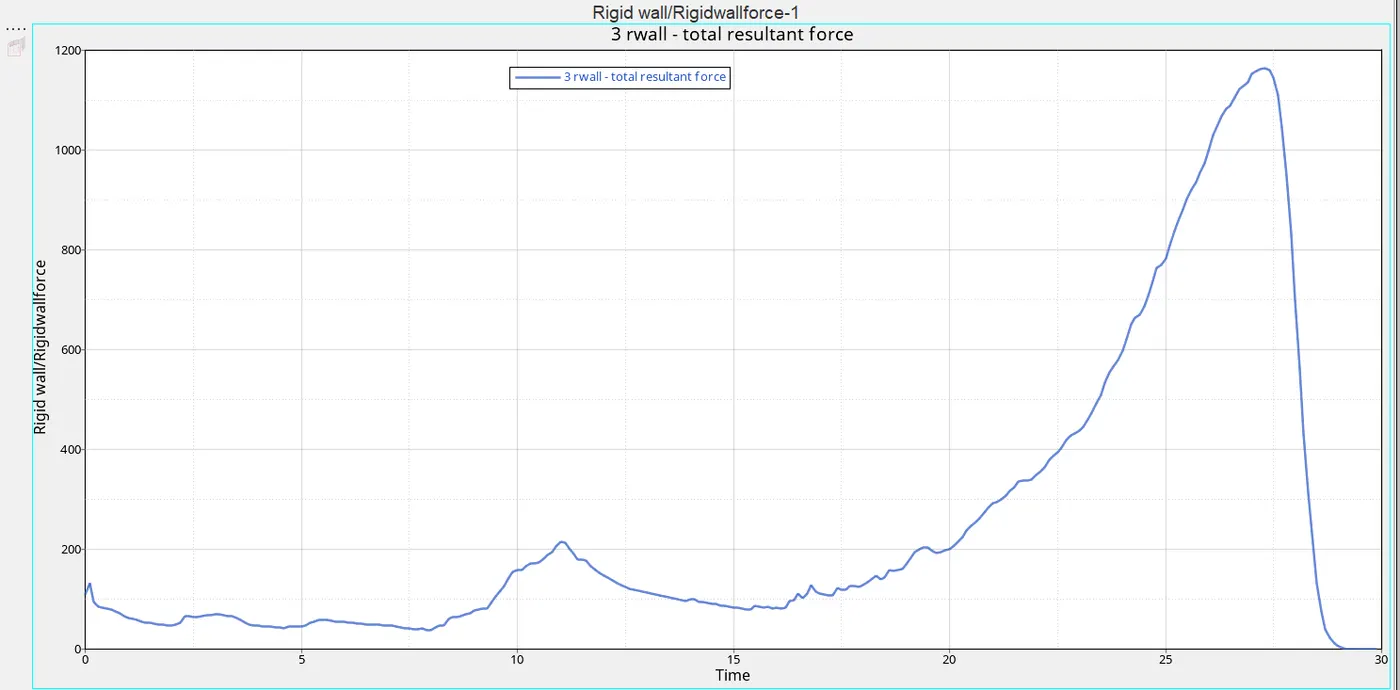
Fig: Rigidwall force
- A rigid wall force is created when the tube is crashed on the wall it creates some force. This above plot shows that a gradual increase flow of force is obtained in the initial stage and a sudden peak occurs up to elements fail and it again decreases because the rebound force is created after the failure of the element.
- Here the maximum rise in force is 1200N at the time of 27ms, it occurs while in the complete deformation of elements. Then it decreased due to rebound force acting after the element failure.
- Comparing with case1 and case2 this force is low.
INTERNAL ENERGY:
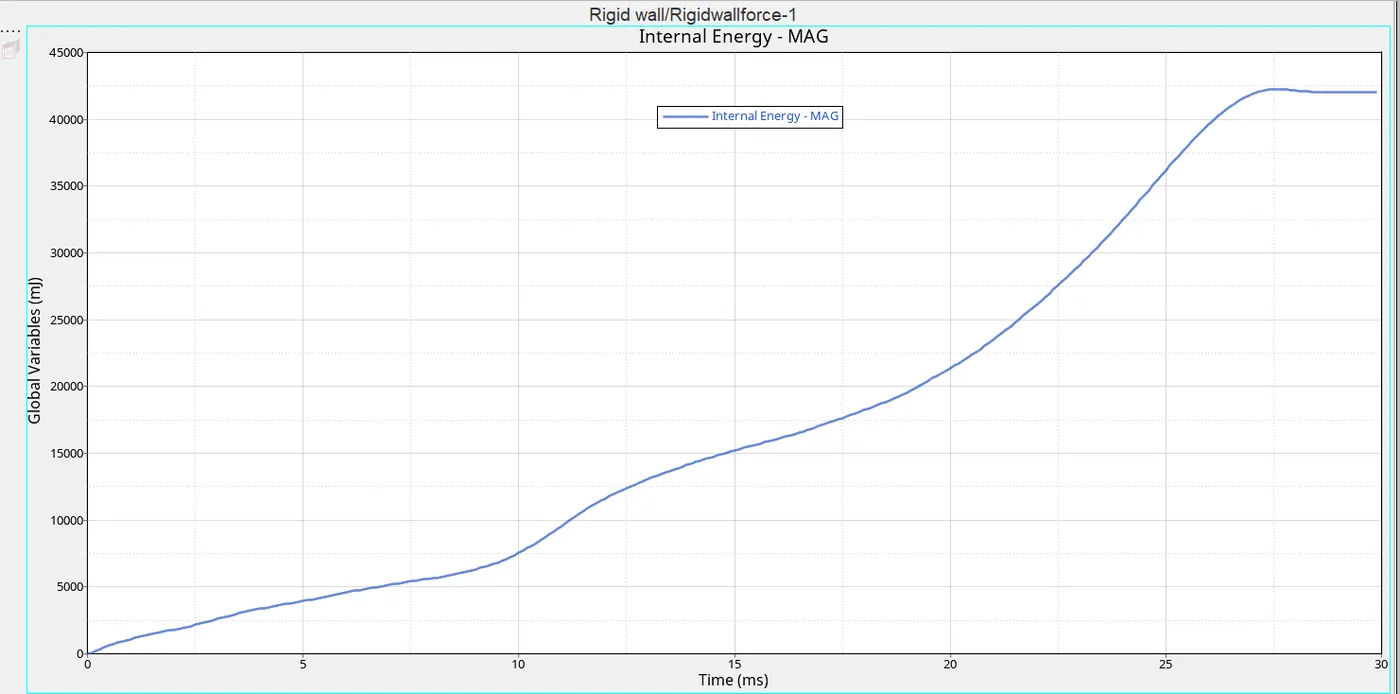
Fig: Internal Energy Plot
- This energy plot shows that increase in energy while the tube crashed on the rigid wall because of the contacts in the element it rises and after it reaches the maximum hitting point it will flow constantly.
- When the internal energy is observed due to contact of the tube and rigid wall. During the crash, there is a velocity is acted along the tube and it creates internal energy, after the completion of failure in the element it will remain stable.
- It reaches above 42000mJ when the time of 27ms and after that there is no velocity is acting on the tube so it keeps the constant flow.
KINETIC ENERGY:
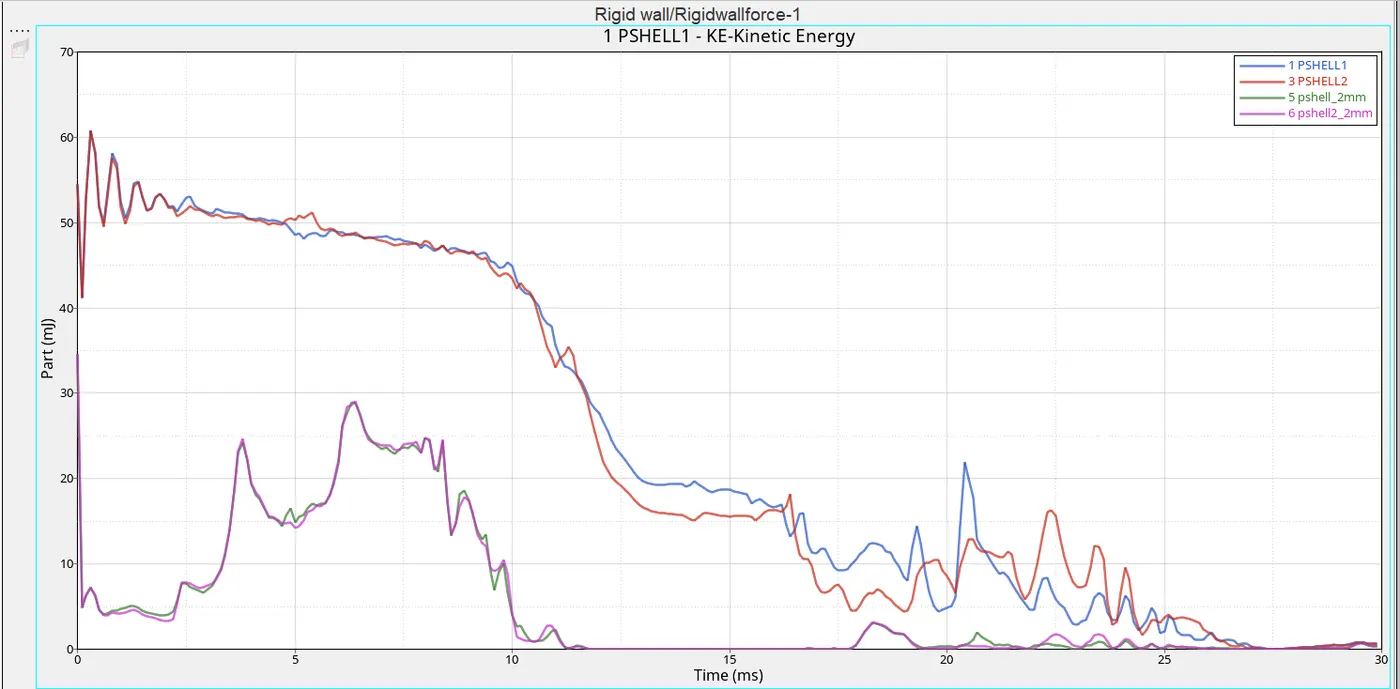
- In this energy, the plot shows that while the kinetic energy is acting between the tube and the rigid wall, In the initial stage there is an decrease in energy flow because the velocity of the tube is acted in a wall that increases the internal energy so kinetic energy is decreased.
- After it reaches 20ms a small peak is occurred suddenly due to the rebound force acted on the portion.
- But this case among four part the two part energy is varied because the shell thickness for the boundary condition side part is 3mm and the wall side part is 2mm hence the wall side part will deform quickly compared with other two parts.
CONTACT ENERGY:
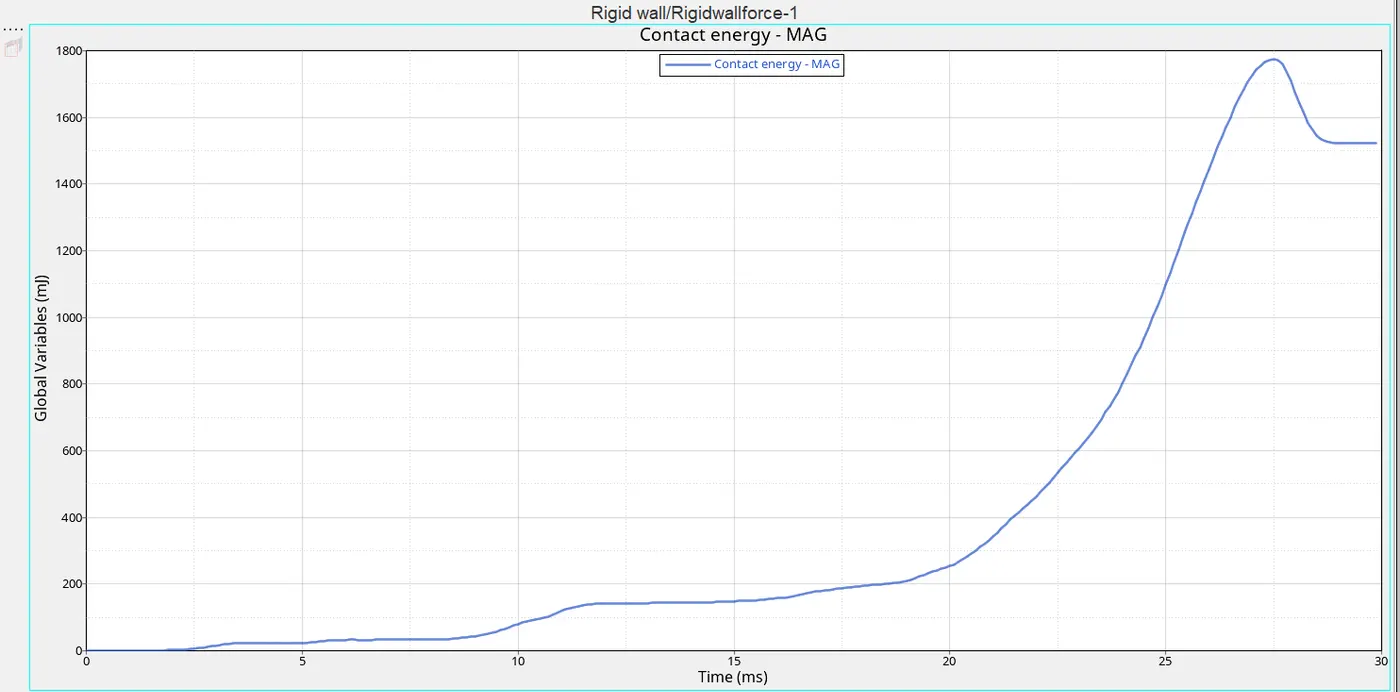
Fig: Contact Energy Plot
- The above figure shows that the contact energy is slightly varying at the beginning which defines the deformation occurred is slow and increasing after 18ms which reaches at the peak of 1600 mJ at the time of 27ms where there is a large deformation has occurred.
- Comparing with case1 and case2 this force is low because of the removal of the notch.
TOTAL PLOTS:
CASE-6
- In this case, the same procedures are followed as case-1 first we want to import the model then create TH_part and select the four components. Here a new notch is created on the opposing side of two faces and run the simulation.
- The created opposing notch is shown as below,
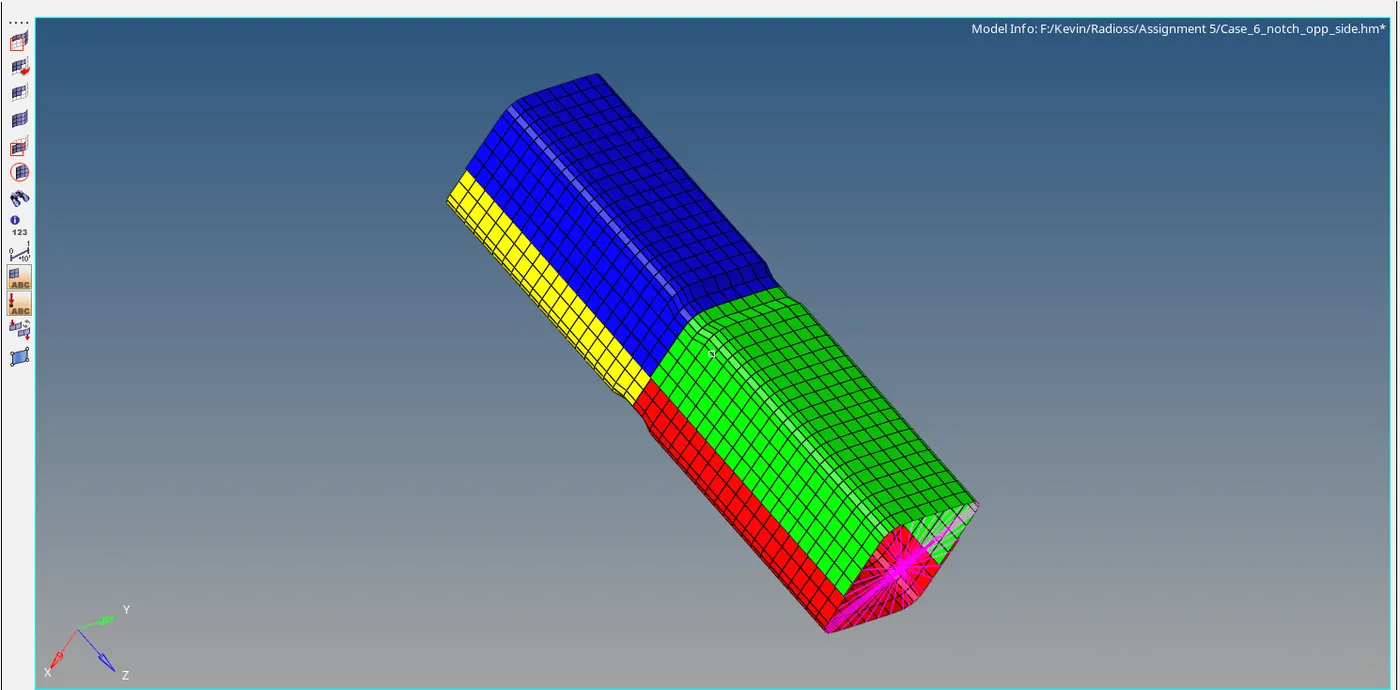
Fig: Opposing notch model
- Now we want to run the model by selecting the Tool>radioss>select the input file>and click radioss option to run the simulation that dialog box is shown as below,
- To increase the speed of simulation we can type with a command ie, -nt 4
- Hence the result is obtained in the respective given folder, open the folder, and analysis the errors like energy error and mass error. These errors are shown in the Engine Out file that is shown below,

Fig: Energy error and Mass error
- Here the result shows the two errors, energy error as -3.5% and mass error as 0.000 %. An energy error should be in -5% is considered as better for simulation.
- The total number of cycles and the simulation time also noticed in that output and the values are shown below,
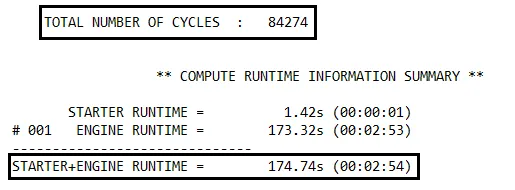
Fig: CycleTime
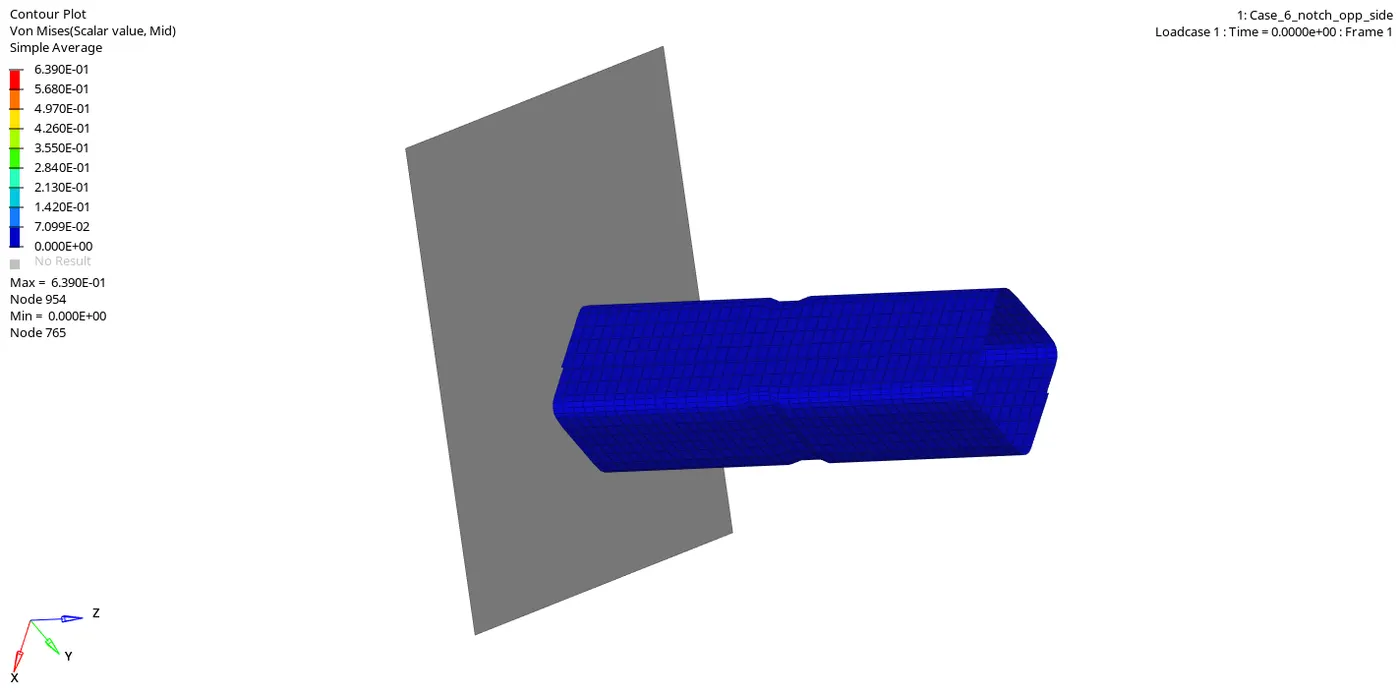
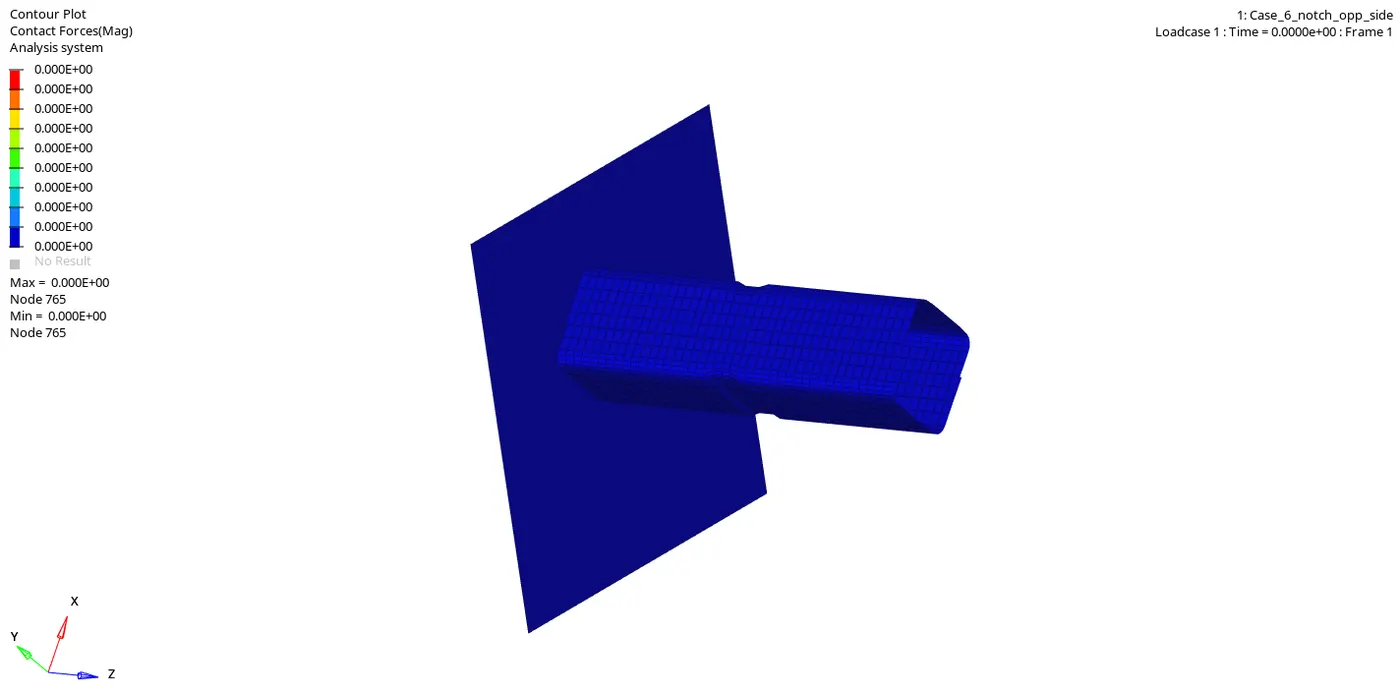
Fig: Vonmises stress Contour Plot Vs Contact forces plot
- In this case, we want to create the contact force of the tube while crashing on a rigid wall so change the result type as contact forces and click apply to get the animation of the crush tube on a rigid wall.
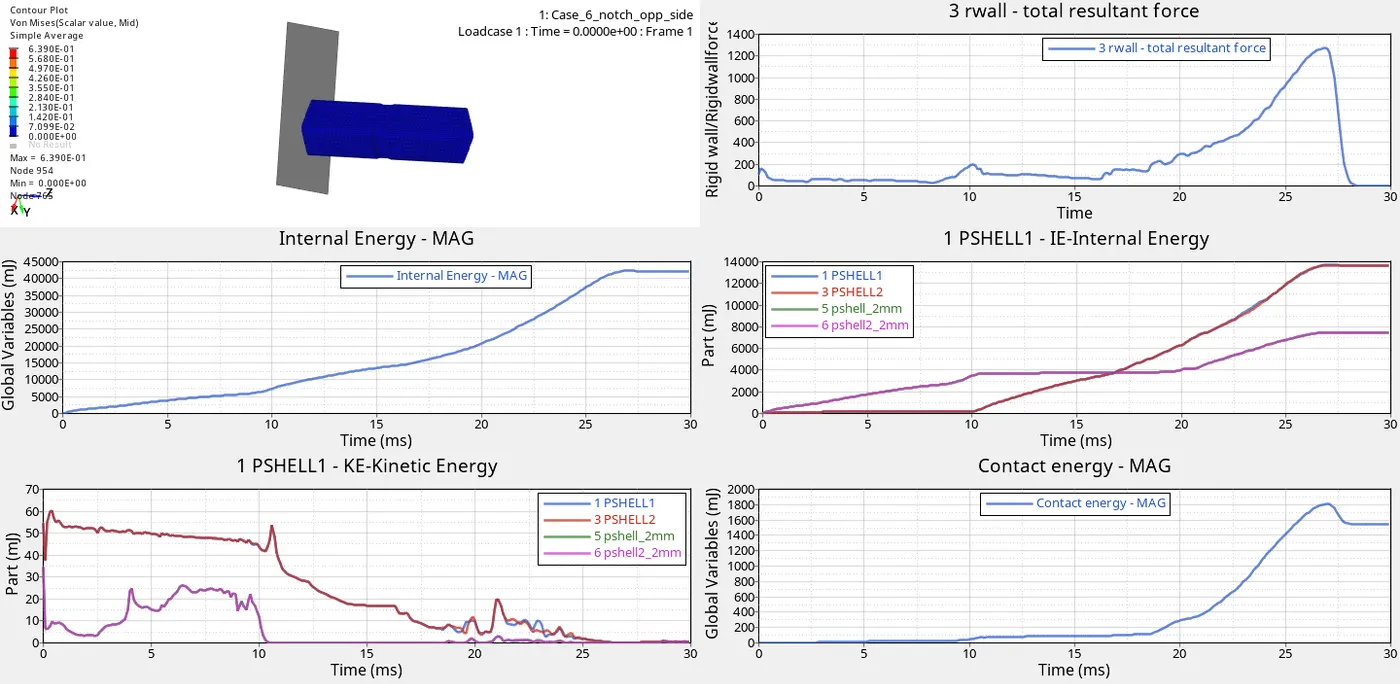
- Here above Von mises stress plot shows that the maximum value of stress is 6.390E-01Mpa and the minimum value of stress as 0 and the contact forces plot shows that the maximum value of contact force is 8.652E+01Mpa and the minimum value as 0 during the tube crashed in the rigid wall.
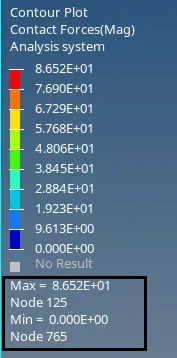
Fig: Contact forces
- Hence the max contact force is created from this simulation is 86.52N whereas the time history (TH) for all the components is created in order to study the deformation and energy variation in each component.
ENERGY PLOTS:
- To create the plot for each energy and absorbs that what was happening during the crash and how could the element gets deforming while applying some force. Now select hyperchart option that will give the empty graph as a display. Import the file case4 _notch_opp_T01 and click the apply option.
RIGID WALL FORCE:
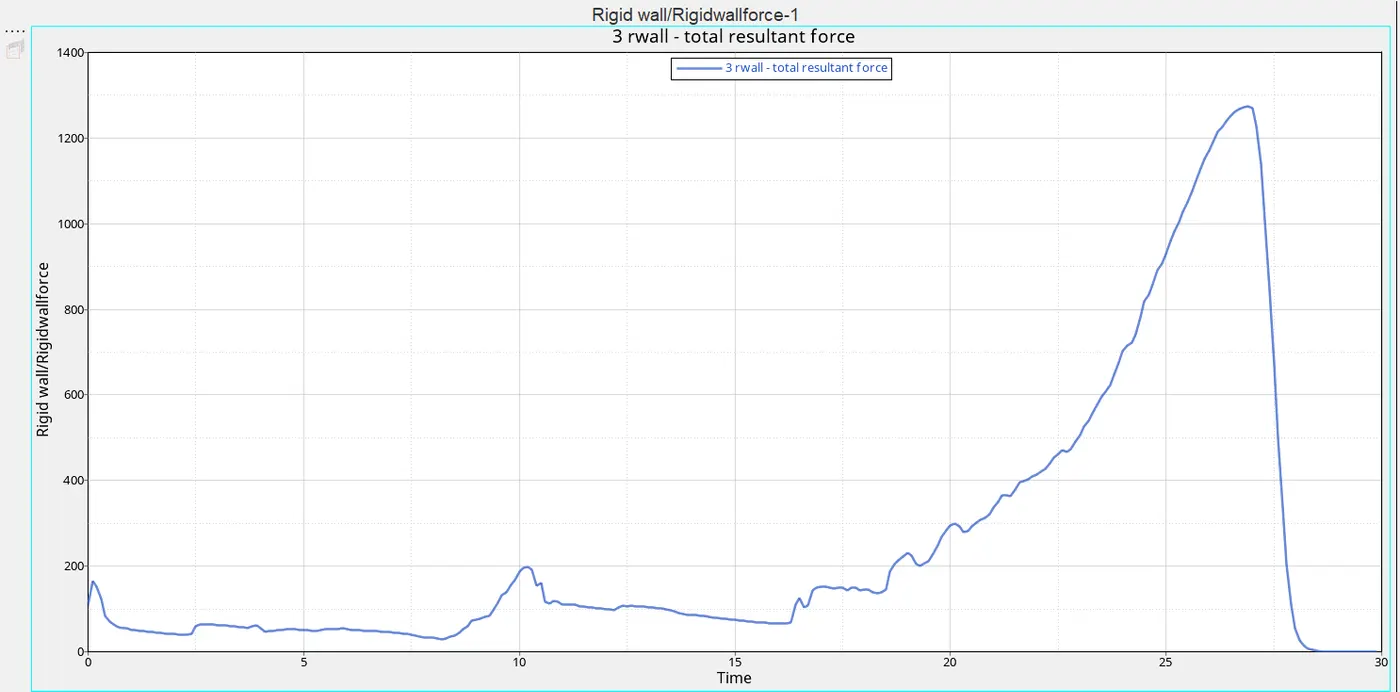
Fig: Rigidwall force
- A rigid wall force is created when the tube is crashed on the wall it creates some force. This above plot shows that a gradual increase flow of force is obtained in the initial stage and a sudden peak occurs up to elements fail and it again decreases because the rebound force is created after the failure of the element.
- Here the maximum rise in force is 1200N at the time of 27ms, it occurs while in the complete deformation of elements. Then it decreased due to rebound force acting after the element failure.
- Comparing with case1 and case2 this force is low.
INTERNAL ENERGY:
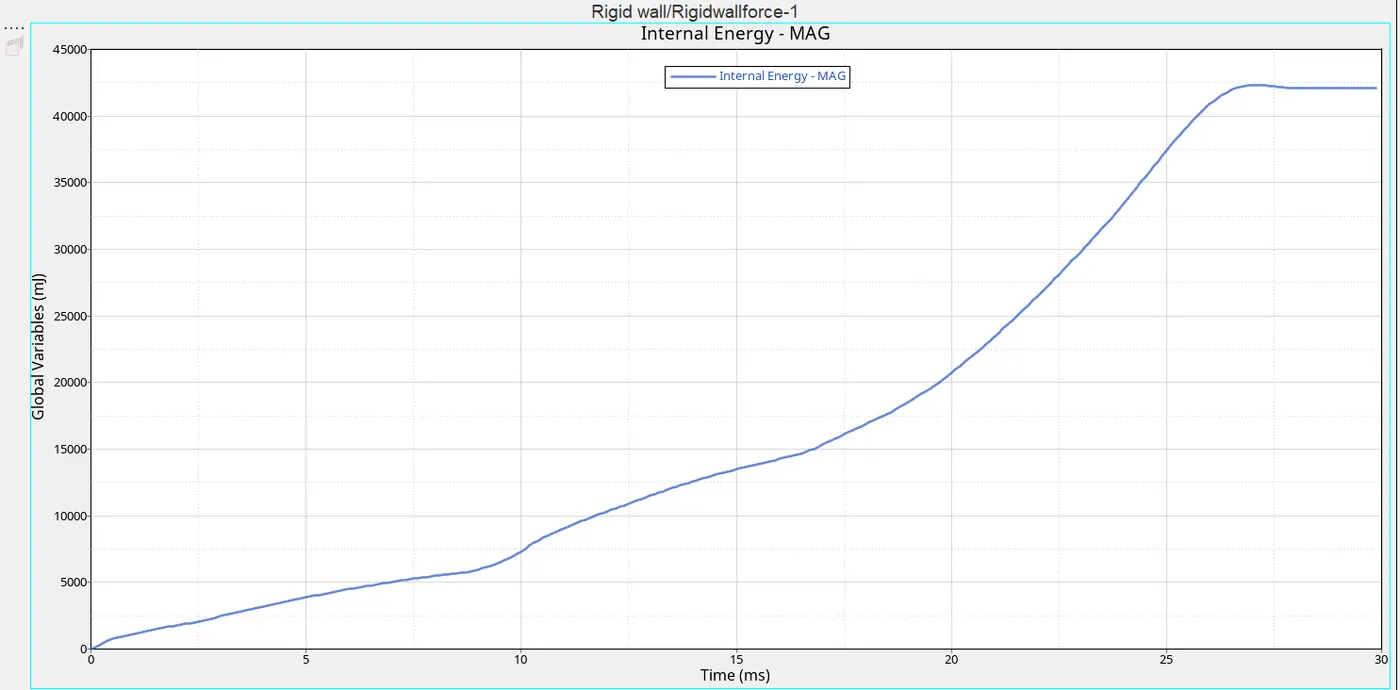
Fig: Internal Energy Plot
- This energy plot shows that increase in energy while the tube crashed on the rigid wall because of the contacts in the element it rises and after it reaches the maximum hitting point it will flow constantly.
- When the internal energy is observed due to contact of the tube and rigid wall. During the crash, there is a velocity is acted along the tube and it creates internal energy, after the completion of failure in the element it will remain stable.
- It reaches above 42000mJ when the time of 27ms and after that there is no velocity is acting on the tube so it keeps the constant flow.
KINETIC ENERGY:
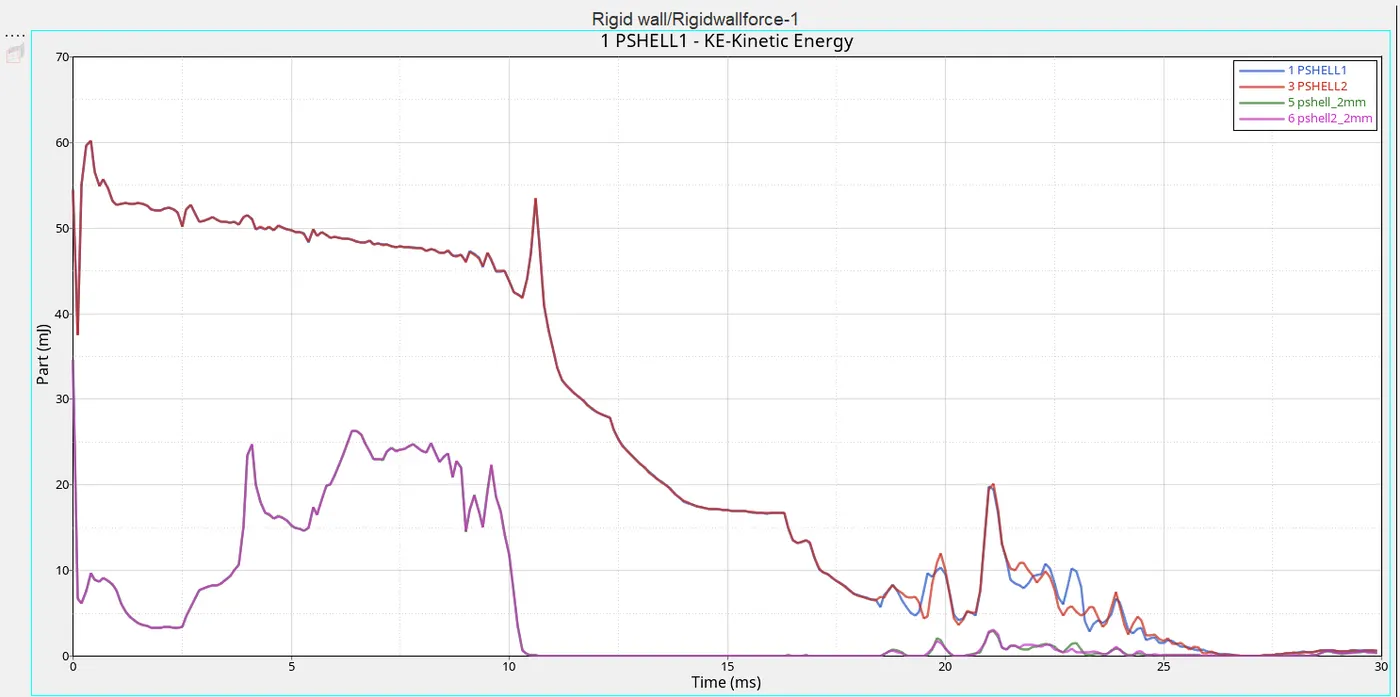
- In this energy, the plot shows that while the kinetic energy is acting between the tube and the rigid wall, In the initial stage there is an decrease in energy flow because the velocity of the tube is acted in a wall that increases the internal energy so kinetic energy is decreased.
- After it reaches 20ms a small peak is occurred suddenly due to the rebound force acted on the portion.
CONTACT ENERGY:
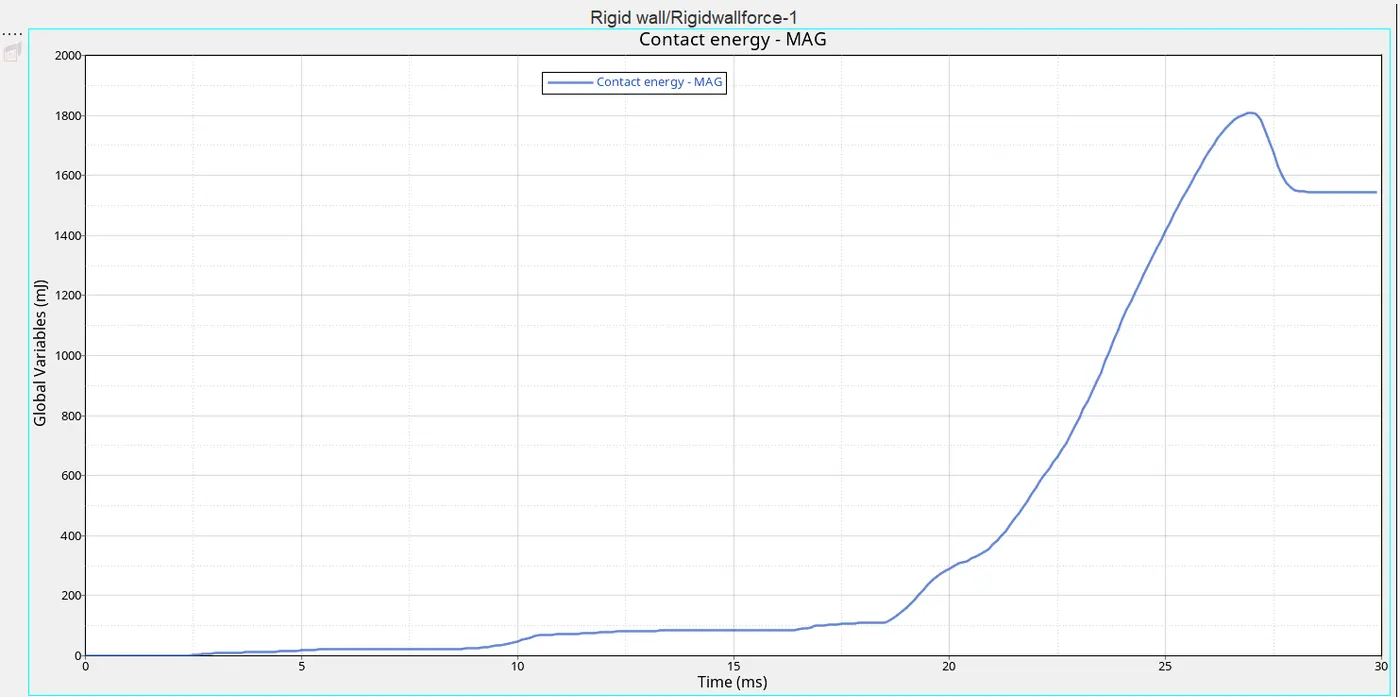
Fig: Contact Energy Plot
- The above figure shows that the contact energy is slightly varying at the beginning which defines the deformation occurred is slow and increasing after 20ms which reaches a peak of 1800 mJ at the time of 27ms where there is a large deformation has occurred.
TOTAL PLOTS:
COMPARING ALL 6 CASES:
COMPARISON OF CASE-1 AND CASE-2:
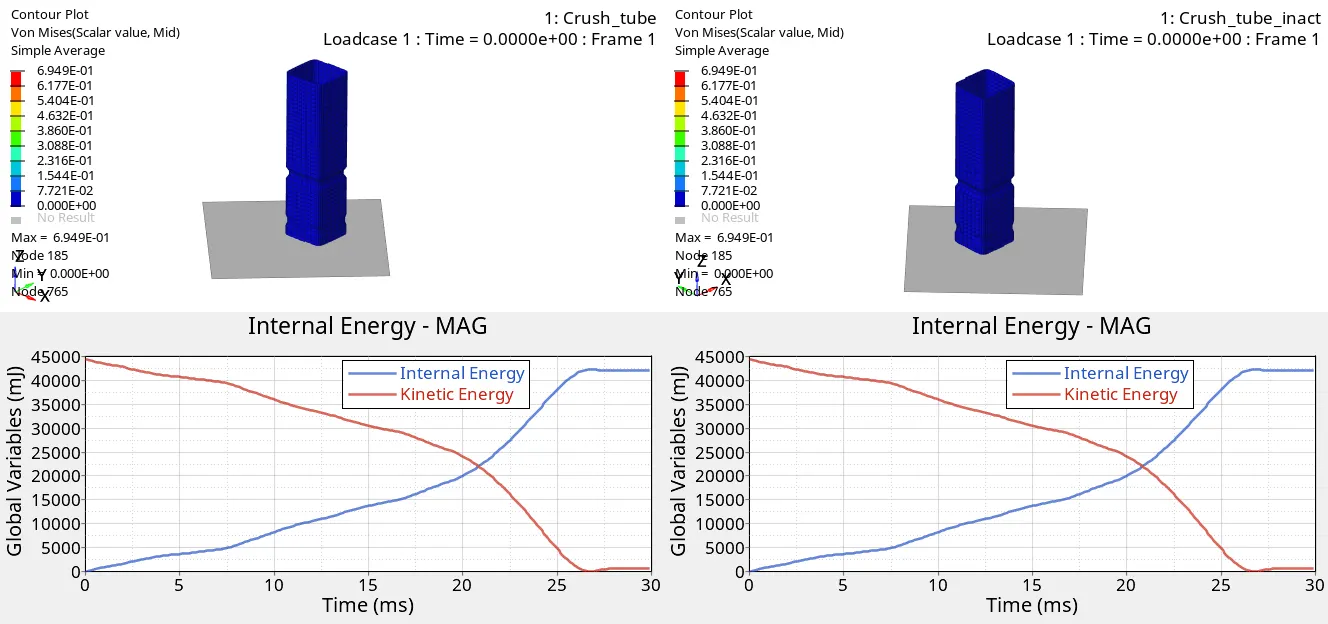
Comparing these two cases shows that there are no variations in the energy graph and maximum stress value because in case-2 we are changing the inactv = 6 here Inactiv refers Action to take if initial penetration exists.
Therefore both cases remain the same max stress value, contact force, and energy plots hence it shows there will be no initial penetration is acting on both cases.
COMPARISON OF CASE-1 AND CASE-3:
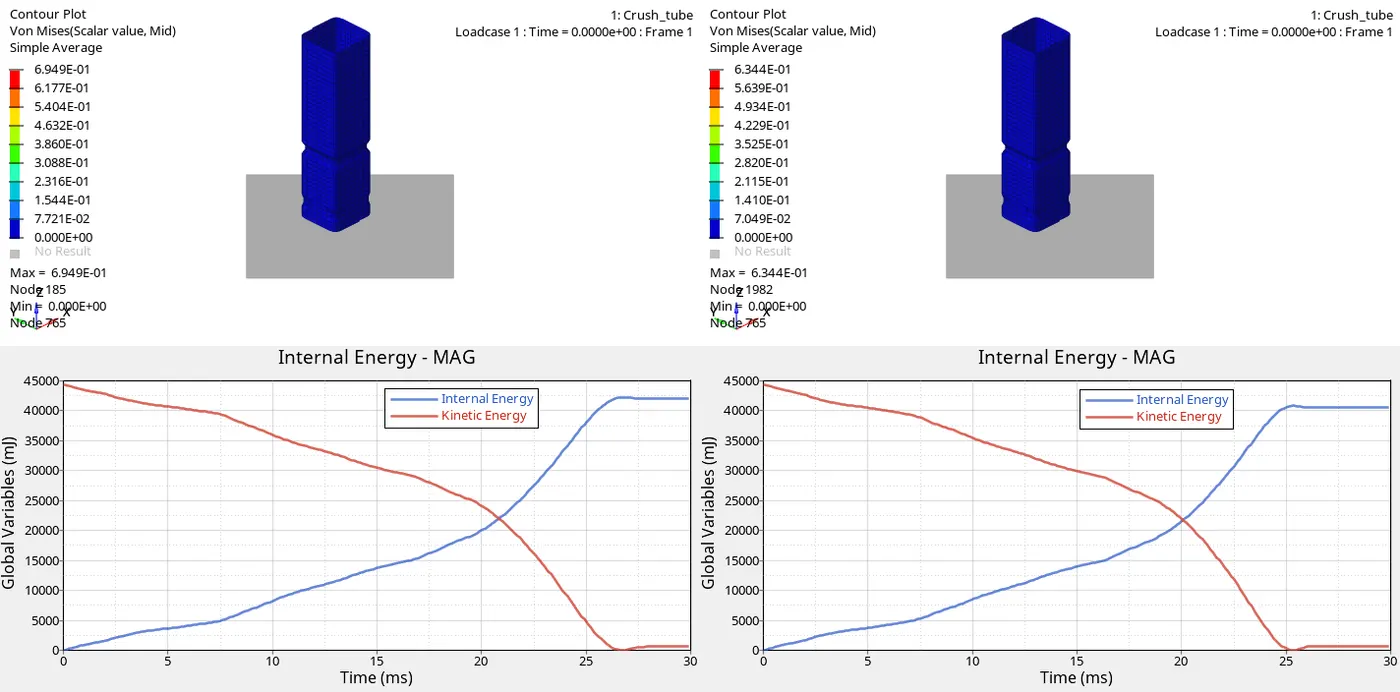
In case1 we are using the contact interface type as default 7 and then in case-3, we are using the contact interface type as type-7 and type-11 with the same recommended values.
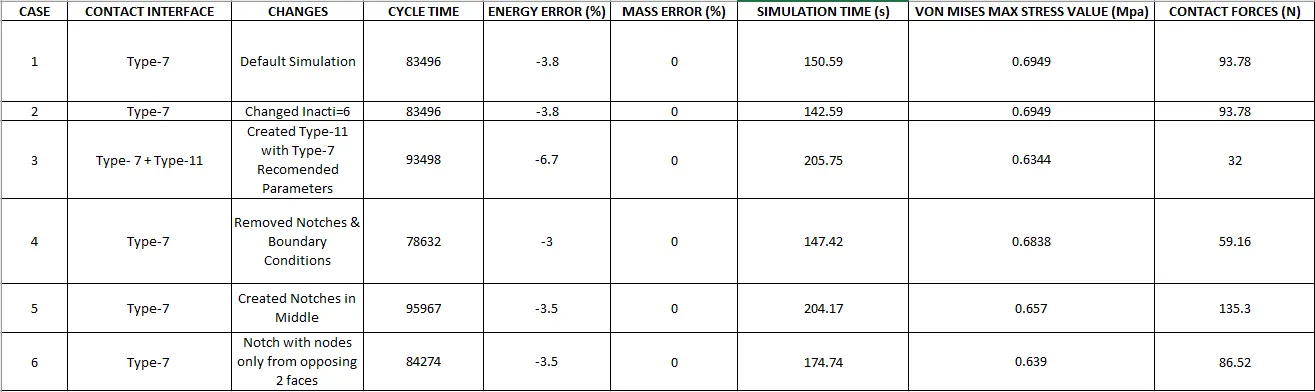
An observation for case-1 and case-3 shows that there will be more cycle time is observed in case3 comparing with case1 because of using the two type of contact interface.
Thus affects the energy error also in the case-3 as value (-6.7). An energy error should be in -5% is considered as better for simulation.
Simulation time(205.75s) also much more for case-3 comparing with case-1.
But the contact force in case-3 is less compare than case-3 because of using the two types of the contact interface.
COMPARISON OF CASE-4, CASE-5, AND CASE-6:
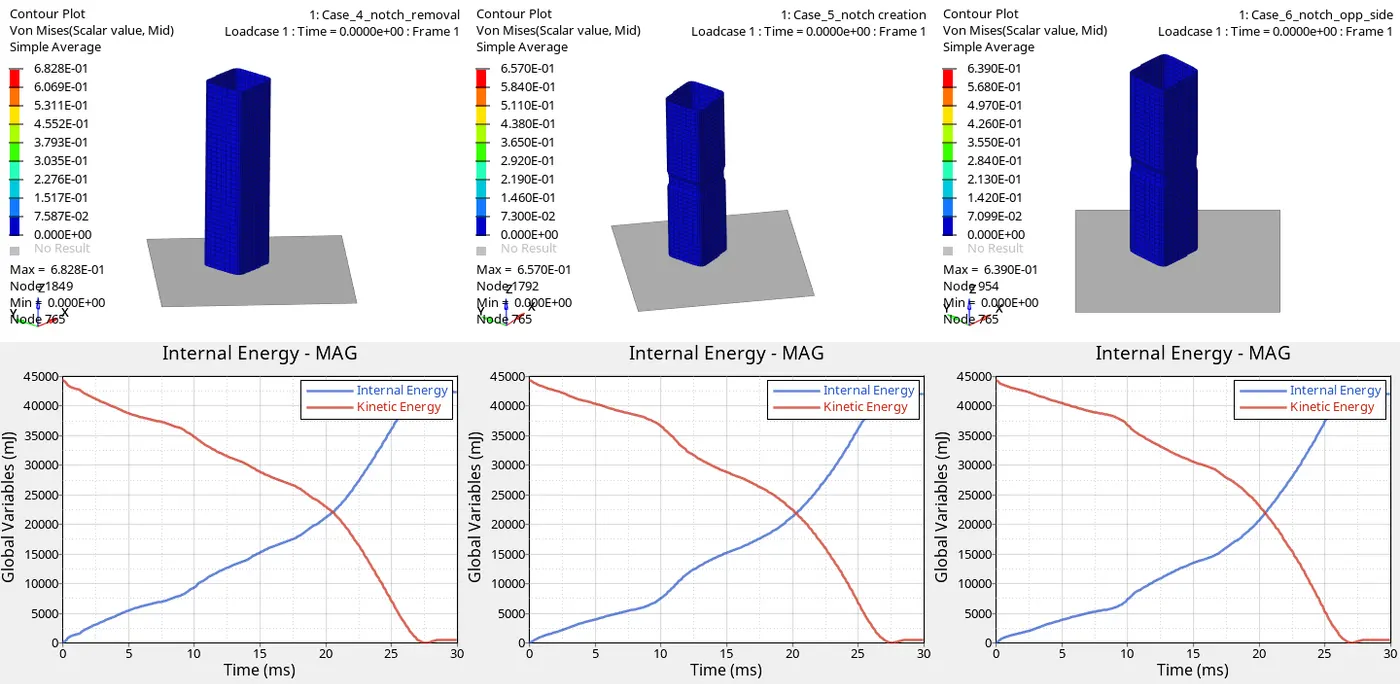
These three cases show that different values of energy errors plot energy and contact forces. In case-4 we are removing the notch totally and boundary conditions and observing the results that show both cycle time and simulation time for this case is low compared with the other two cases and the contact force is also low at a value of 59.16N. The energy plot shows while the internal energy decreases kinetic energy will be increased at the same flow of proportion.
In case-5 we are creating a new notch on the middle and observing the results that show both cycle time and simulation time for this case is high compared with the other two cases and the contact force is also high at the value of 135.3N. The energy plot shows while the internal energy decreases kinetic energy will be increased at the same flow of proportion.
In case-6 we are creating a new notch with nodes only from opposing 2 faces and run the simulation and observing the results that show both cycle time and simulation time for this case is high compared with case-4 and low compare with case-5 and the contact force value is 86.52N. The energy plot shows while the internal energy decreases kinetic energy will be increased at the same flow of proportion.
CONCLUSION:
Therefore all the simulation has been done, and the results are obtained by different energy plots based on the type of contact interface.
Hence the total number of cycles, Energy error, mass error, and simulation time are also obtained by the output file of simulation and they are mentioned in each case.
A comparison of six cases is also defined with different energy plot and contact forces.