Meshing a bumper assembly of a car in Hypermesh, and running simulations of a crush tube with various different parameters
Objective: A. To mesh the bumper assembly
B. To run the simulations with variations in initial penetration, contact type, and notch positions and document the different cases
Procedure:
A. Meshing the bumper model:
1. Import the model in Hyperworks in the Optistruct profile
2. Correct the geometrical discontinuities in the model by using Surface edit tools
3. Mesh the surfaces with element size of 6 mm
4. Mirror the model about the center along the Y axis to complete the bumper assembly. Check and correct equivalance after mirroring the elements.
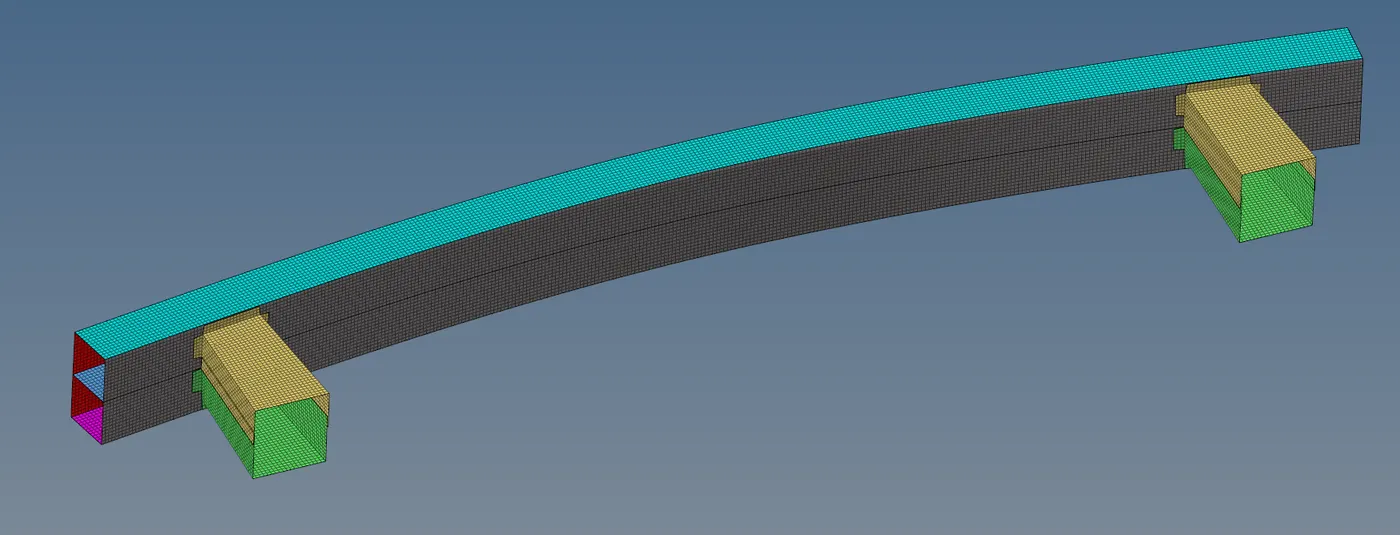
5. The final model looks as shown:
B. Running the crash tube simulations
In these simulations we will be documenting the effect of various variations on the simulation of crushing a tube.
The tube has notches on its outer surface as shown. A rigid body pushes the tube into a rigid wall on the right side.
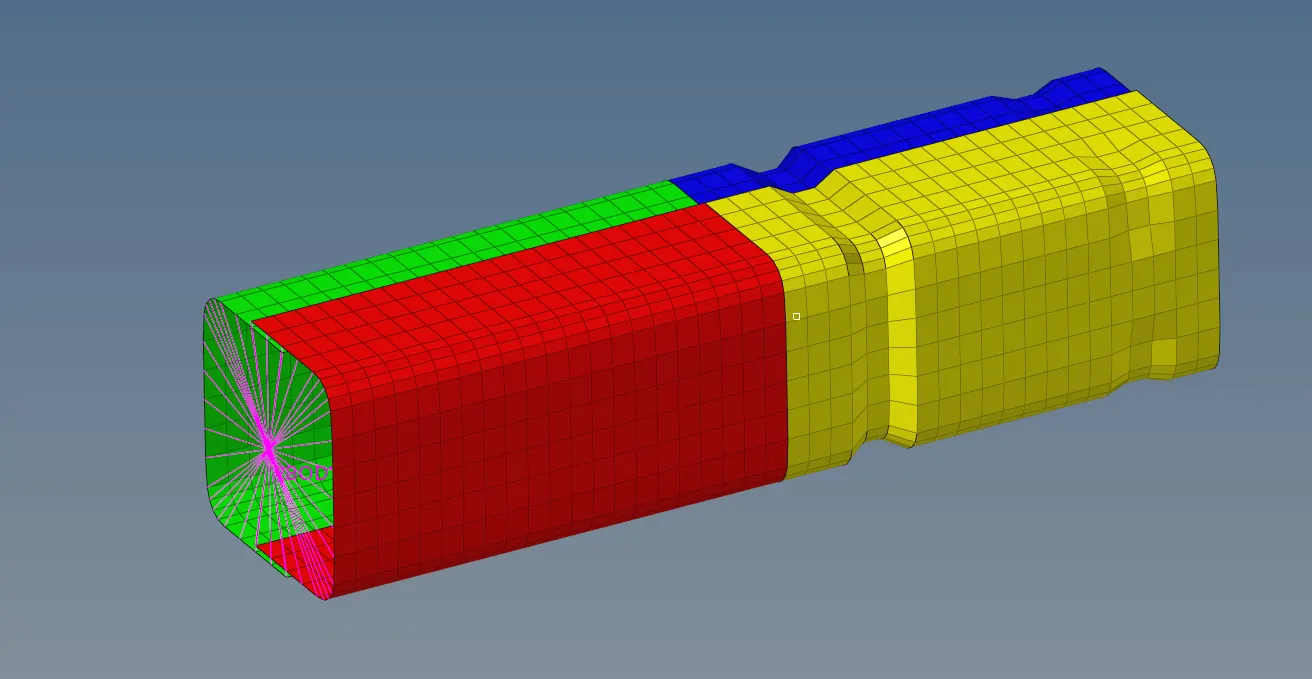
In case 1, we run the model as it is.
In case 2, we change the Inacti flag to 6.
Inacti is a flag that decides the action to be taken in case initial penetration exists in the model
Inacti=6 reduces and scales the gap in case of any initial penetration.
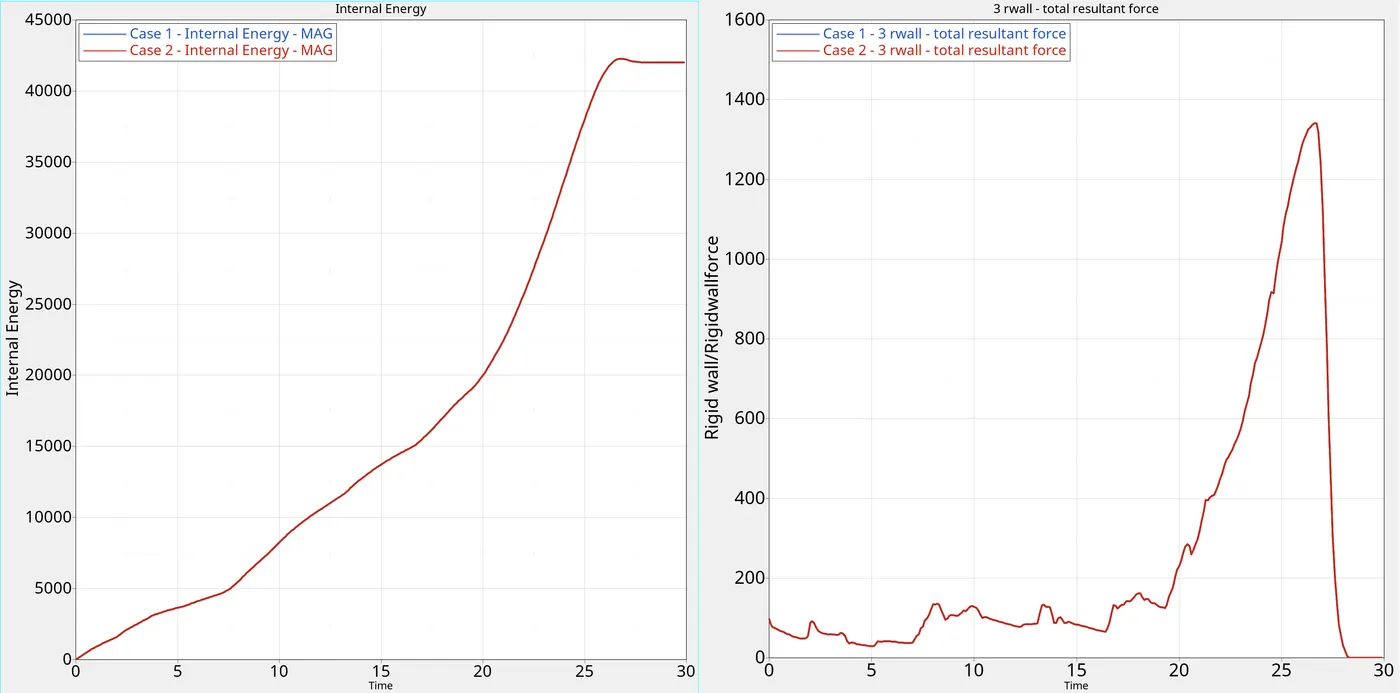
Now lets compare the simulations of case 1 and case 2
Internal Energy:
Contact Energy:
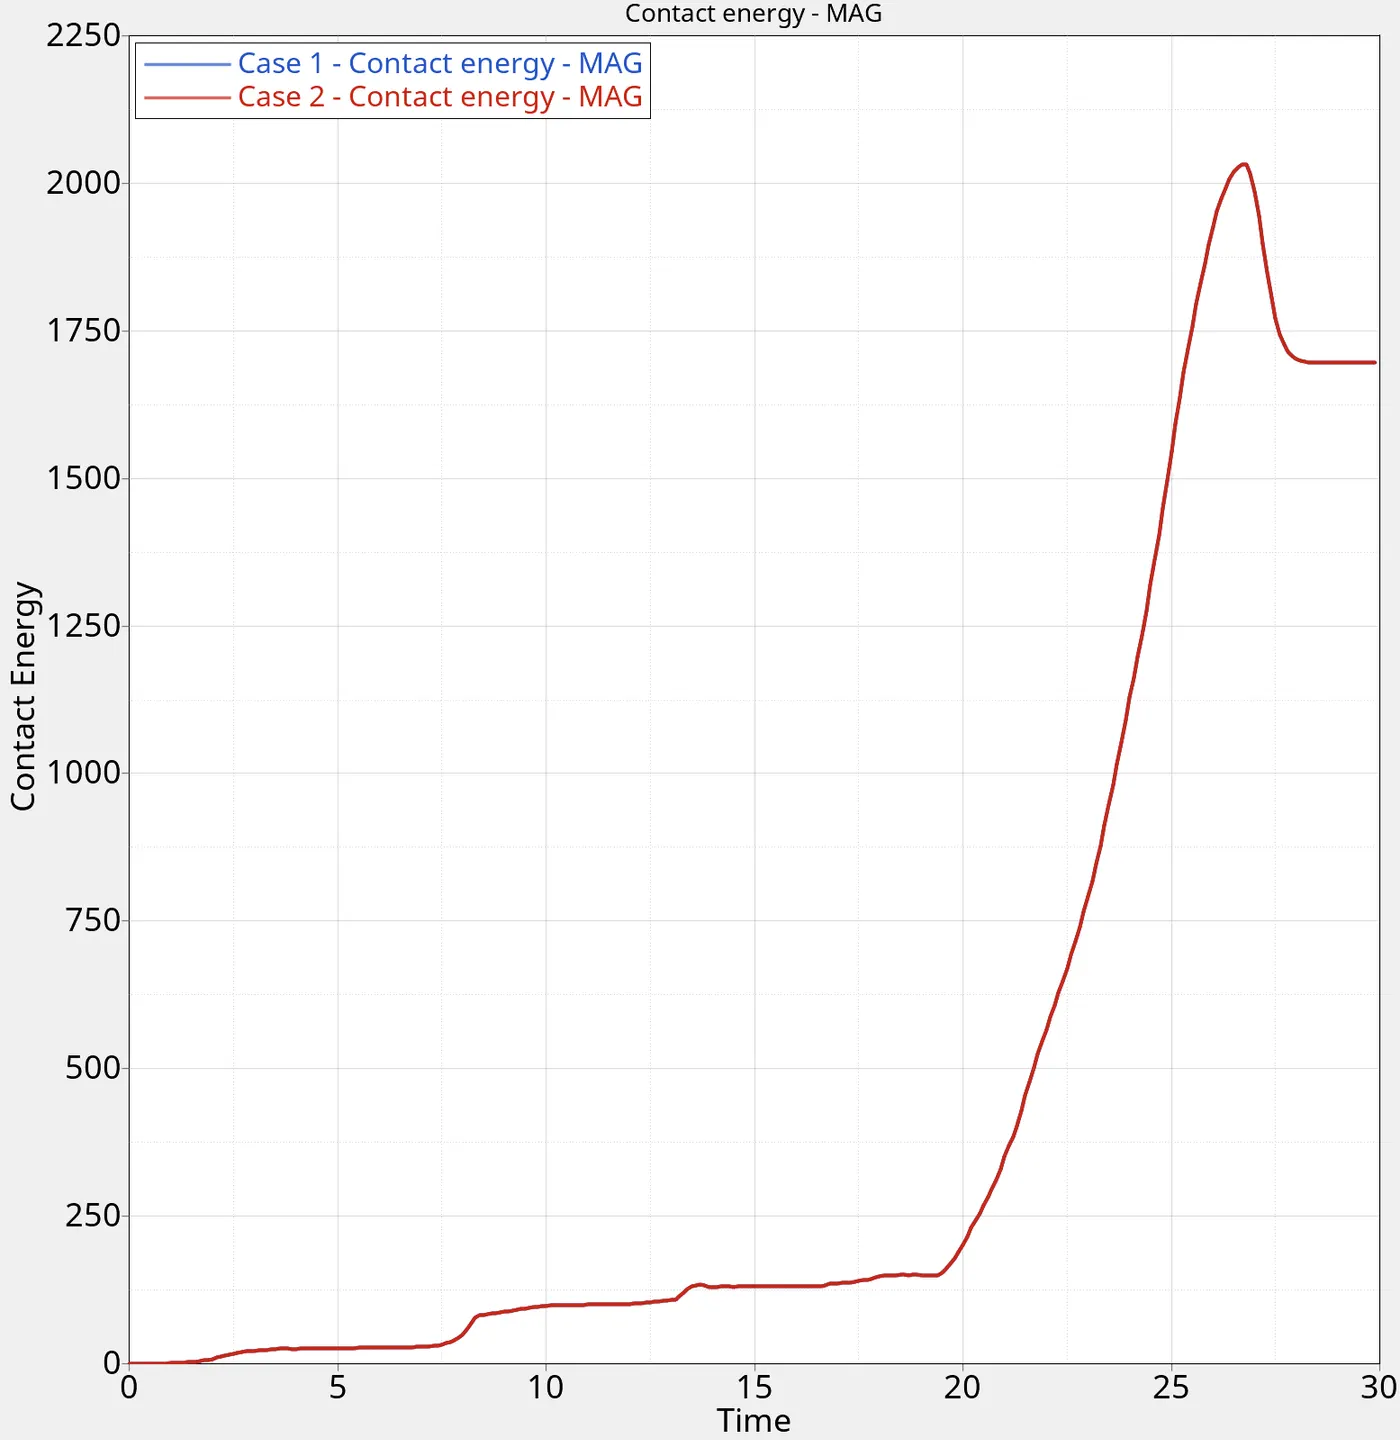
We can see that all three plots are exactly overlapping, hence it implies that there was no initial penetration in the model.
For Case 3 we are adding Type 11 contact type.
Type 11 is an edge to edge contact type, which is usually used to overcome the drawbacks of the Type 7 contact, which is the one used in previous 2 cases.
We apply this interface type to the model.
Since the model is intersecting with itself, The master and slave edges are same.
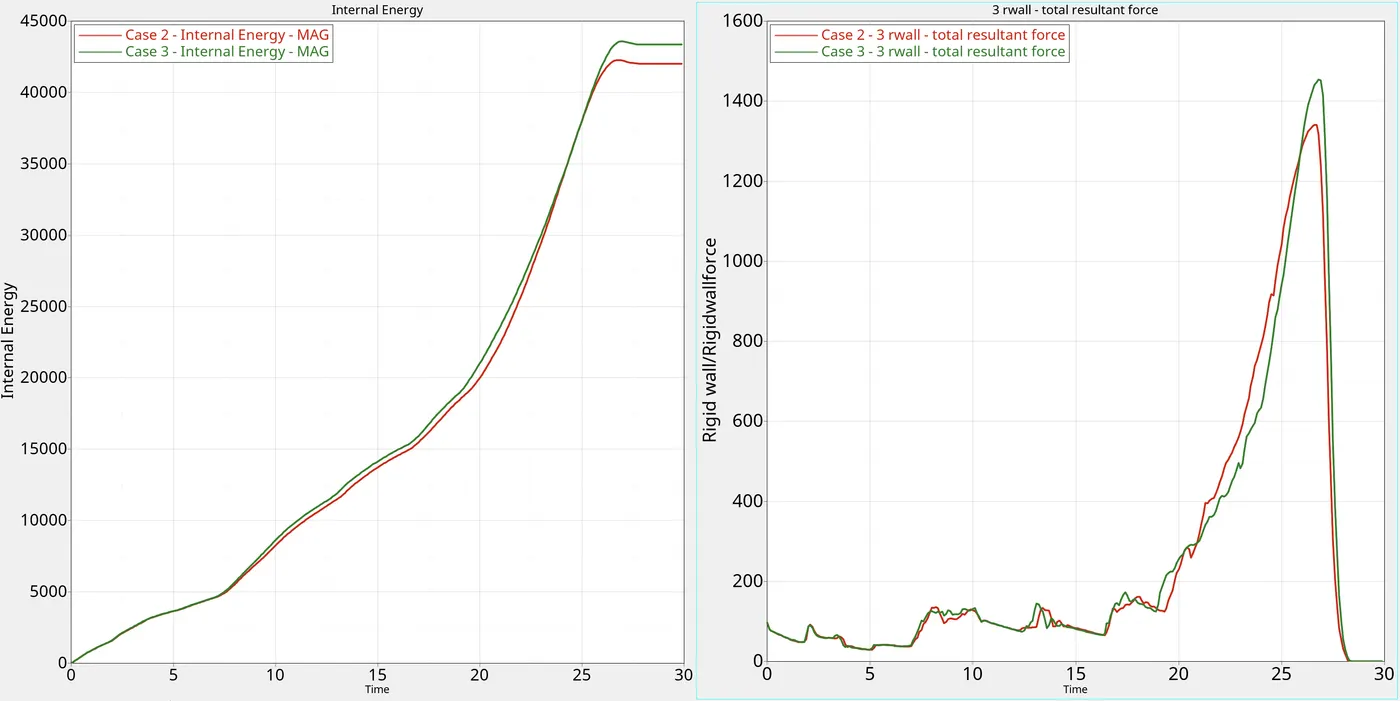
Now lets compare Case 2 and Case 3:
Internal Energy and rigid wall forces:
Contact Energy:
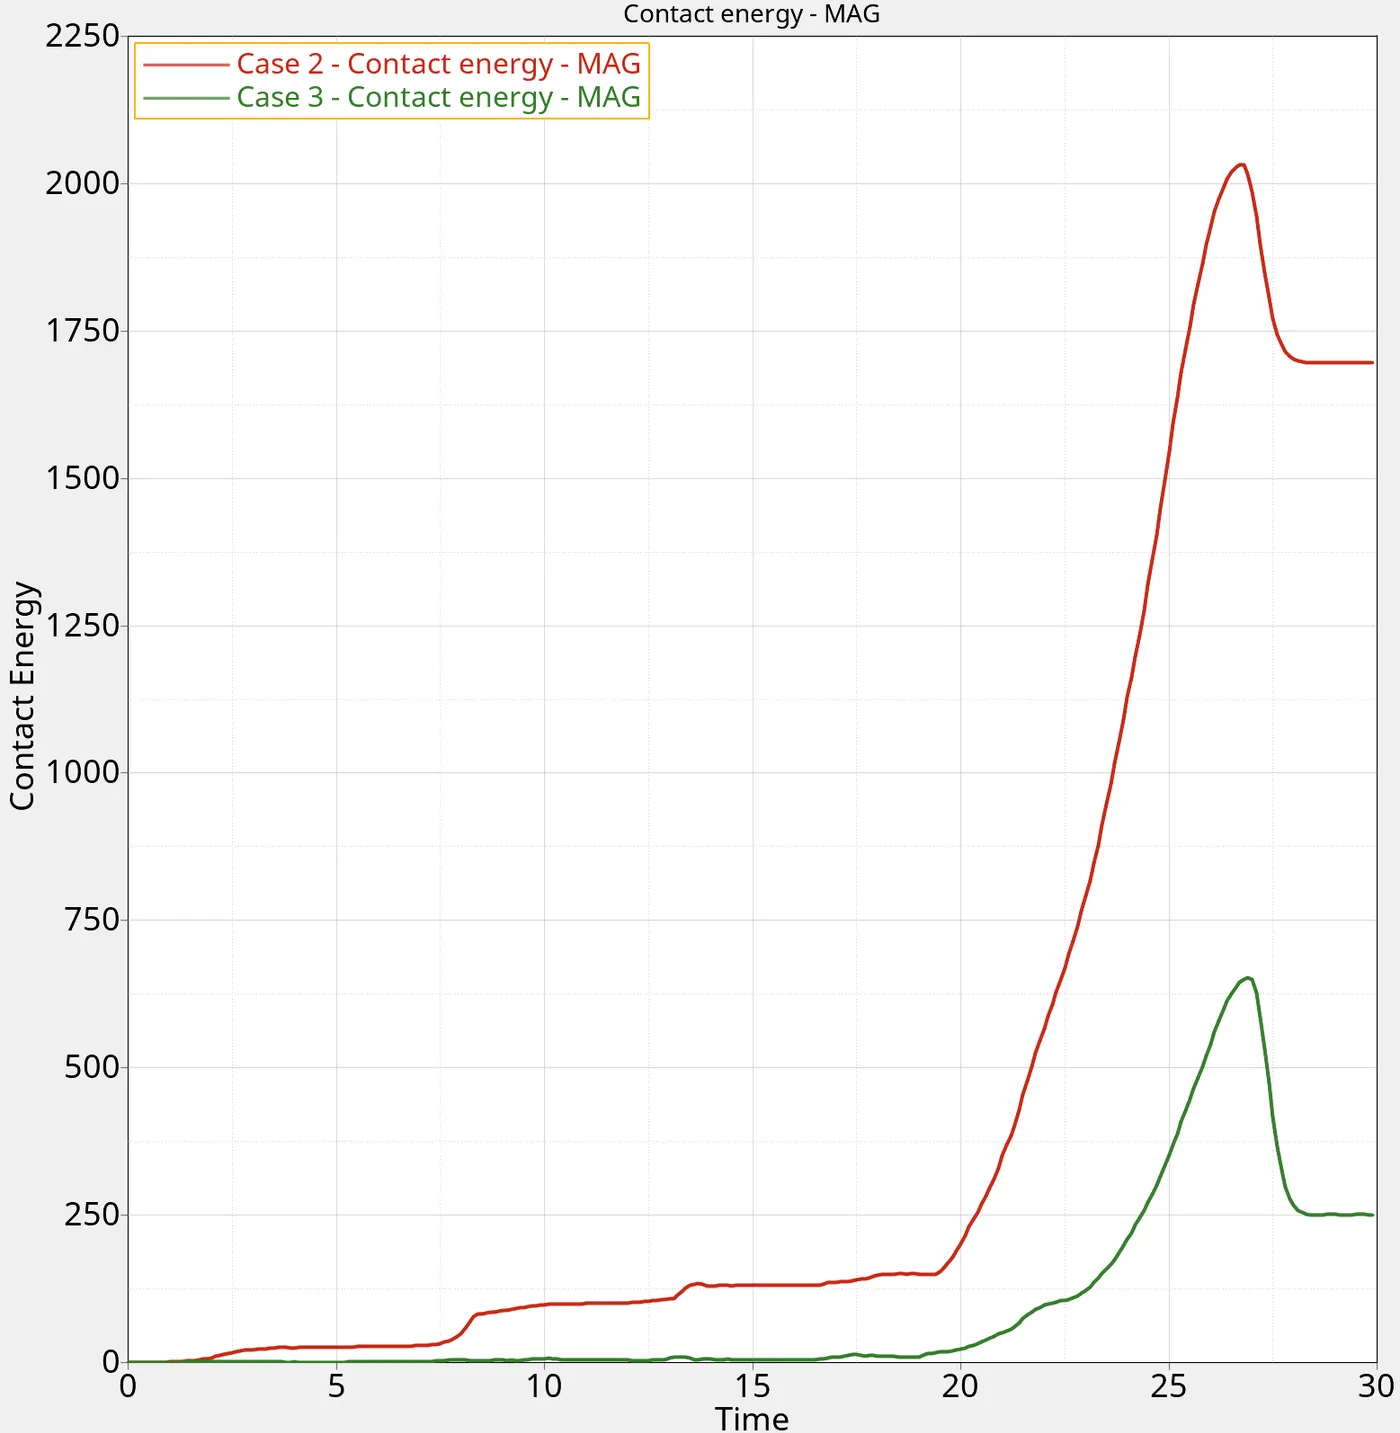
In above graphs we can see that adding the type 11 interface has reduced the contact energy by a lot. That energy is retained in the form of Internal Energy of the system, which explaings the increase in Internal Energy for case 3. The change in crushing behaviour has increased resultant Rwall forces, which means less energy is being dissipated in deformation. This again is supported by the Internal Energy graph.
For Case 4 we are removing the notches and Boundary conditions on the model.
The model is as shown:
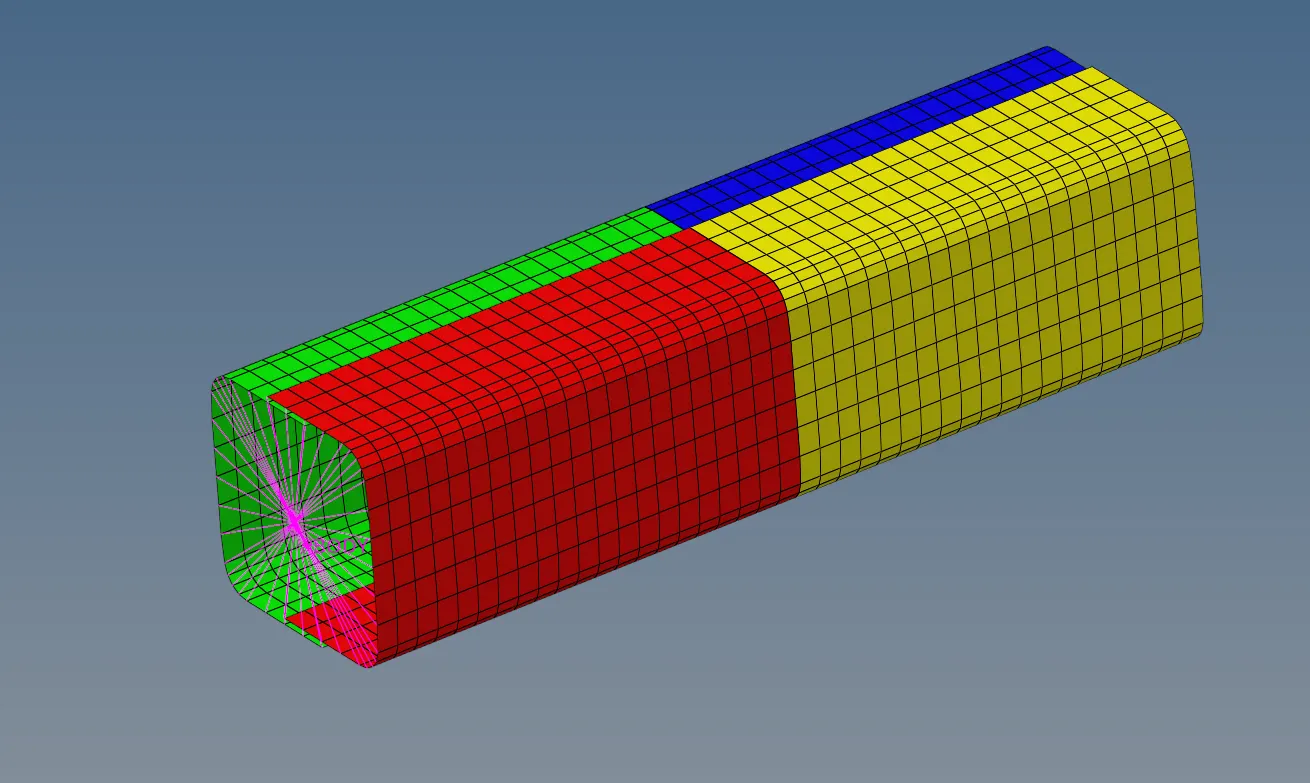
The boundary condition was restricting the motion of the body in the Z direction, with no rotation allowed.
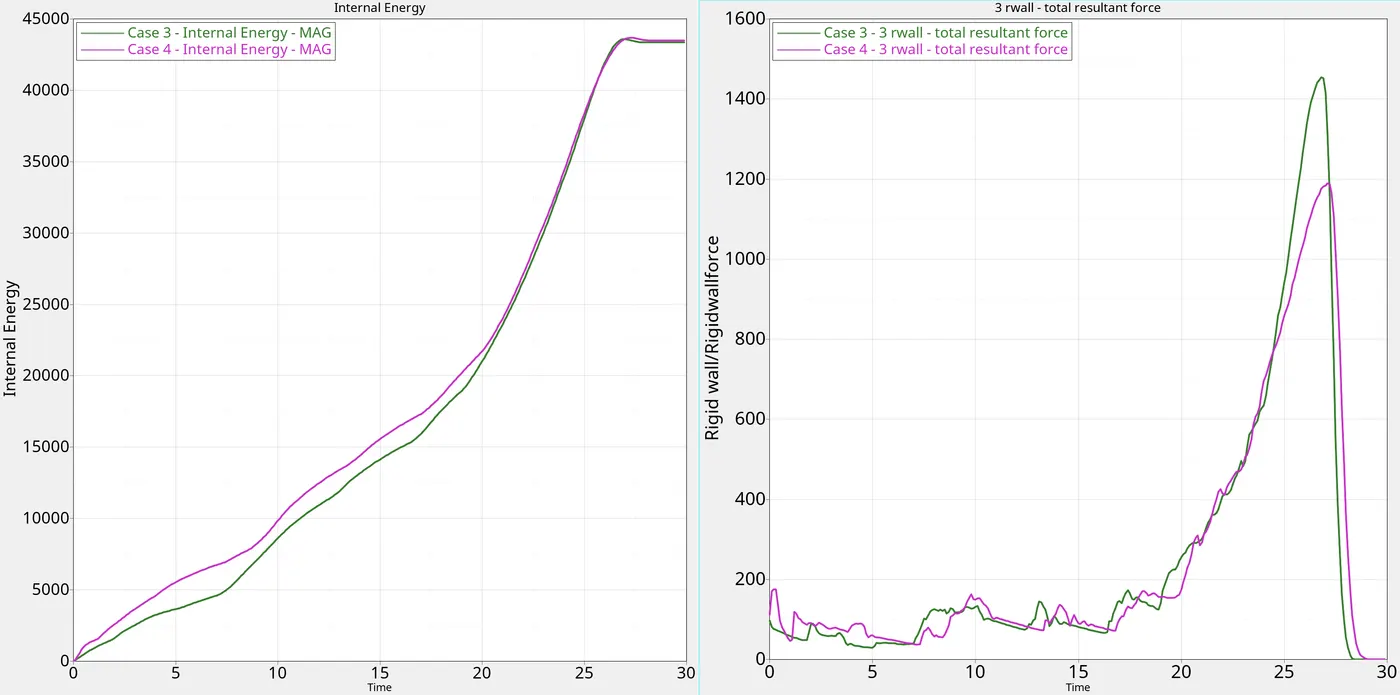
Now lets compare the results with Case 3:
Internal Energy and rigid wall forces:
Contact Energy:
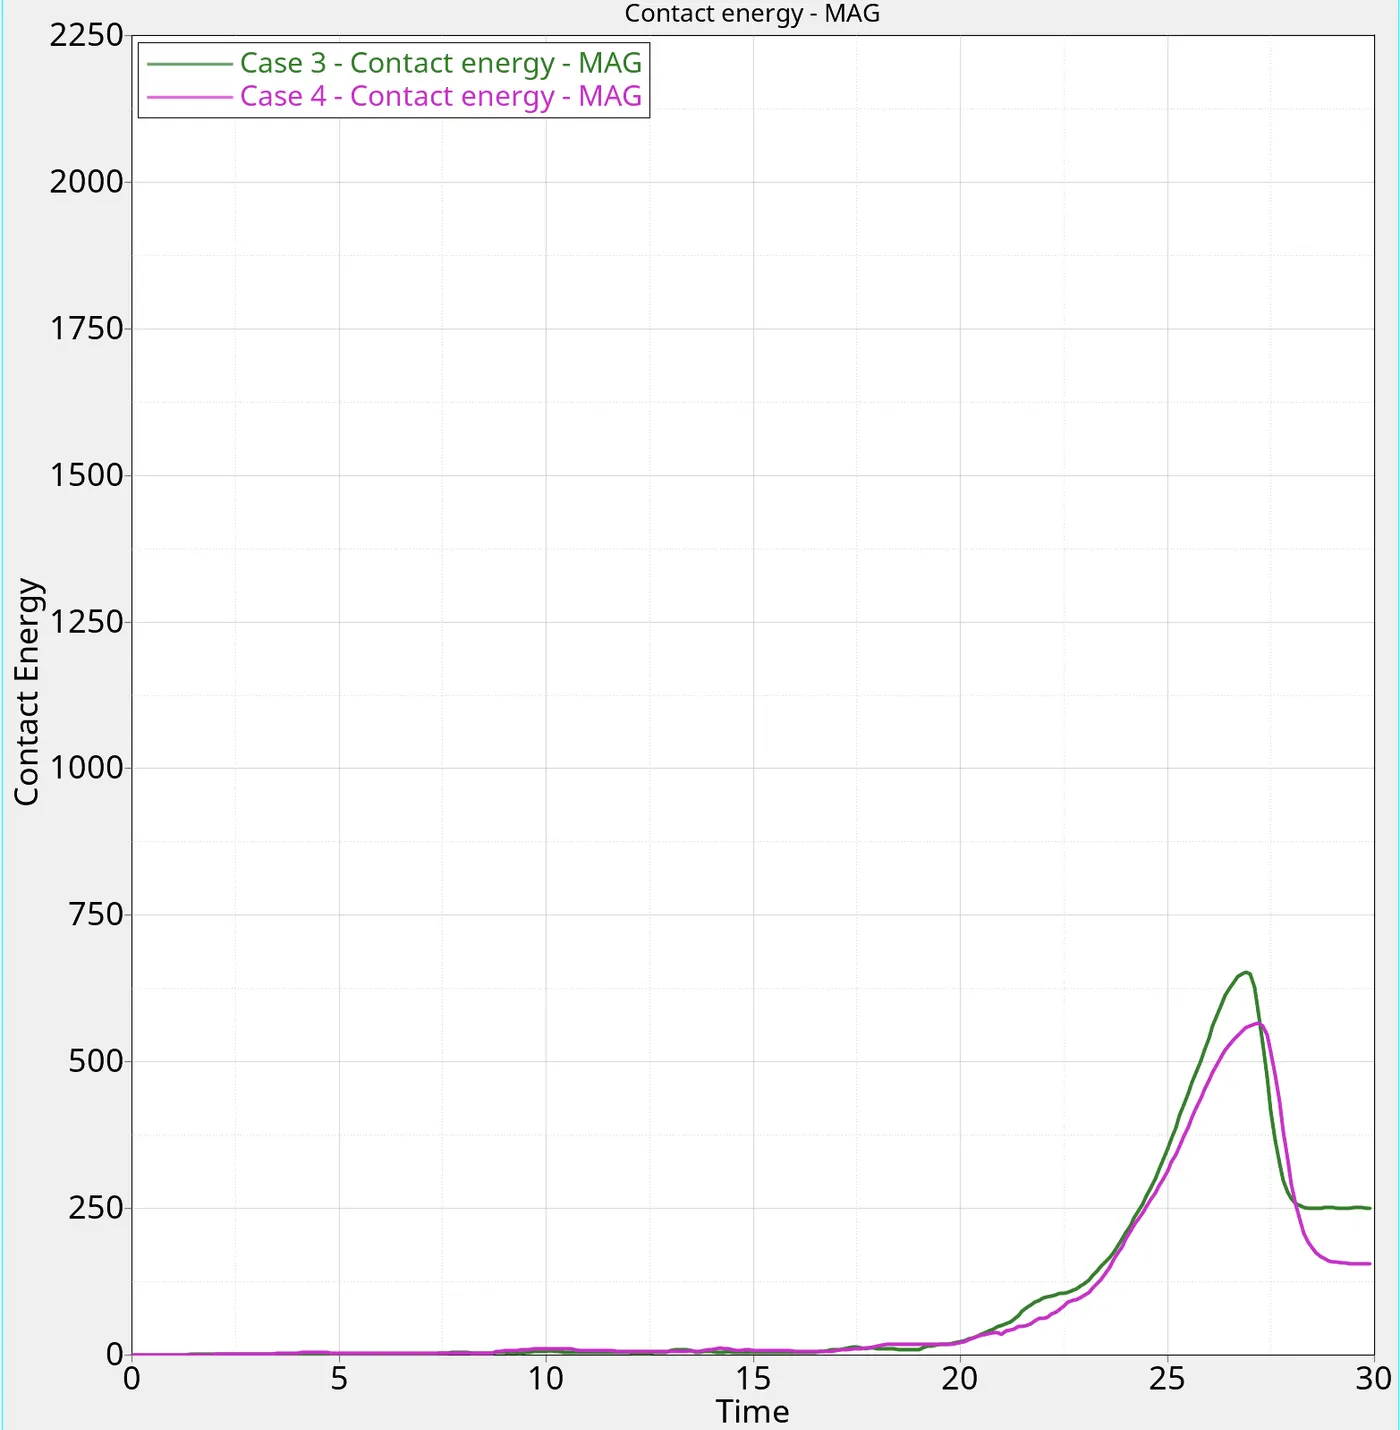
We note that the Rwall forces have decreased. This implies that the model has become less stiff due to the removal of notches, hence less force is being transferred to the walls.
For Case 5 we are creating a new notch in the middle as shown:
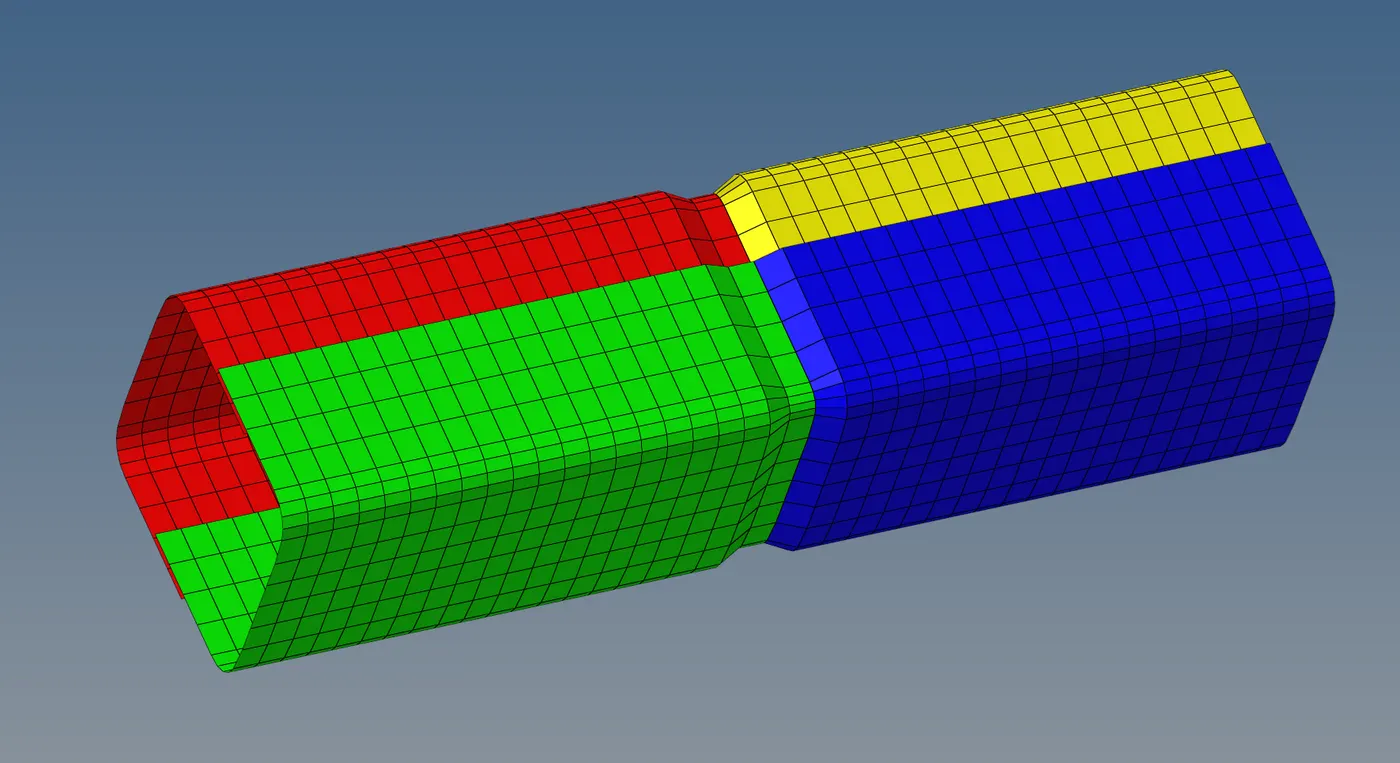
Now we run the simulation and see how it affects the results:
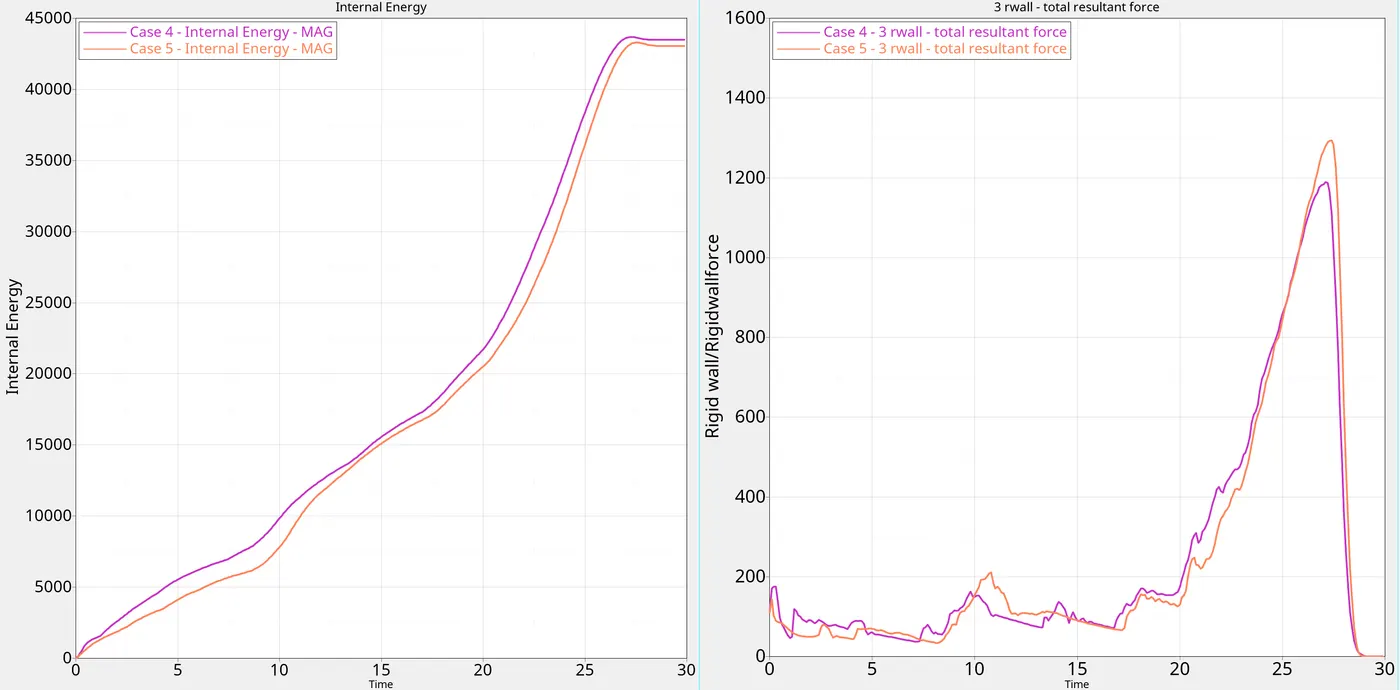
Lets compare with Case 4:
Internal Energy and rigid wall forces:
Contact Energy:
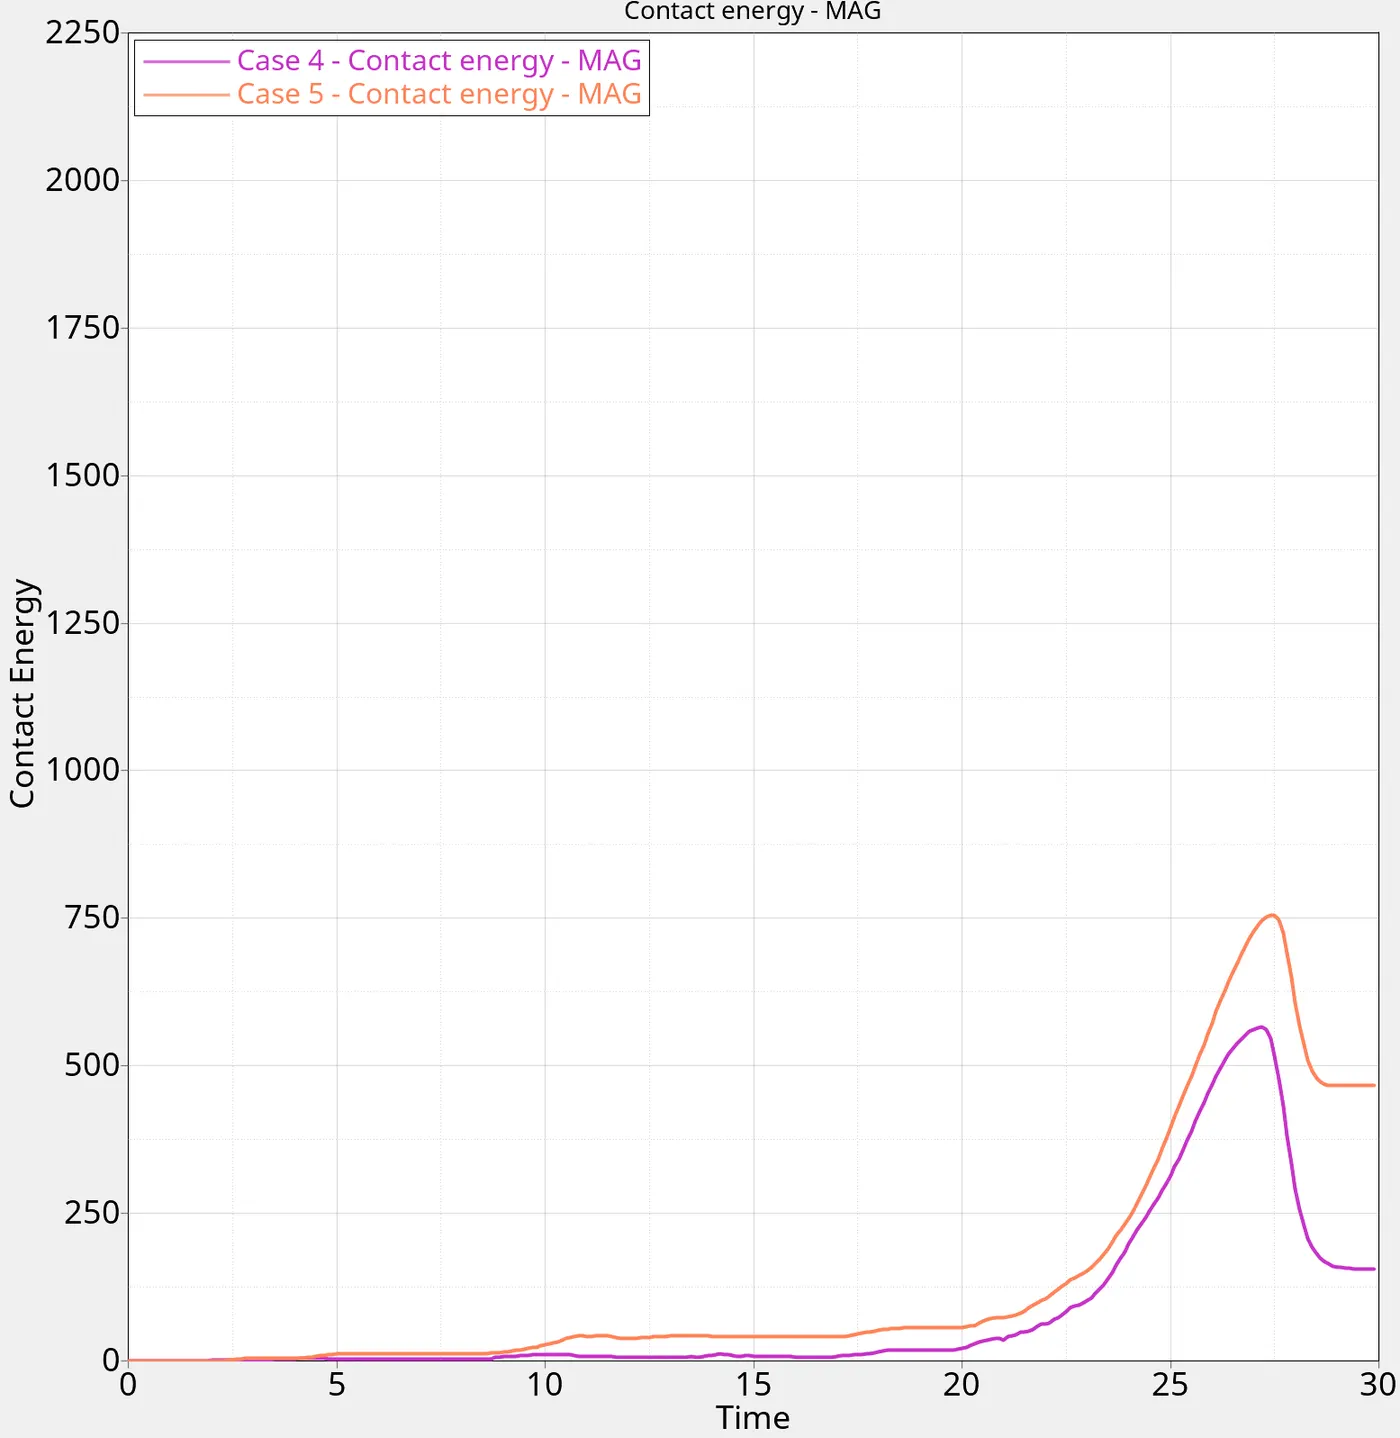
As expected, the addition of notches in the center has increasaed the Rwall forces, which means the model is stiffer than before
For case 6 we create two new half notches with surfaces from only two opposing sides:
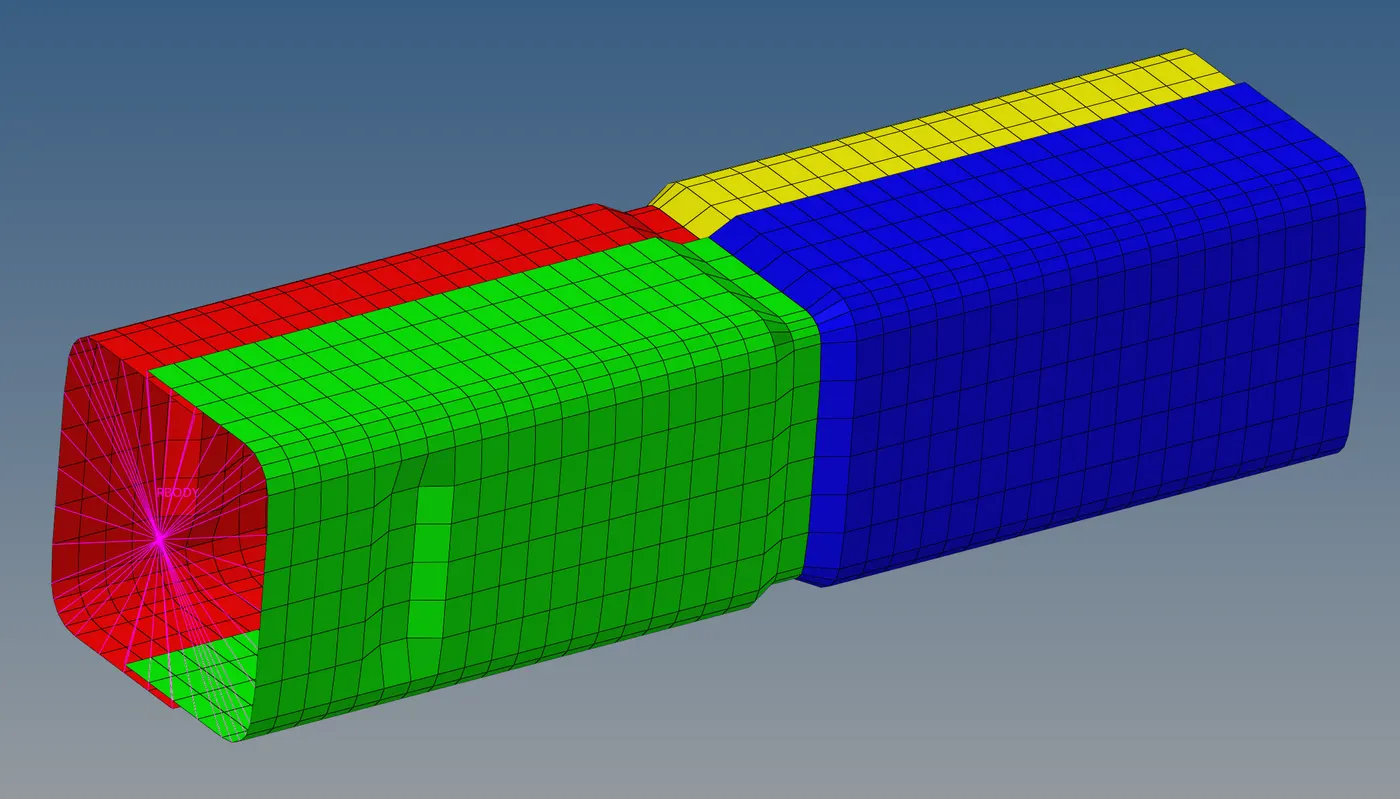
Lets compare the graphs with Case 5:
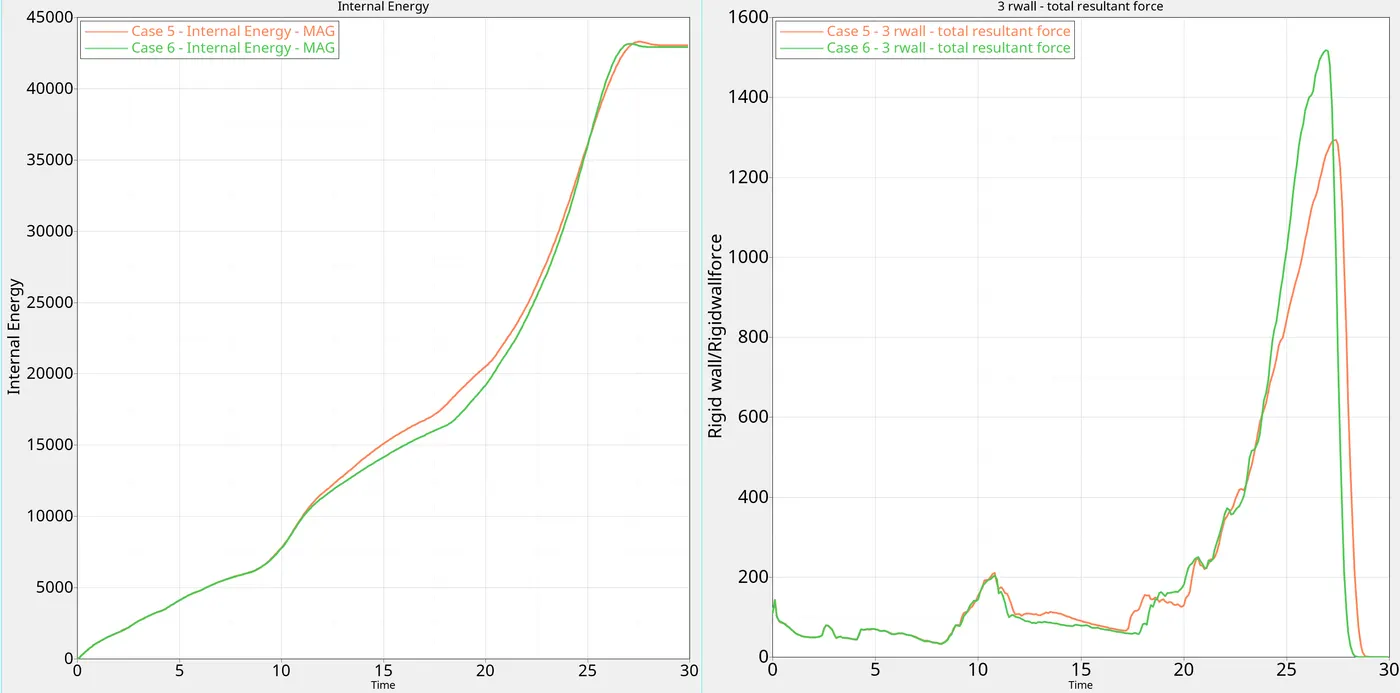
Internal Energy and rigid wall forces:
Contact Energy:
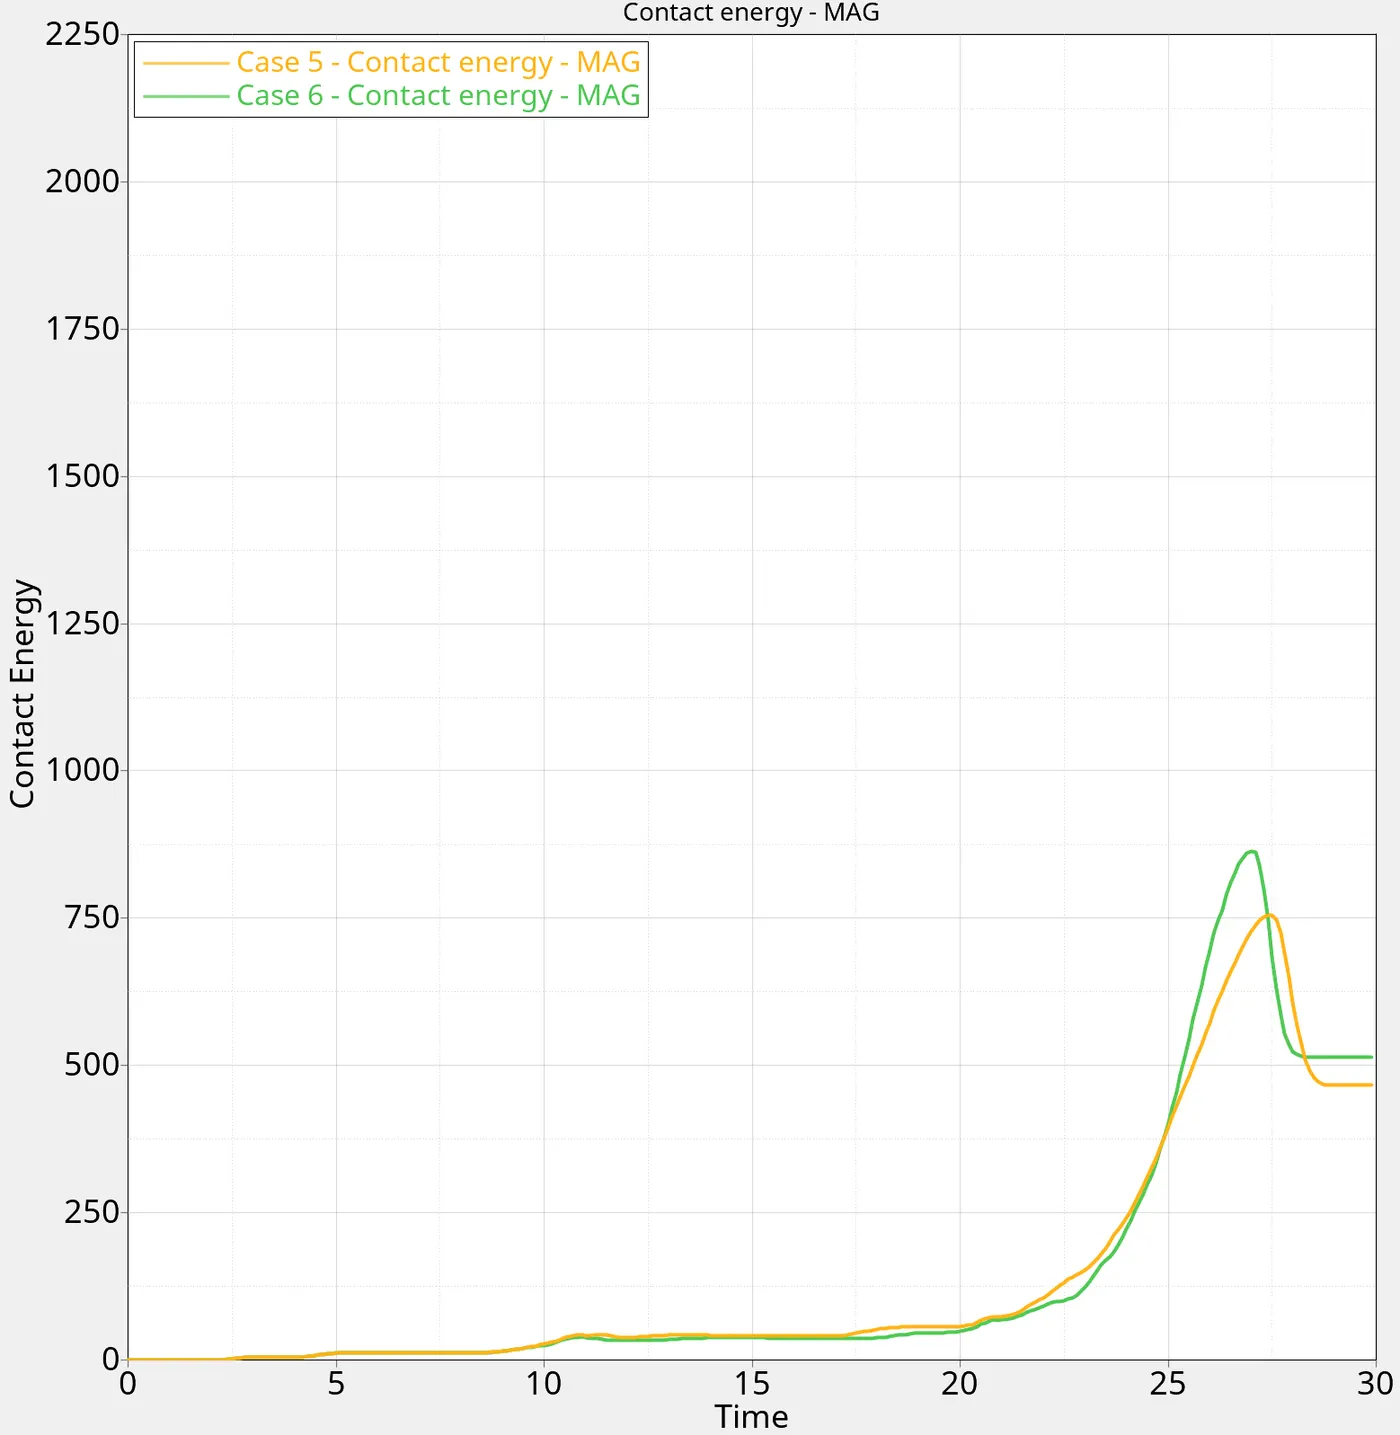
Just like with case 5 and case 4, the Rwall forces have increased in case 6 compared to case 5. The internal energy has not changed a lot, considering the design change was small.
Comparing all the 6 cases:
Internal Energy and rigid wall forces:
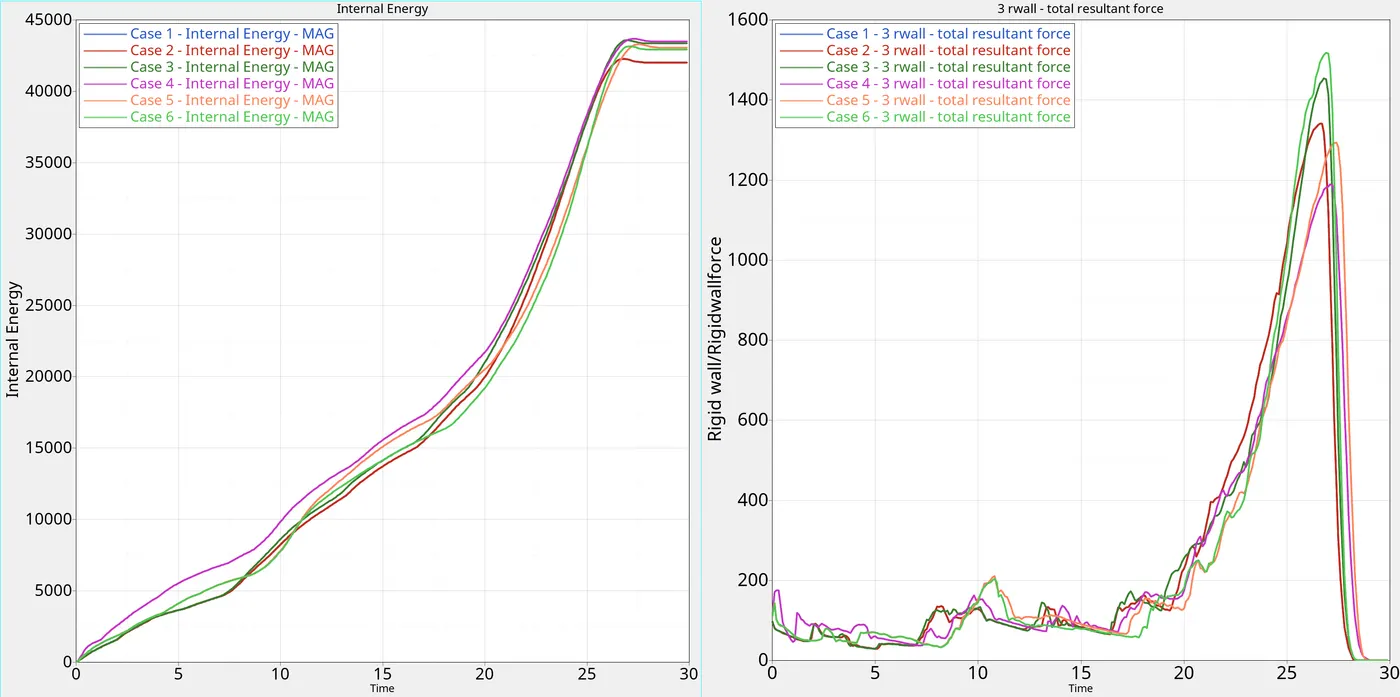
1. We can see that the Internal Energy in case 1 and 2 was the lowest, while it was similar in the rest of the cases, with highest being for Case 4.
2. The internal energy and Rwall forces peak around the 27 ms mark, which is when the rigid body stops moving further into the rigid wall.
Contact Energy:
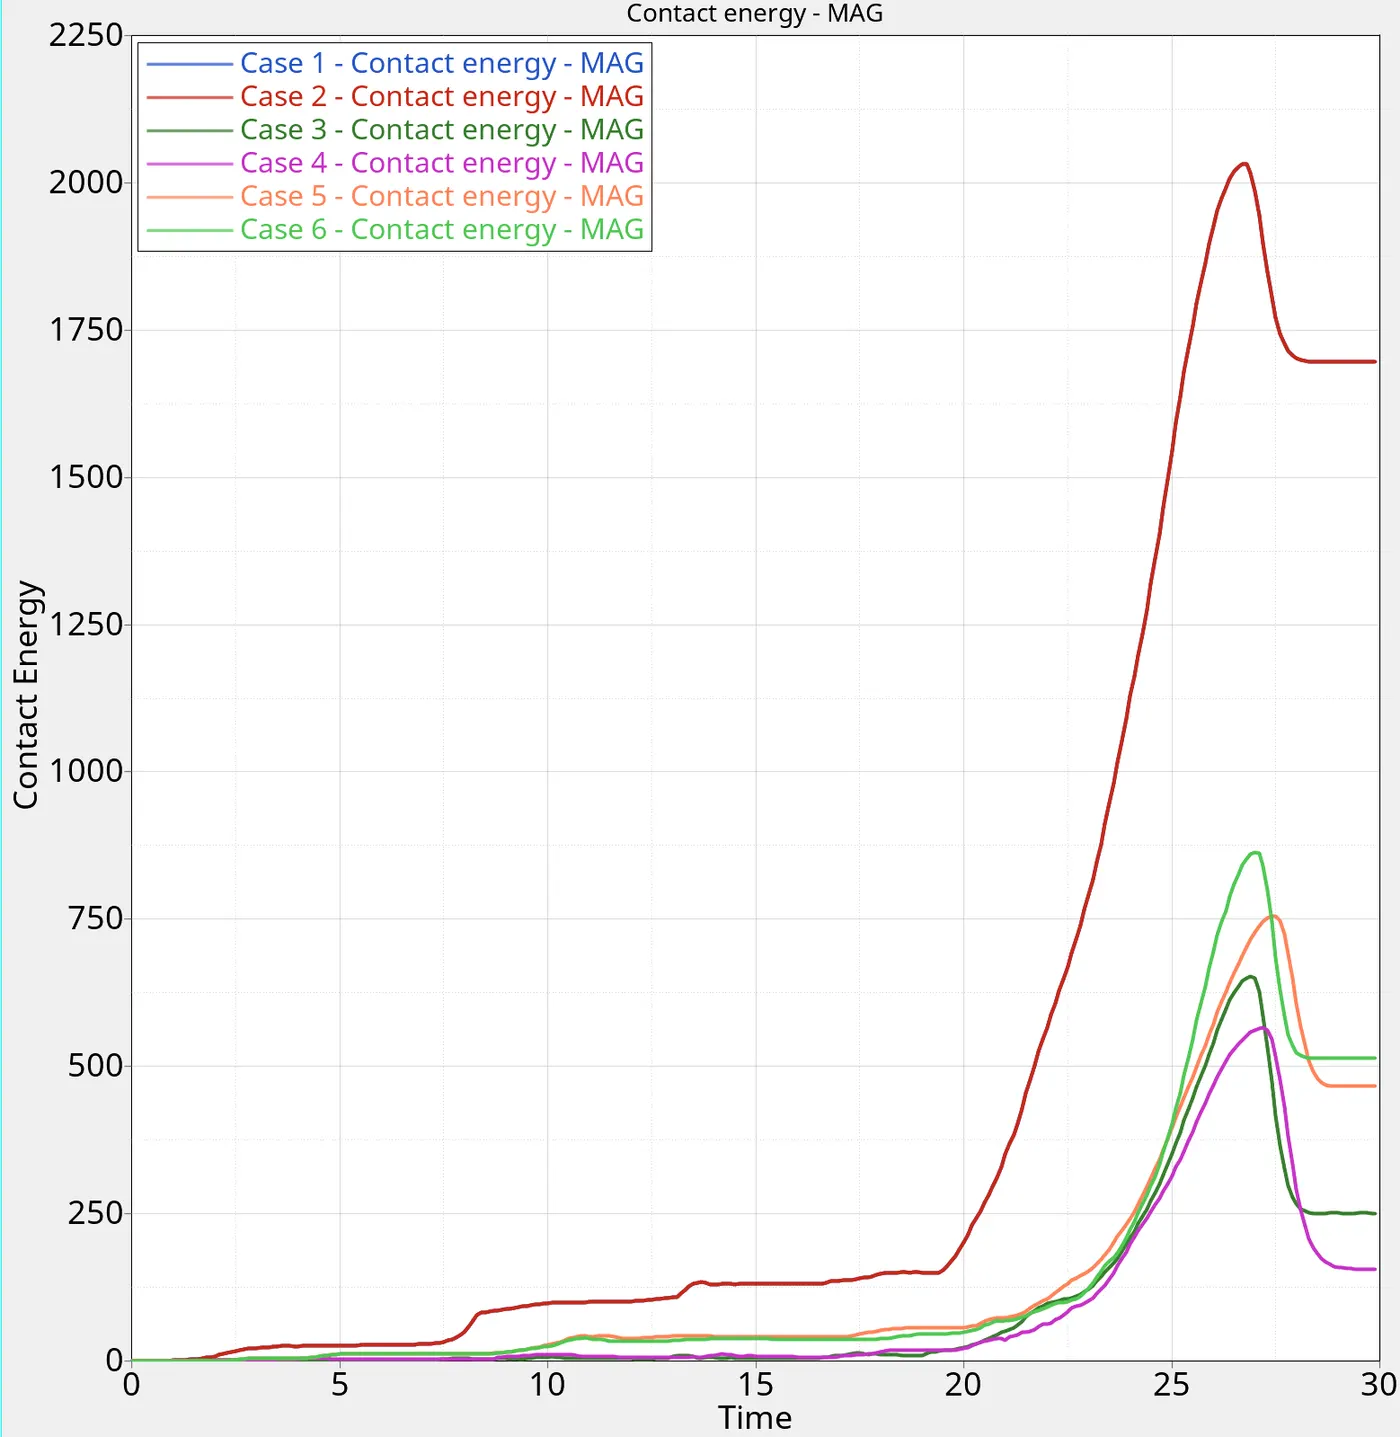
1. Contact energy decreased by about 50% after addition of Type 11 interface. This means less penetration was occuring.
2. In the last 4 cases, Case 6 had highest contact energy, which implies more penetration occuring, which is undesirable.
3. Just like Internal energy and Rwall forces, Contact Energy peaks at 27 ms, when the deformation starts
Conclusion:
Thus we have performed the various simulations with variations as required. The observations can be sumarised as follows:
1. Contact Energy is reduced when using Type 7 and Type 11, as compared to just Type 7, which leads to more accurate results
2. The model has no initial penetrations, hence Case 1 and Case 2 give exactly the same results
3. The Rwall forces increase as the notches are increased, which indicates the the notches provide geometrical stiffness to the part.
4. Notches increase Contact energy of the simulation, which indicates more penetration occuring, which could mean that there is more deformation happening.