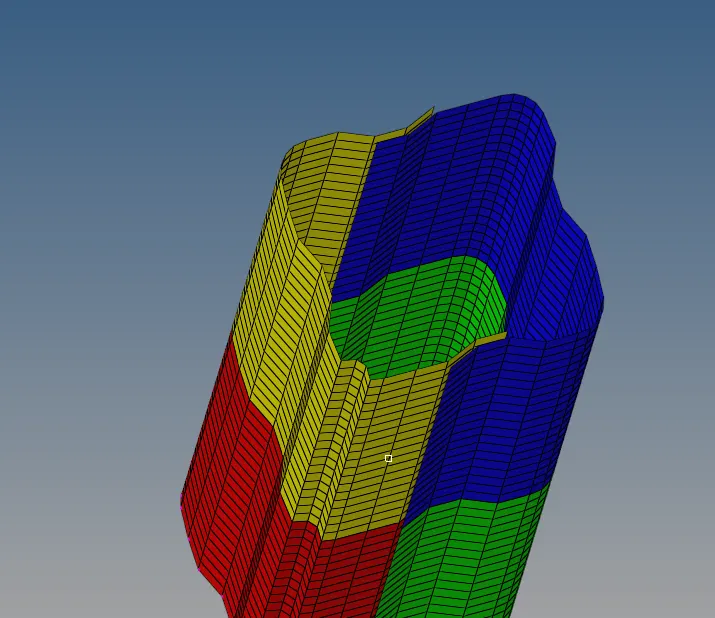
Assignment 5 - Interface and Contact Modeling
Interface and Contact Modeling
Aim: To create the Mesh on bumper assembly, Interface and Contact Modeling for Crash tube by comparing type 7 and type 11 interfaces with Changing notch position and removing notch.
Objective:
1. To run the crash tube model as it is.
2. To change the Inacti=6 and run.
3. To create the type 11 contact and run.
4. To remove both notches and remove boundary conditions on rigid body nodes then run.
5. to create a new notch in the middle ,select the whole section and run.
6. To create a new notch with nodes only from opposing 2 faces and run.
7. Plot RWALL forces ,contact forces,internal energy and Create TH/PART for all parts and compare results for all cases. effect of notch And plot the energies.
0.1. Create the mesh for bumper assembly,mesh size should be 6mm.
1. Import Side_door.hm in to Hypermesh : file>open>model, browse the file and open. in the figure 1.1 shows the model.
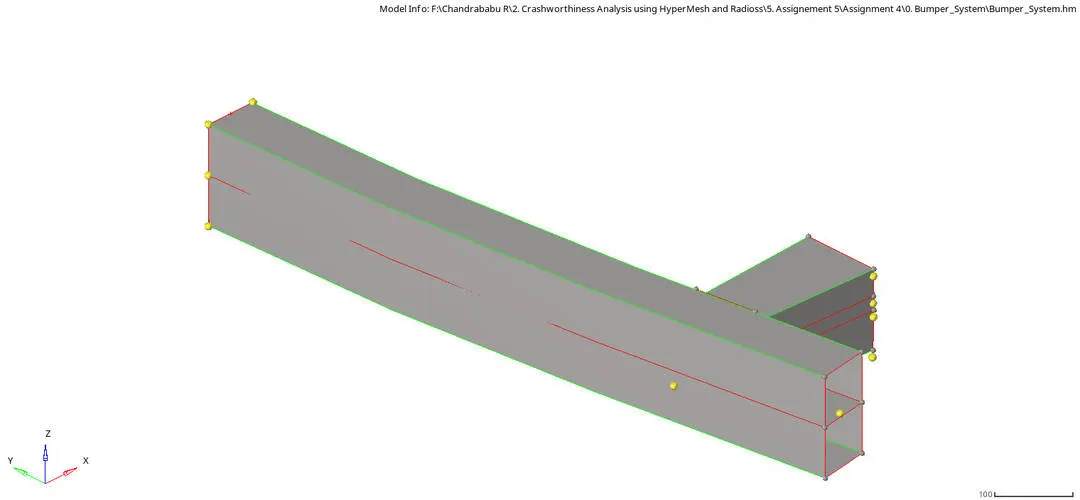
Fig.1.1: Imported file.
2. CAD Geometry clean up and topology: In this step the given model undergoes geometry check. Where all the defects such as collapsed faces, cracks, free edges, T-edges are clear. In the fig.2.1 show description on surface.
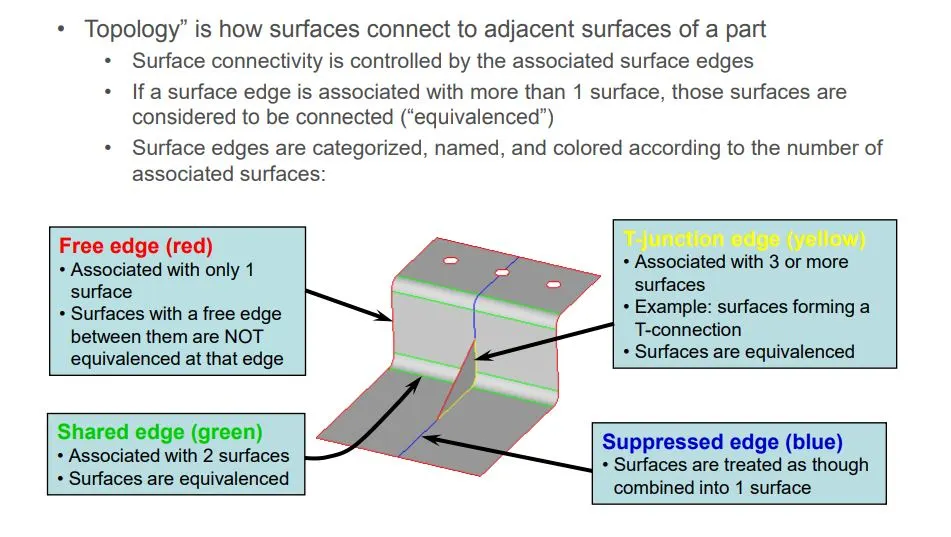
Fig.2.1: Description on surface.
Tools used in topology
Tools>Edge Edit Panel
A. Equivalence (multiple edges at a time) Search surfaces for pairs of free edges and combine into shared edges
B. Toggle (edge pair at a time) Select an edge; equivalences with other free edges found within a user specified tolerance
C. Replace (1 edge pair at a time) Select 2 edges to equivalence together. Control which edge to retain and which to move.
D. Geom>Surfaces>Ruled or Geom> Quick edit > filler surface or 2d> spline> surfaces only (to create missing surfaces).
In the given model there are so many defects. So many small fillets which are very small and should be defeated. In the fig. 2.2 shows some defects
in the fig.below shows the mid surface for model after clearing all errors
Start meshing Process by Automesh (2D>Automesh )
steps to mesh
a. Select surfaces for initial mesh and for remesh select elements.
b. select size and bias abd select mesh size which is Target/Average length 6. Use the Size and Bias subpanel to perform size and bias meshing, a flexible and powerful meshing method. A minimum of inputs are required for the element criteria settings. The algorithm options set preferences on how to handle certain situations when encountered in the geometry. When using existing finite elements as the basis for mesh generation, feature recognition settings allow the mesher to break up the areas defined by the selected elements into logical groupings with mesh controls set for each group boundary.
c. Select the type of mesh as mixed (Quad, Tria, mixed, R tria etc) and clock on alin and size in order to get proper mesh near features.
clock on mesh or middle mouse button

Modify mesh flow by changenging surfaces to elements and select the elements by changing the node numbers.
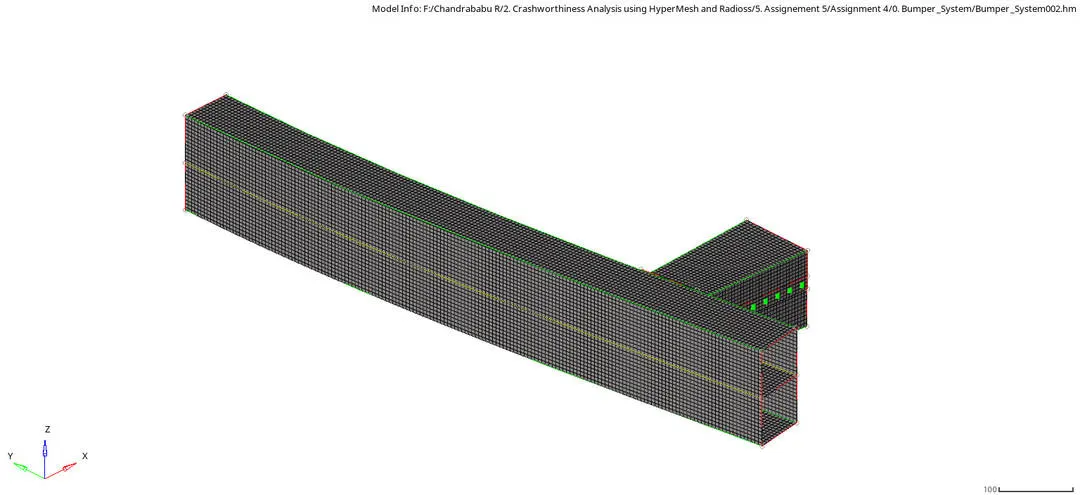
Fig.5.2: Mesh Flow
Interface and Contact Modeling
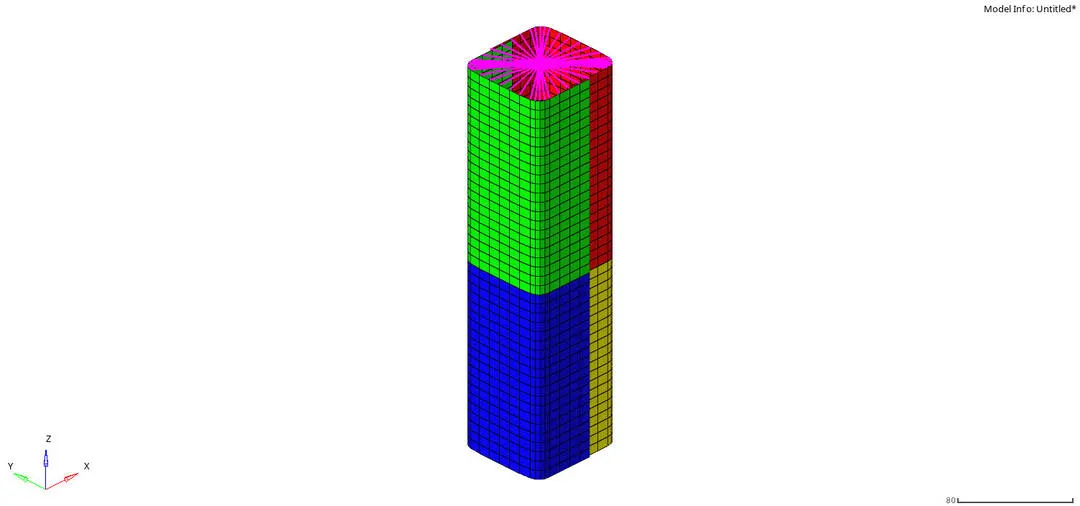
In the given model we have velocity of -13.3 m/s and seam weld and type 7 interface for all the elements as master segment as well as slave.
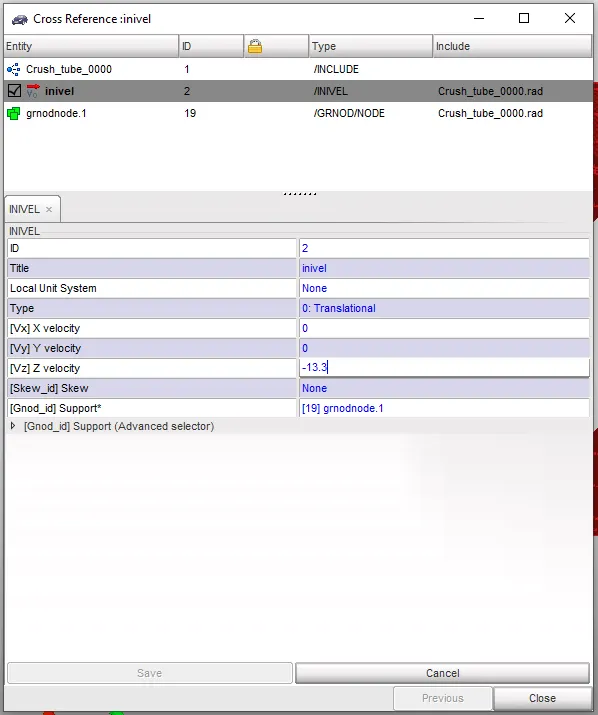
Velocity
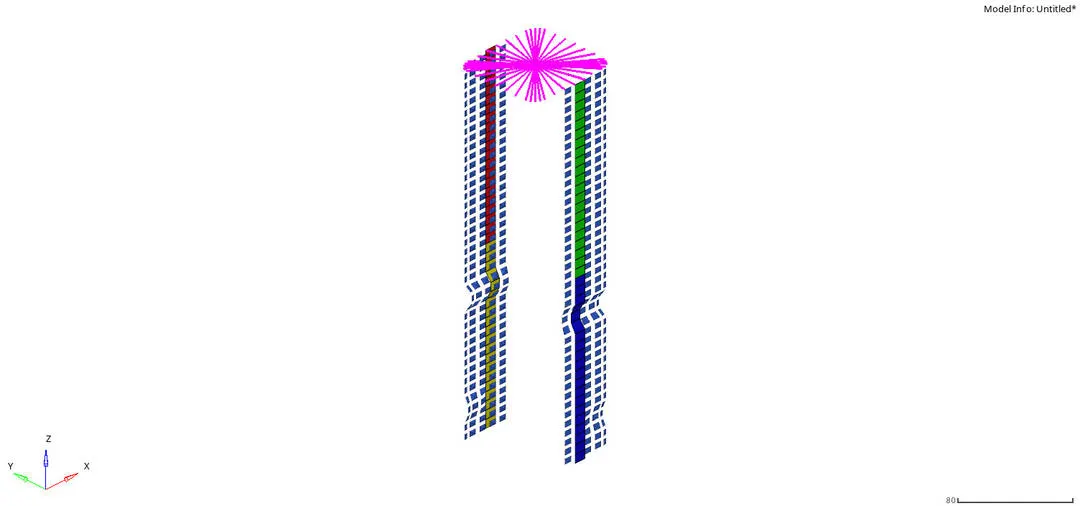
Seam weld elements
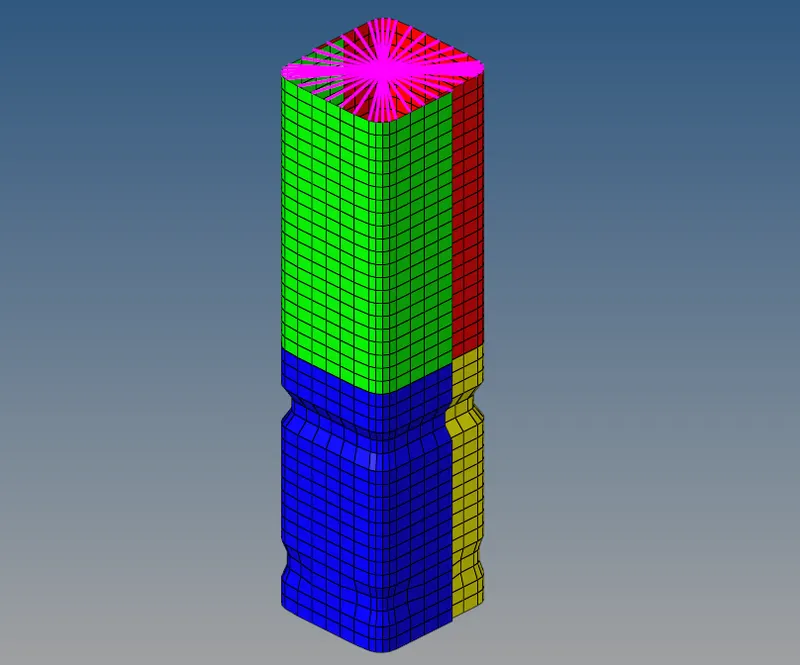
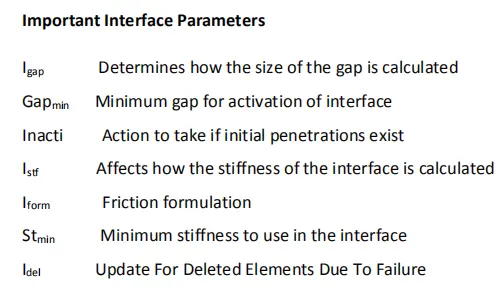
Type 7 Interface contact elements
Case 1 (Run as it is): Interface TYPE7 is a multi-usage impact interface, modeling contact between a master surface and a group of slave nodes. It is also possible to consider heat transfer and heat friction. For more information Click Here
In Case 1 we have a run model as it is with interface type 7 with all default conditions with Stmin 1.0 and Gapmin is 1.0 an Istif is 4 i.e Interface stiffness is the minimum of the master and slave stiffness () shown in the fig 1.1
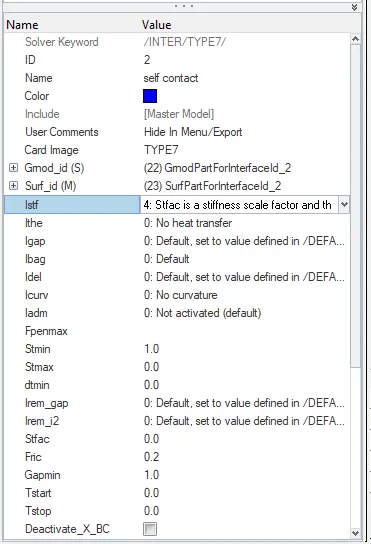
Fig. 1.1: Type 7 interface with default values.
From the simulation shown in the fig. 1.2
1. Deformation takes at notch which is near to the middle of the model due to applied velocity.
2. After complete deformation of the notch. The next deformation occurs at a notch which is near to the Rigi wall this is because the thickness is less at bottom. This notch is formed in fillet areas so because that notch region is going inside and which is flat elements are coming out side, this region does not require more force to deform.
3. deformation is continued till displacement of 237mm out of 304.5mm and rigid wall forces are varying from 0 to 200 KN. for another 58.5mm it's difficult to deform because 78% of displacement is done. to do more displacement it requires more force. from the simulation using displacement option we can is the max displacement is 280mm i.e 92% after that it is not possible for the given velocity to do more deformation due to rigidwall. also we one can notice due to rigi wall forces its ripples back by 5mm.
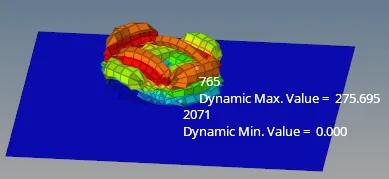
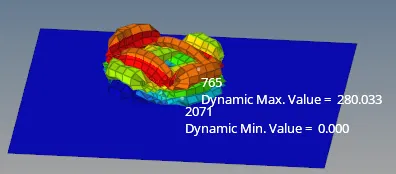
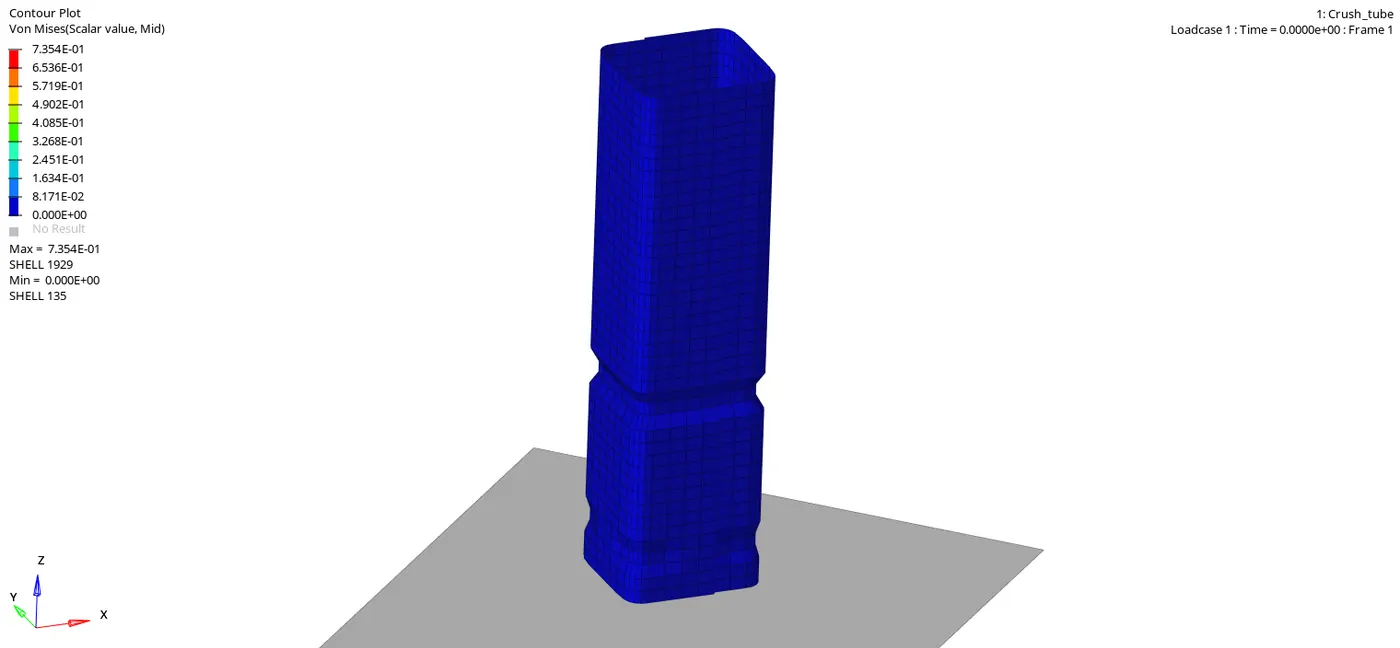
Fig. 1.2: Case 1 Simulation
In the fig.1.3 we can see the rigid wall forces i.e total resultant, normal and total resultant forces.
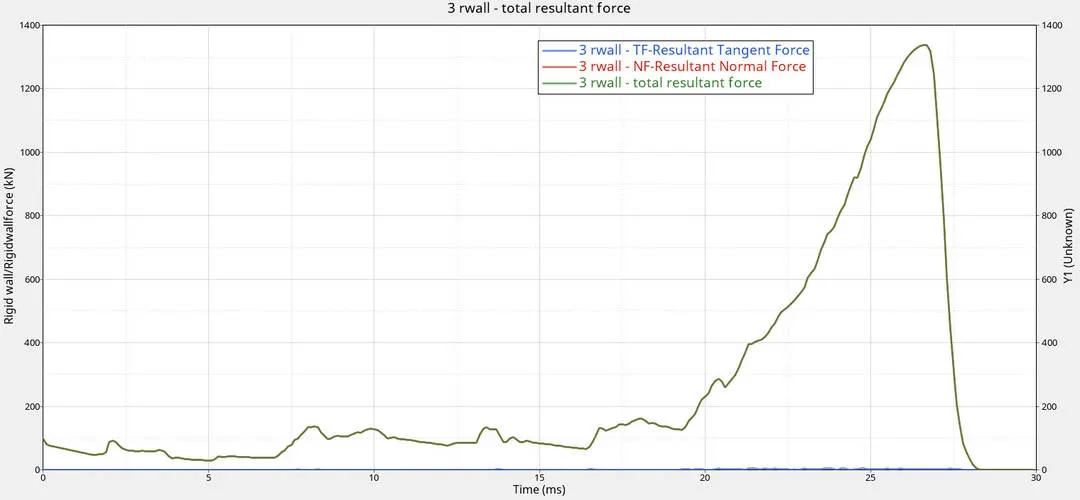
Fig. 1.3: Rigid Wall Forces
1. At initially before velocity acting on model, there is zoro rigid wall forces, once the velocity reaches to the rigid connection the force starts appling on the body and starts deforming,
2. At the initial stage the rigid wall forces start building opposite to the velocity. 80% of deformation easily due to notches, after that its required more force to deform, so the rigid wall reaction forces are increasing till the final displacement this is because still we have velocity
3. After that rigid wall forces are dropping down because velocity is dropping, this is due to rigid wall
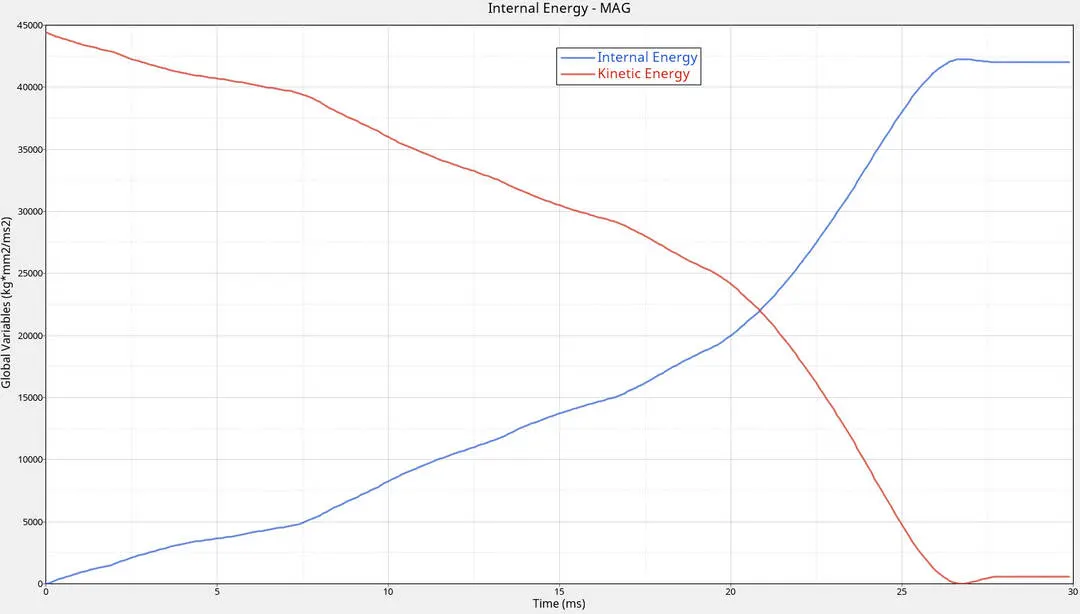
In fig.1.4 we can see the Internal energy and contact energy graph.
1. Initially the velocity is maximum so the Kinetic energy is maximum. when impact takes place the KE is absorbed by part, so that KE is decreasing and internal energy is increasing.
2. Afret 80% deformation theKE is absorbed by part more so we can see the sudden decreasing in the KE, and Sudden increasing in the Internal energy
3. Once deformation reaches max, due to rigid wall stops velocity so KE becomes zero and internal energy becomes max value.
Initially the contact energy is zero, once velocity is applied and deformation starts due to this deformation there will be penetration, to overcome against penetration the forces are building as per the given Gap min, due to that force we can see the contact energy.
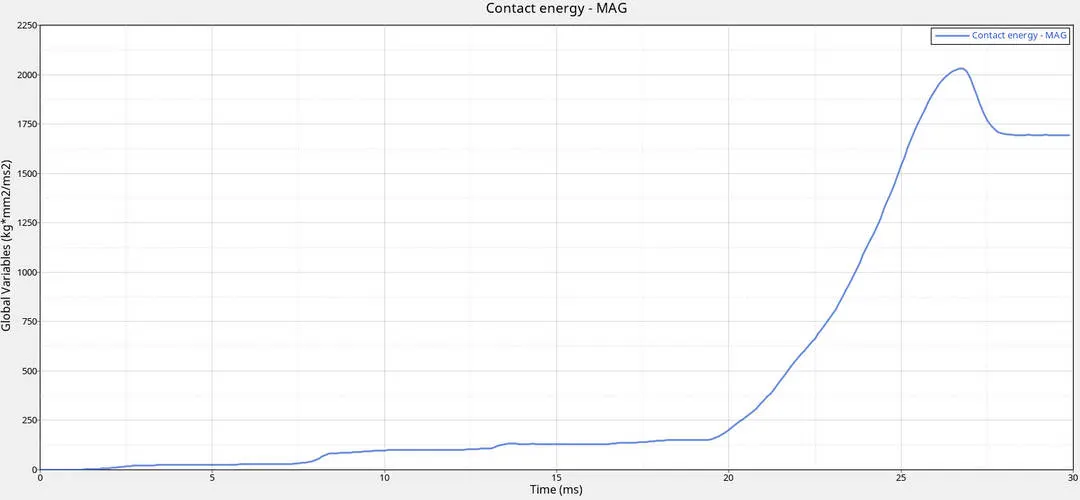
Fig. 1.4: Internal and Contact energy
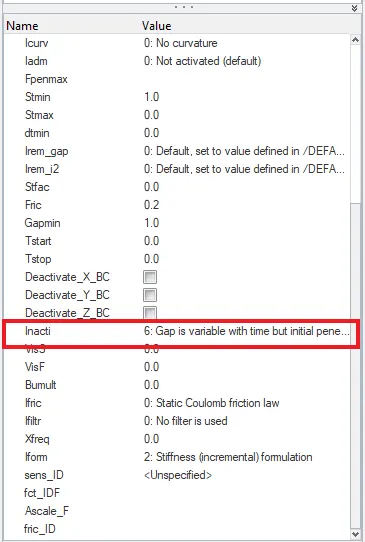
Case 2 (Change Inacti = 6): Special treatment for initial penetrations can be accomplished through the use of the Inacti flag. It is possible to remove penetrated nodes from the interface or to remove the master segments relating to the penetrated nodes. Both treatments allow getting rid of initial penetrations very easily, but they may lead to poor results if the number of penetrated nodes is large.
In this case we are changing Inacti to 6 in type 7 Interface. Action to take if initial penetrations exist or Remove initial penetration where possible elsewhere reduce to less than 30% of the defined gap value and adjust the gap with Incact.
From the simulation shown in the fig. 2.2
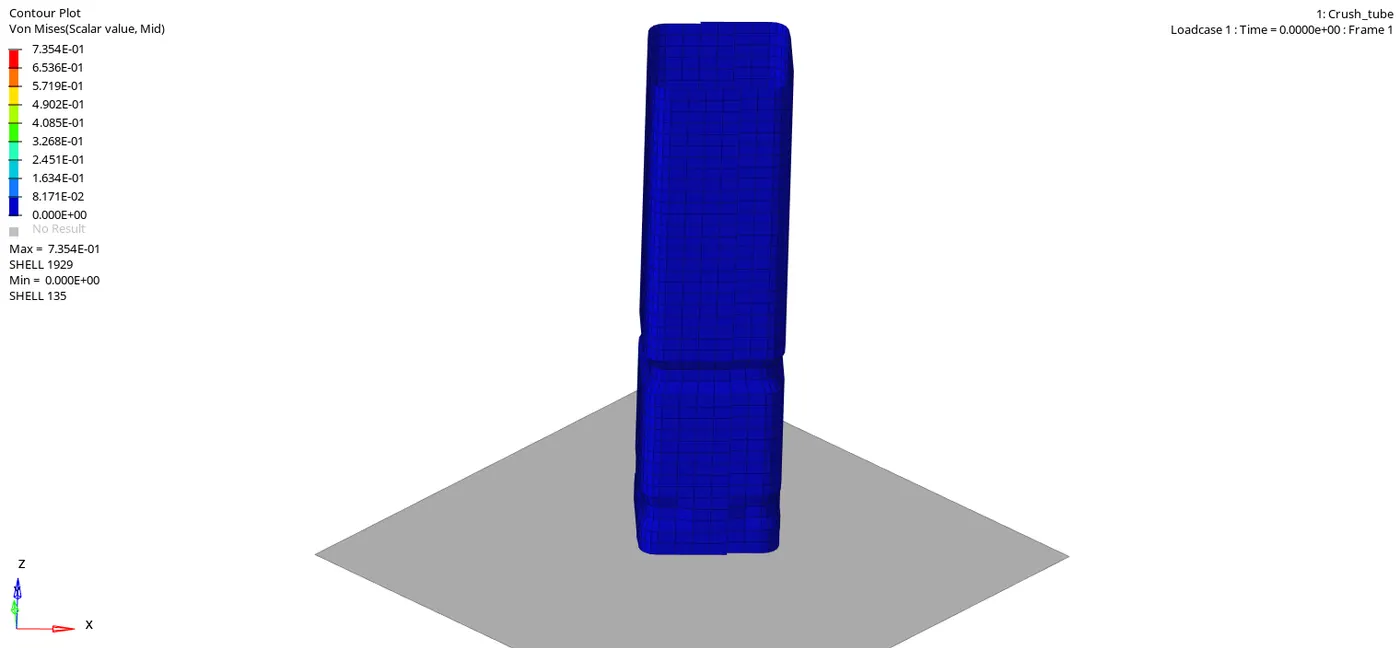
Fig. 2.1: Case 2 Simulation
In the fig.2.3 we can see the rigid wall forces i.e total resultant, normal and total resultant forces. which is the same as that case 1. because there is no initial penetration.(in model we have 2.1 mm gap, and we have 1mm mim gap which is we given and master element thickness we have 3mm Gm is T/2, so we have 1.5 mm of master gap and add Gapmin and Gm that is 2.5mm. but gap minimum is 1mm so which is less then present gap, so we can conclude there is no initial penetration)
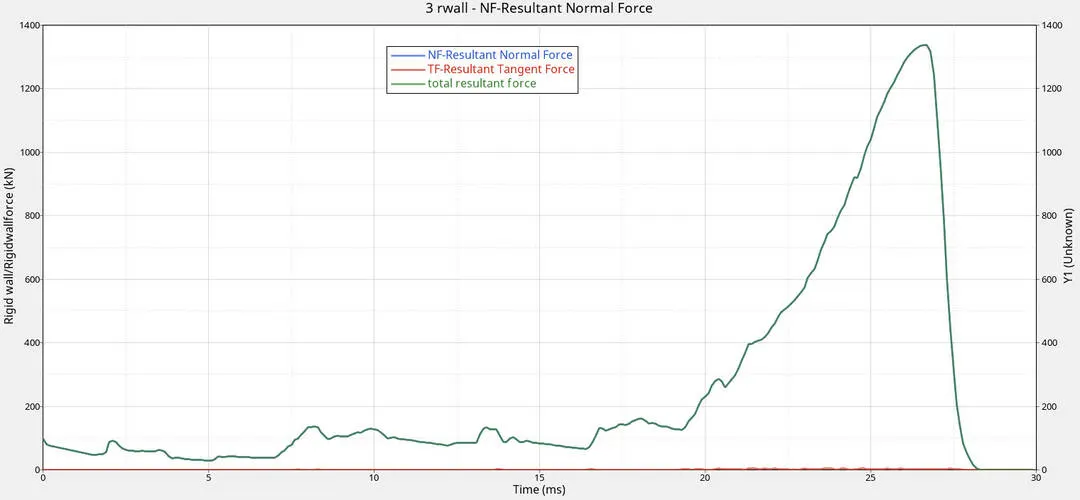
Fig. 2.3: Rigid Wall Forces
Same as that of case 1, because there is no penetration initially even if we use Inacti 6. We have not noticed any change from case 1.
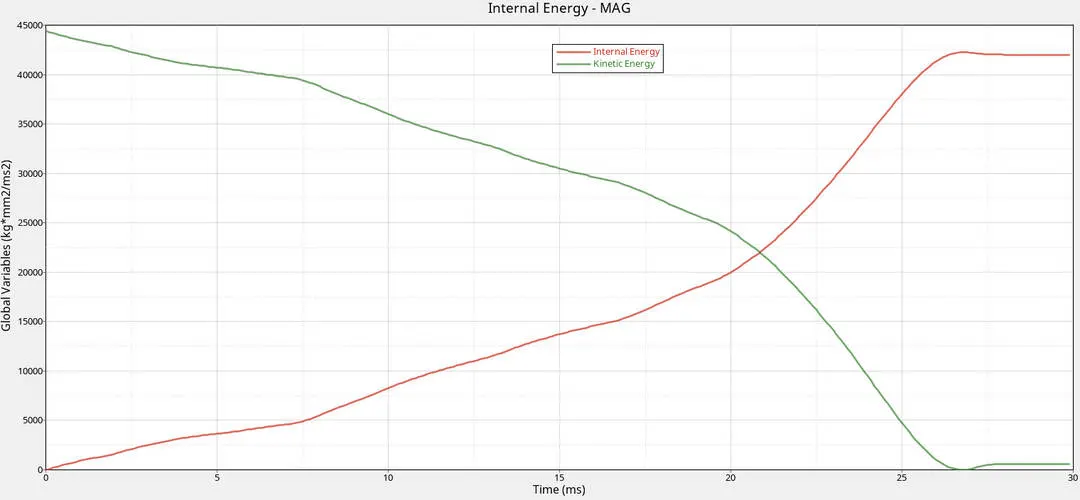
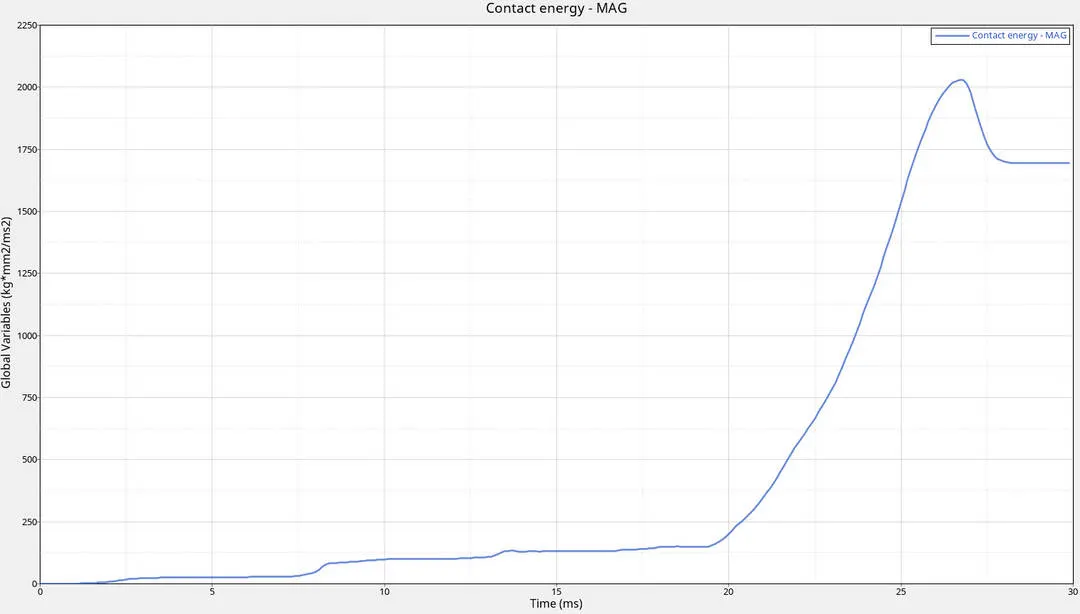
Fig. 2.4: Internal and Contact energy
For case 1&2 we have
1. Rigid wall forces and energies
a. Normal and total forces max = 1337.9 KN at 26.6002 ms
b. KE max= 44400.8 Kg-mm^2/ms^2 at time 0 ms
c. Internal energy max= 42273.2 Kg-mm^2/ms^2 at time 26.8ms^2
d. Contact energy max= 2029.46 Kg-mm^2/ms^2
Case 3 (/INTER/TYPE11) : This interface simulates impact between edge to Edge or lines. A line can be a beam or truss element or a shell edge or spring elements.
In the fig below show the input parameters.
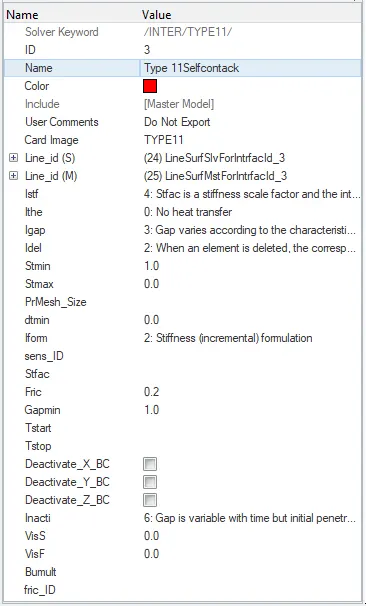
In the fig below show the input parameters.
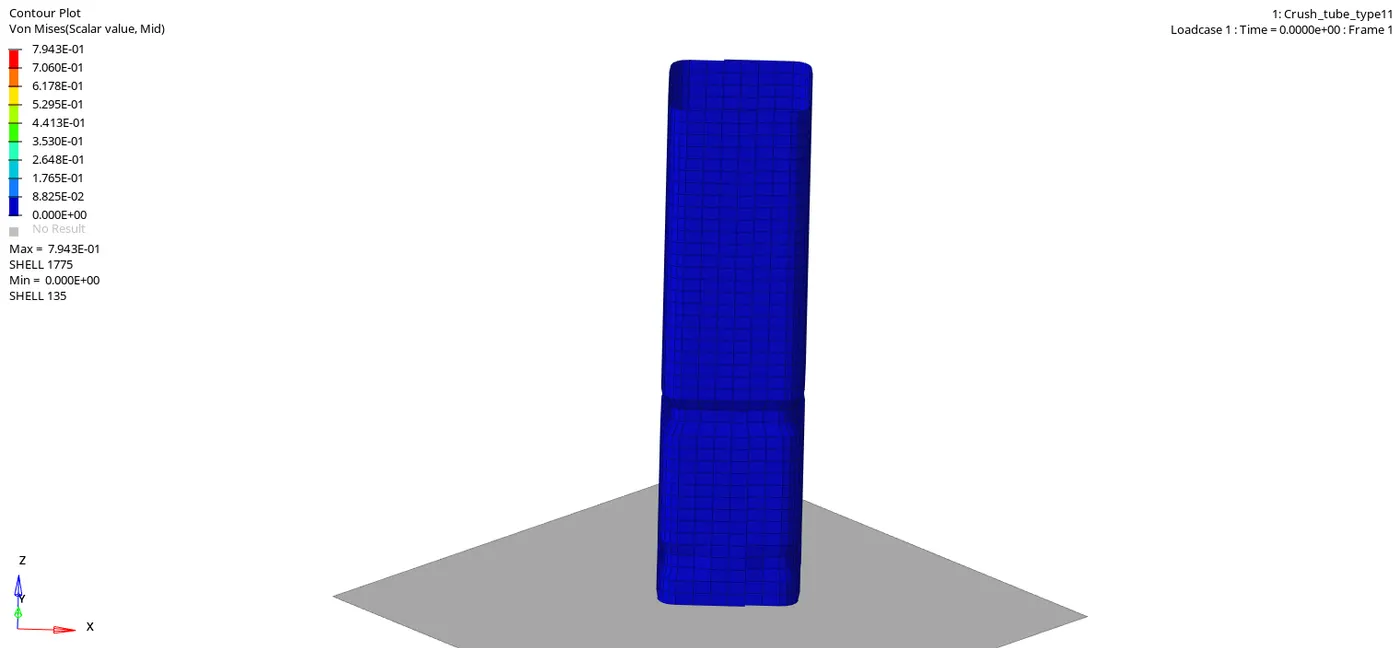
Fig. 3.2: Case 3 Simulation
In the fig.3.3 we can see the rigid wall forces i.e total resultant, normal and total resultant forces.
1. concept of changing the forces are same as that of case 1,
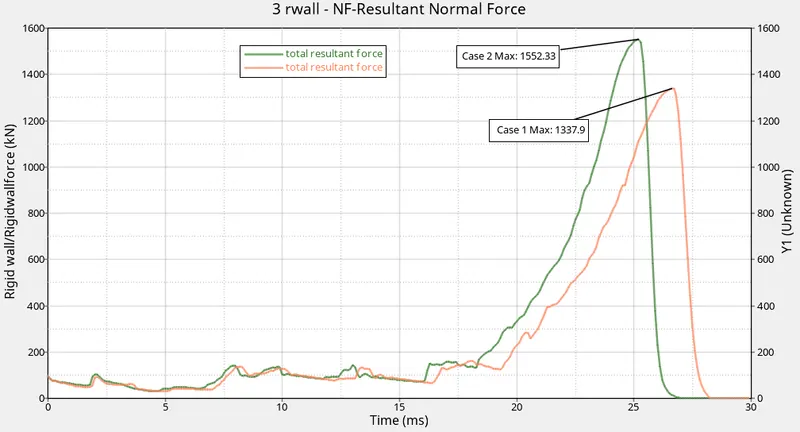
a. Normal and total forces max = 1548.83 KN at 25.1001 ms. After reaching 77.1%(235mm out of 304.5mm) displacement there is a sudden increase in the rigid wall reaction forces because the components absorb more KE. In the fig. below we can see the difference in rigid wall reaction forces in case 1&3
Recommendations interfaces are applied.
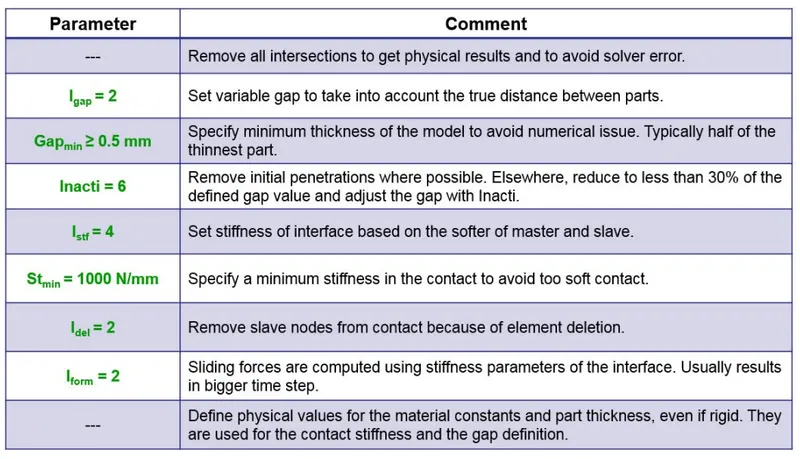
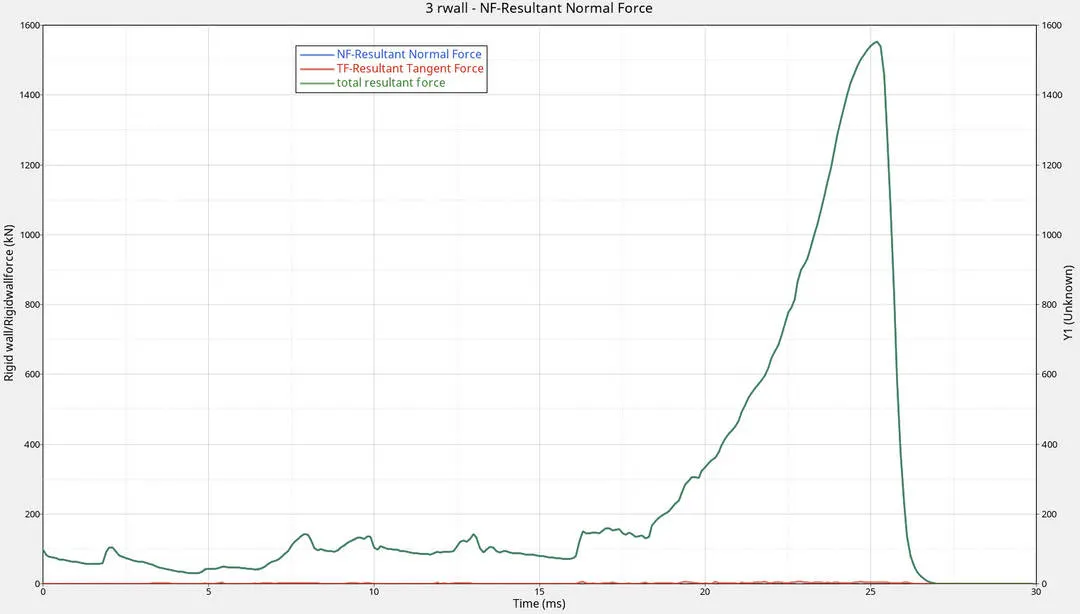
Fig. 3.3: Rigid Wall Forces
In the fig 3.4 show the energies graph.
because Istiff = 4 Interface stiffness is the minimum of the master and slave stiffness. Because of minimum stiffness we can see the velocity is moving fast and reach the 87% (266 out of 304.5) deformation in 25.3ms with internal energy of 40628.2Kg-mm^2/ms^2
b. KE max= 44400.8 Kg-mm^2/ms^2 at time 0 ms
c. Internal energy max= 40628.2Kg-mm^2/ms^2 at time 25.3ms^2
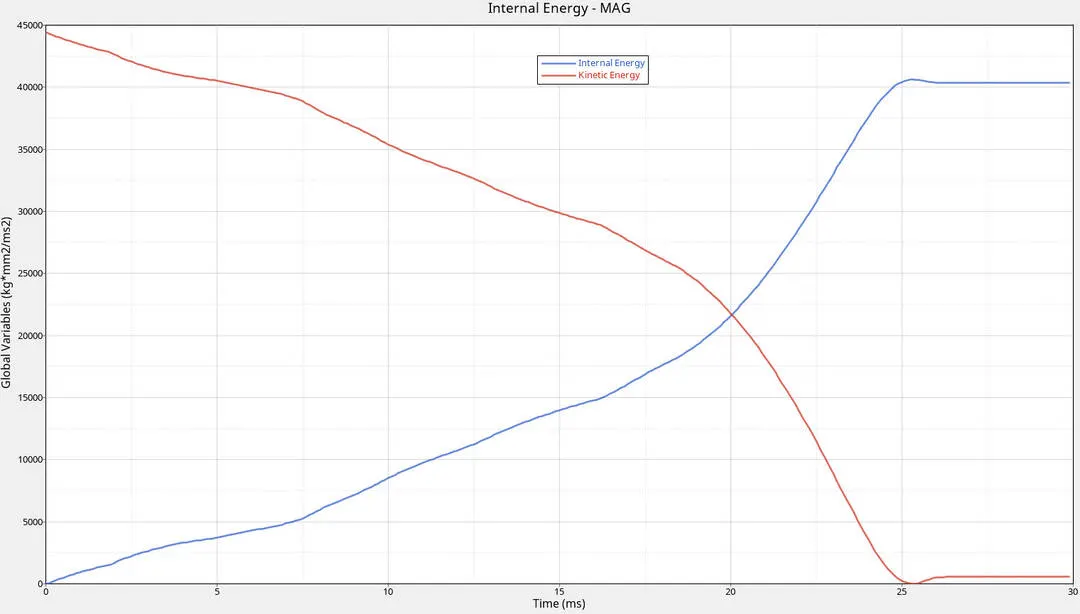
due to less stiffer the contact energy produced to over come on interface is more so we can see the contact energy is more with less time compare to case 1
d. Contact energy= 3698.2 Kg-mm^2/ms^2
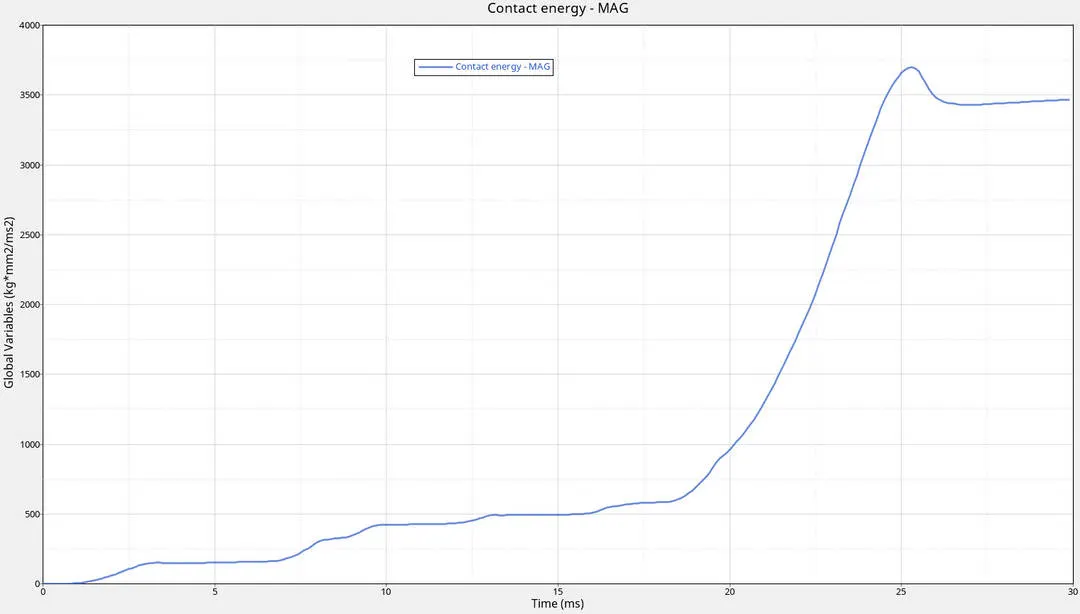
Fig. 3.4: Internal and Contact energy
Case 4 (Removed all Notch with type 7): In this case we have removed all notches and type 7 default setting.
1.Because of no notch and thickness is less at bottom which is 2mm so the doformation starts from bottom . 76.65%(233.743 out of 304.5) 0f Displacement takes in 20ms with reaction rigid wall forces fluctuating from 0 to 200KN
2. After that 91%(279 out of 304.5mm) deformation done in 27ms with rigid wall reaction force of 1197.85KN
3. At 0.2ms we have more rigid waal forces compared to case 1 this is because no notch so there is no stress concentration.
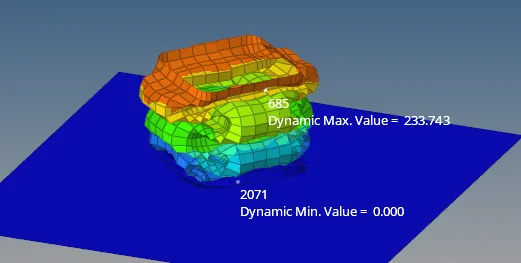
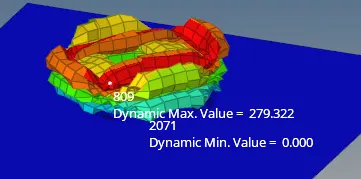
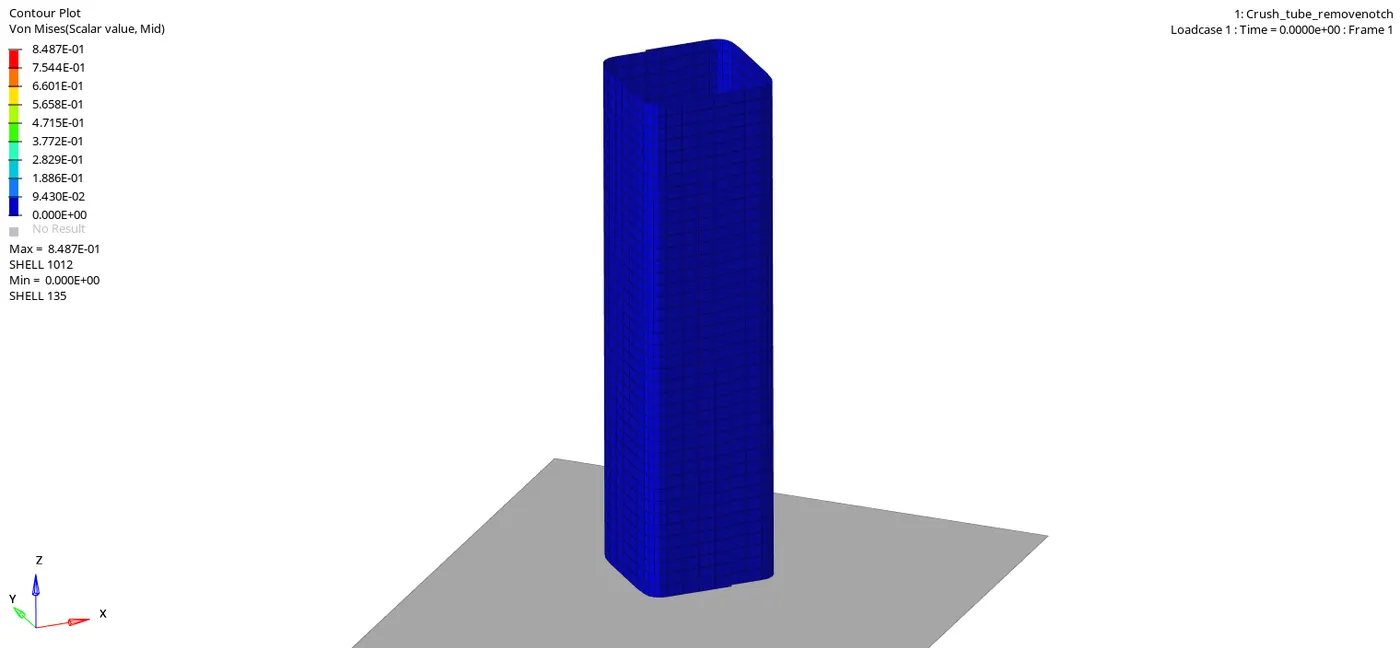
Fig. 4.1: Case 4 Simulation
In the figure 4.1 shows simulation and 4.2 shows rigid wall Graph
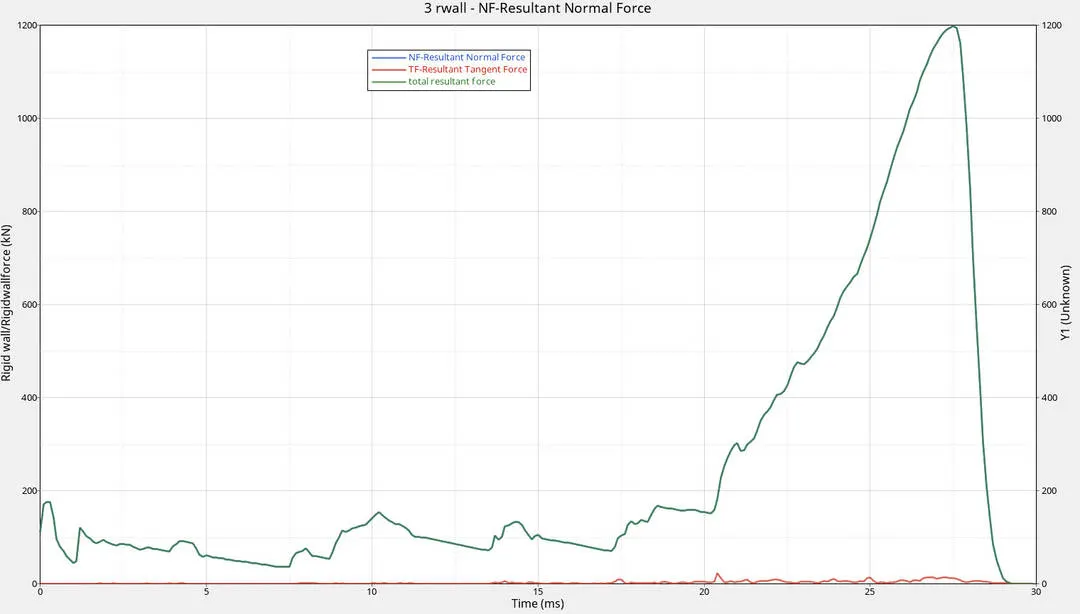
Fig. 4.2: Rigidwall force
In the fig 3.4 show the energies graph.
1. By removing of notch,the model become more stiffer compare to the case 1 so we can see the time taken to displace 91% in 27.5 ms i.e it taking more time with more Losing more KE to Deform 91% compare to case 1 it taken less time to defom 92%.
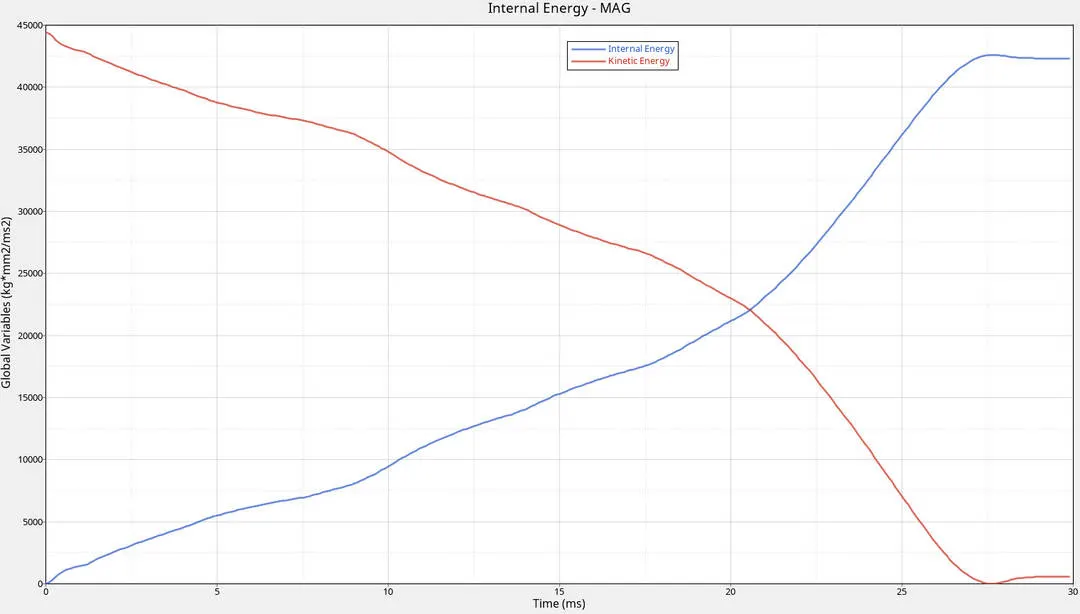
Contact energy is 1563.06 Kg-mm^2/ms^2 at time 27.6 ms, it is less because the model has more stiffness then case 1 so force produced to overcome the interface is less.
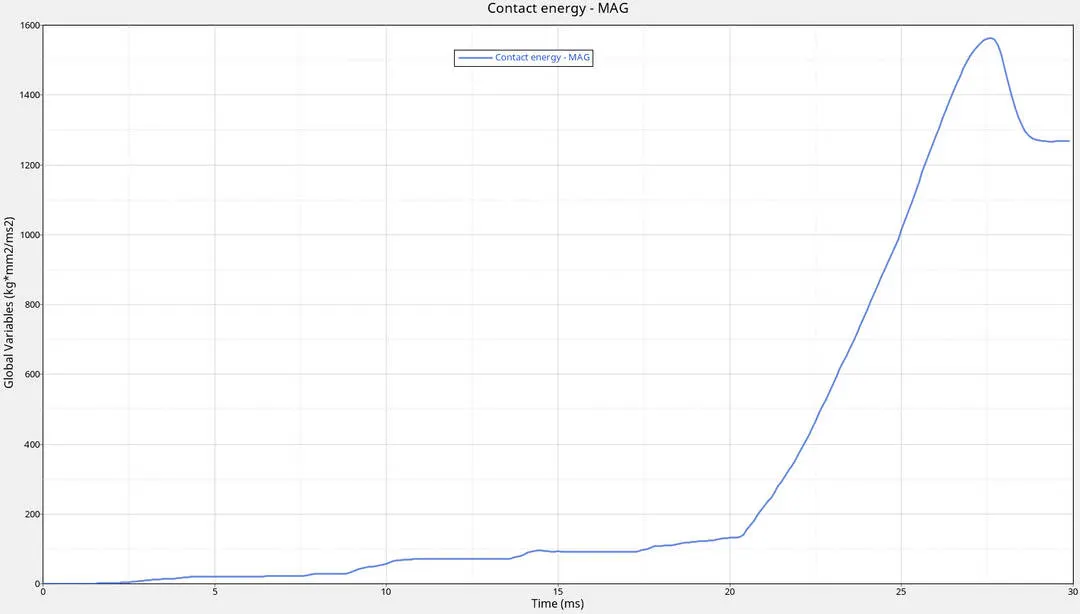
Fig. 3.4: Internal and Contact energy
case 5(Middle notch): Create notch at middle and type 7 default setting.
From the simulation and Reaction forces from the rigid wall shown in the fig. 5.2, 5.3
1. Deformation takes at middle notch of model due to applied velocity due to stress concentration near notch
2. After complete deformation of the notch. The next deformation occurs at bottom which is near to the Rigi wall this is because thickness is less at bottom which is 2mm. with rigid wall force range from 0 to 150KN,
3. To deform the 3mm thickness part it required morre KE compared to 2mm thick . so we can see the reaction force increased to 200KN and fluctuating.
4. This case can be considered average of case 1 and 4. the Reaction force max 1255.04KN at 27.1ms
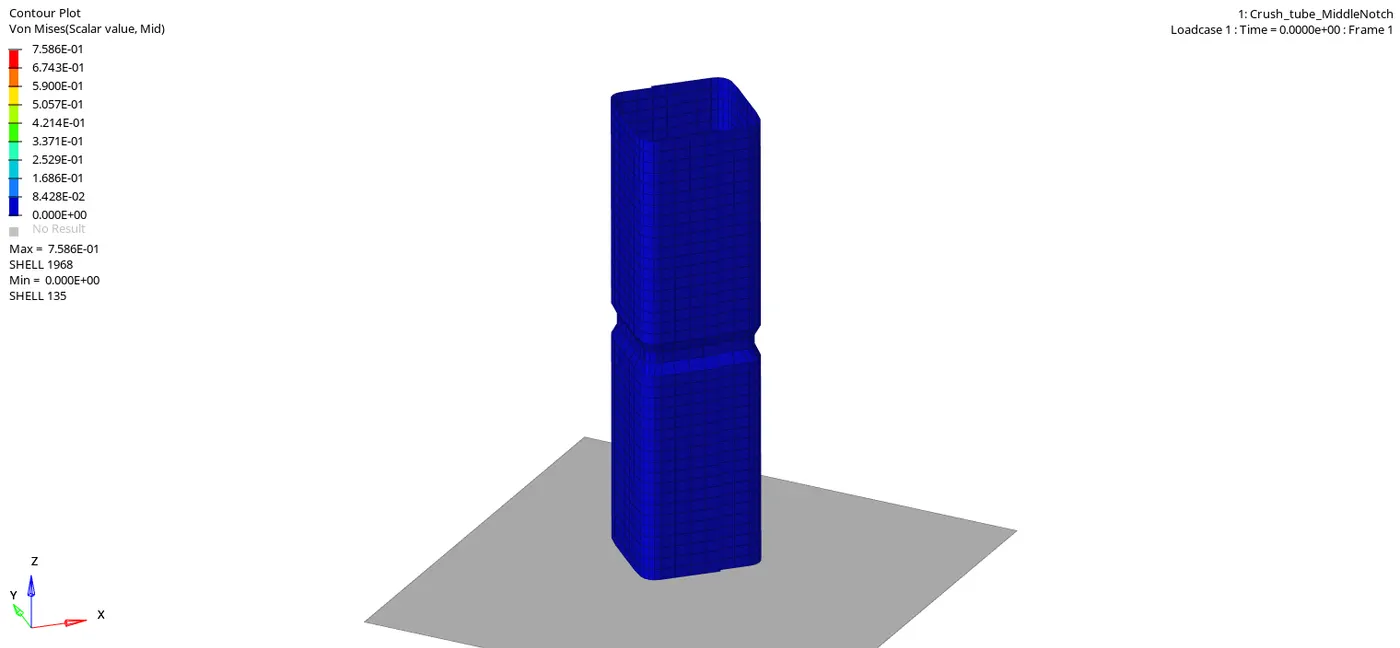
Fig. 5.2: Case 5 Simulation
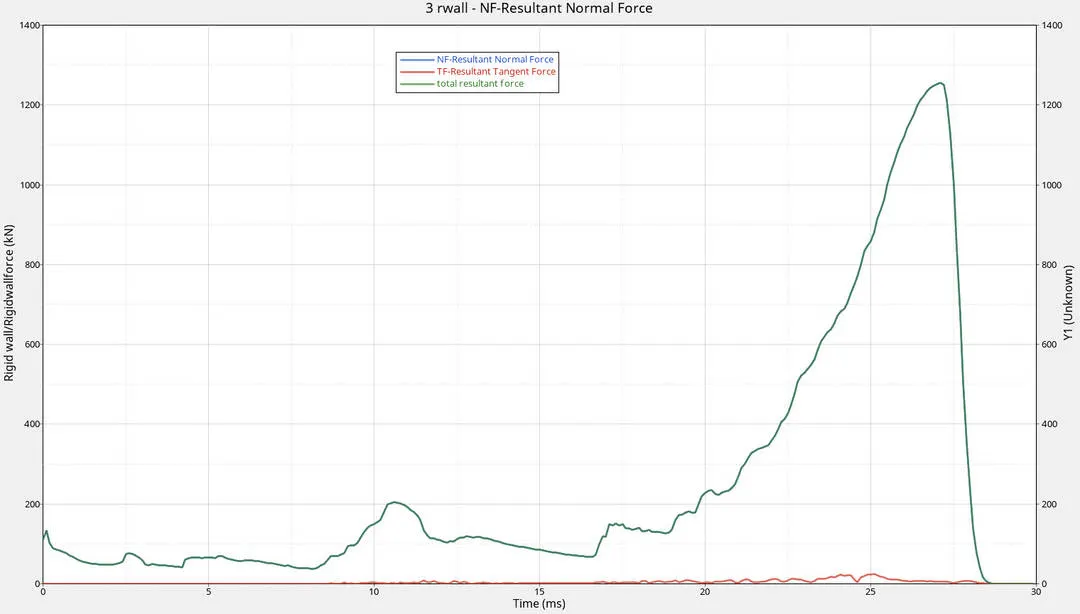
Fig. 5.3: Rigidwall force
KE and Internal energy are completely depending how the structure responding when deformation occur, other then that concept of increasing IE and decreasing in KE is same as explained in case 1
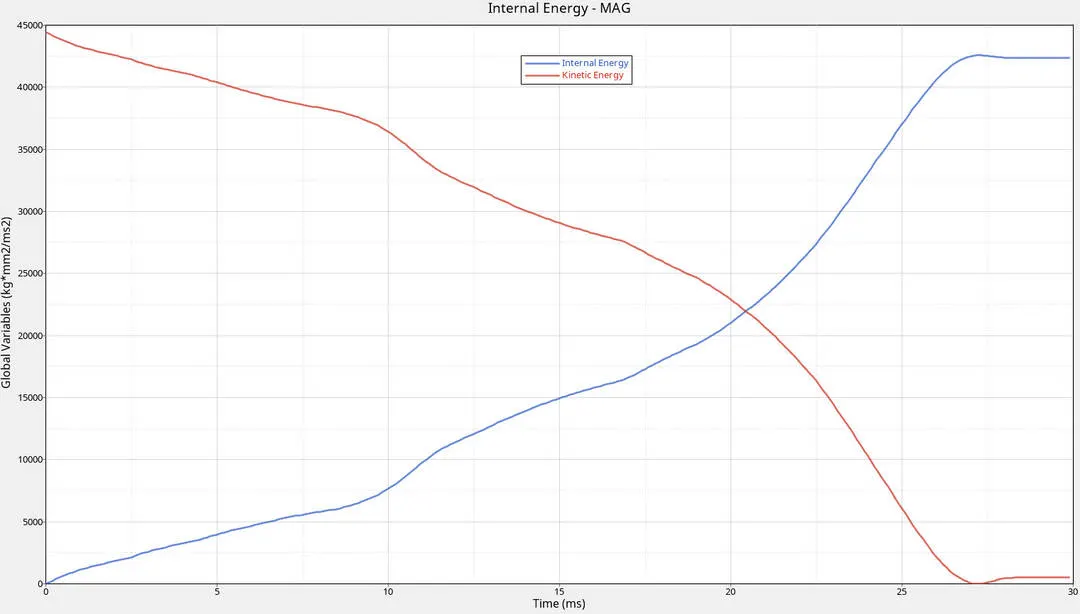
Contact energy is 1525.86 Kg-mm^2/ms^2 at time 27.2ms, it less because the model has average stiffness of Case 1&2.
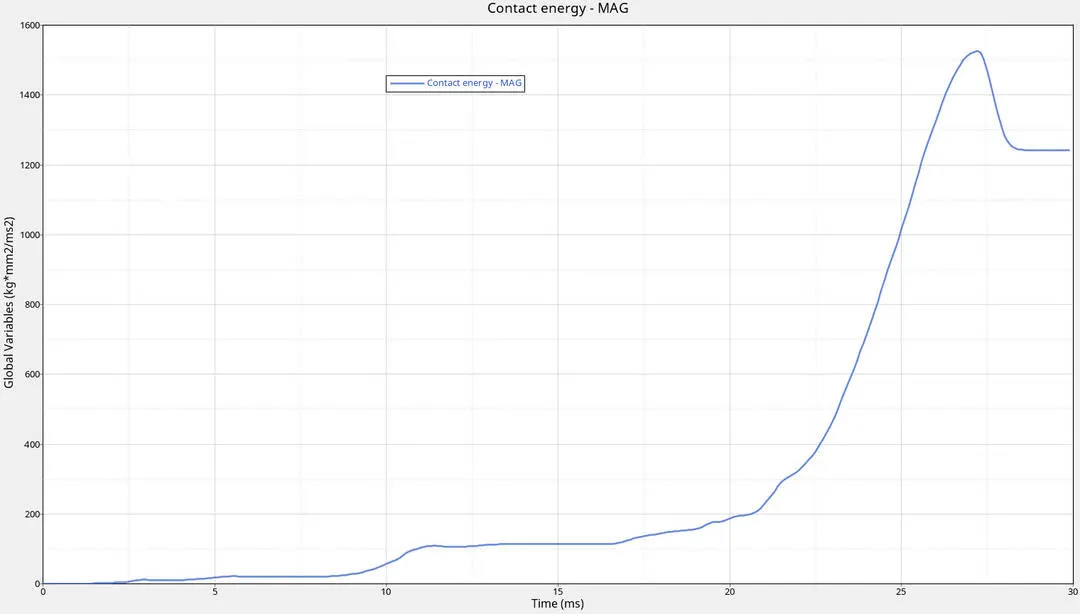
Fig. 5.4: Internal and Contact energy
case 6( notch at 2 opposite faces): Create notch at middle only for two opposite face and type 7 default setting.
From the simulation and Reaction forces from the rigid wall shown in the fig. 5.2, 5.3
1. Deformation takes at middle notch of model due to applied velocity due to stress concentration near notch
2. After complete deformation of the notch. The next deformation occurs at bottom which is near to the Rigi wall this is because thickness is less at bottom which is 2mm. with rigid wall force range from 0 to 150KN,
3. To deform the 3mm thickness part it required morre KE compared to 2mm thick . so we can see the reaction force increased to 200KN and fluctuation
4. tThis case can be considered average of case 4 and 5. the Reaction force max 1299.04KN at 27ms
Fig. 5.2: Case 5 Simulation
Fig. 5.3: Rigidwall force
KE and Internal energy are completely depending how the structure responding when deformation occur, other then that concept of increasing IE and decreasing in KE is same as explained in case 1
Contact energy is 1532.86 Kg-mm^2/ms^2 at time 27.ms, less because the model has average stiffness of Case 1&2.
Fig. 5.4: Internal and Contact energy
case 6 is less stiffer to compare case 4 but more stiffer to compare case 5
How does the notch affect the results?
Notch affect the results because without notch the structure behaves more stiffer due to more stiffer so we can see more nemesis stress,
According to my knowledge all notches which are perpendicular applied force makes structure less stiffer
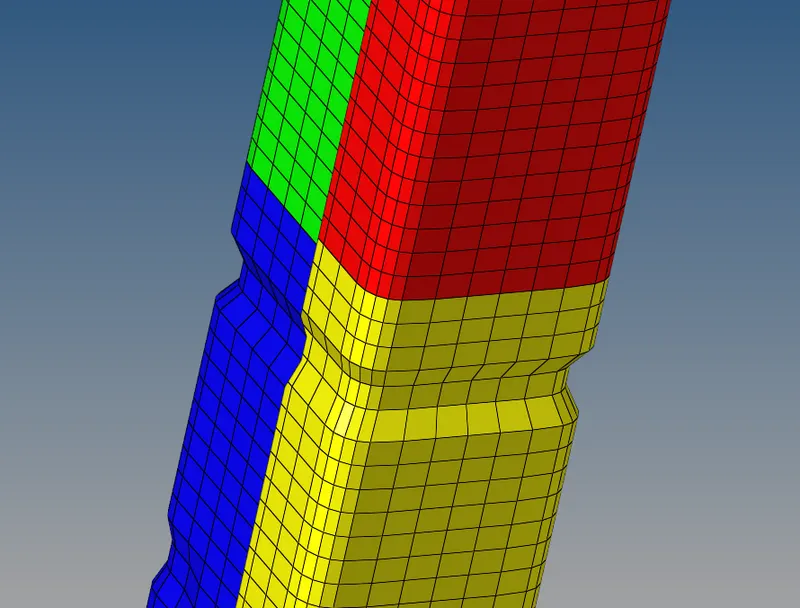
All notches which are parallel applied force makes structure more stiffer