Assignment 4-RADIOSS Material Laws Challenge
Objective
To compare and study the simulation results of the 7 different cases and identify the differences in the key result parameters.
Case 1: M2 - JOHNSON COOK - EPS P MAX FAILURE MODE
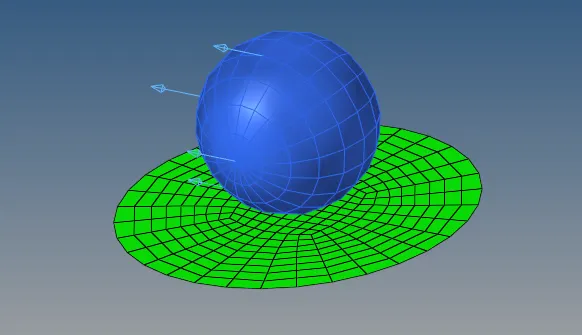
The given model FAILURE_JOHNSON_0000.rad is imported into RADIOSS and the two components - the circular plate and the rigid sphere - are visualized.
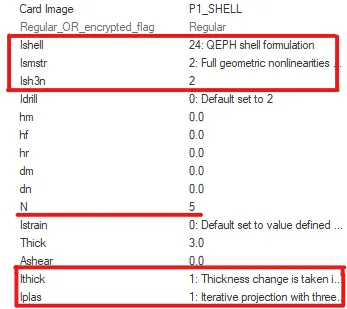
The circular plate is defined with 2D shell elements of QEPH 24 formulation and all the recommended shell properties seen previously, as shown below.
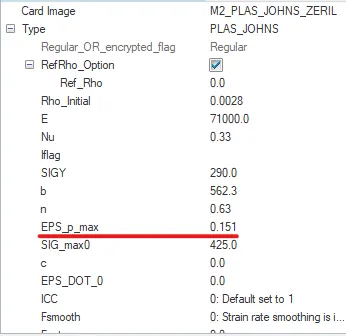
The material card is defined as shown in the image below. The value used for the failure plastic strain value eps_p_max is 0.151. The elastic region of the material is defined using the three value of E,Nu and Rho_Initial.
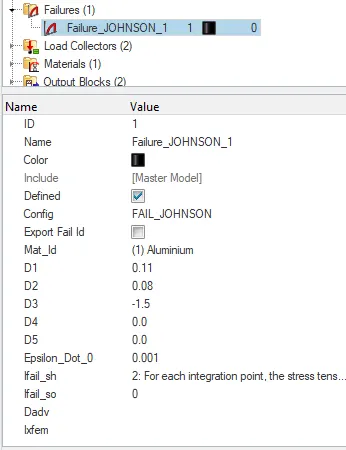
The material has a FAIL_JOHNSON failure card defined with default parameters as shown below.
Results
The simulation is run using these default settings and the important results of the simulation run, such as number of cycles, simulation time, mass and energy errors, can be viewed in the 0001.out file, as shown below.
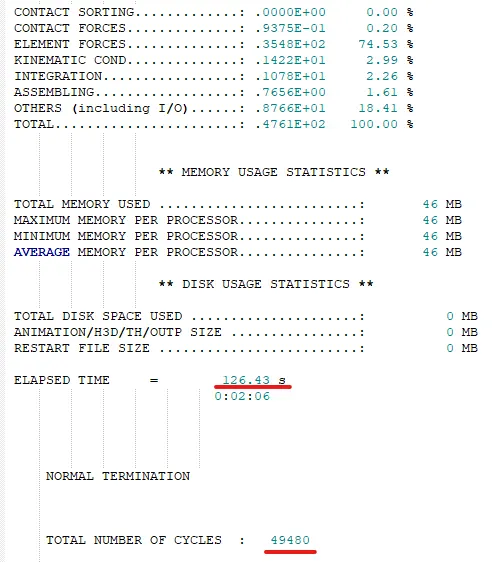
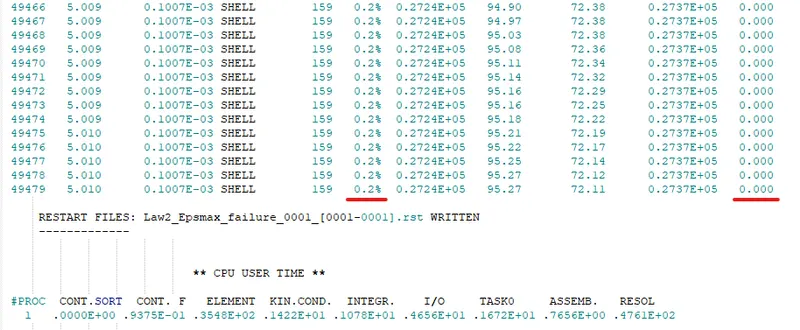
Displacement and Von-Mises stress
The displacement and the von mises stress values can be visualized in Hyperview as shown below.
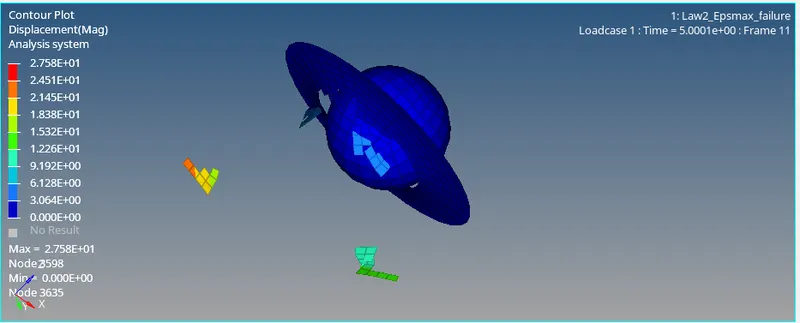
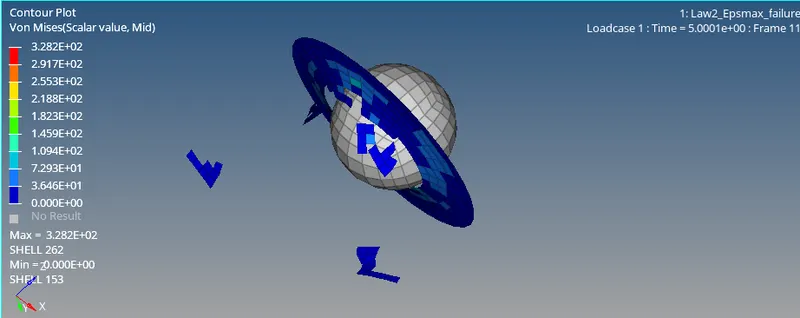
It can be observed that the element breakage occurs, since the circular plate has been defined using a elasto-plastic material card. The max values of the displacement and the von mises stress can be seen in the images above.
Energy Plot
The internal, kinetic, hourglass and the total energies can be plotted using the TO1 file in Hypergraph 2D, as shown below.
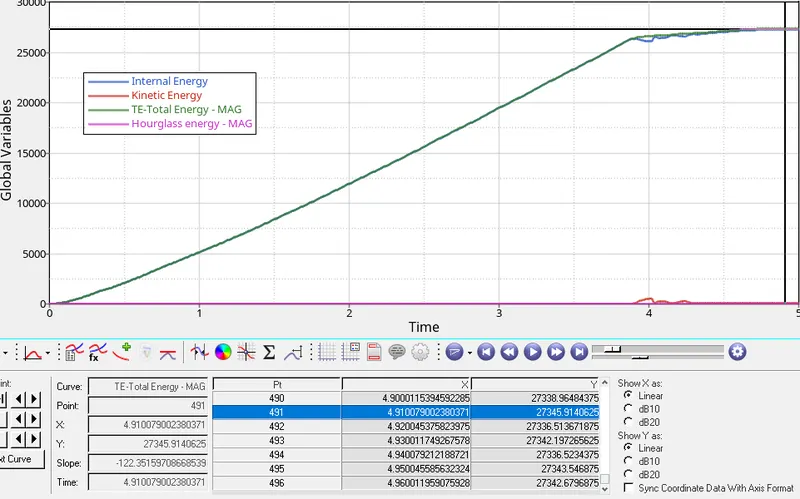
The max value of the total energy is 27345.91.
The internal energy curve closely follows the total energy curve, with slight differences at around 4 seconds, when the breakage occurs and the kinetic energy shows slight variations. However, the hourglass energy remains 0, since the QEPH 24 element formulation has integrated hourglass control.
Resultant rigid wall force
The max resultant rigid wall force and the point at which it occurs is shown in the figure below.
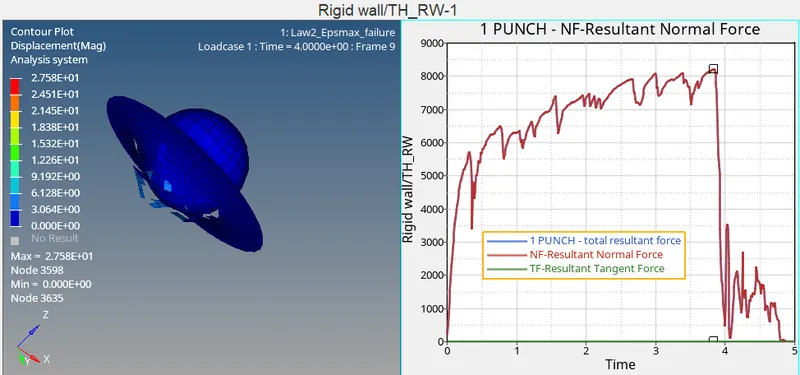
The max resultant force is 8215.07, which occurs at the point where element breakage starts to have an impact, and the forces reduce drastically thereafter, since very few elements of the circular plate are in contact with the rigid sphere thereafter.
Case 2: M2 - JOHNSON COOK - FAIL JOHNSON PARAMETERS
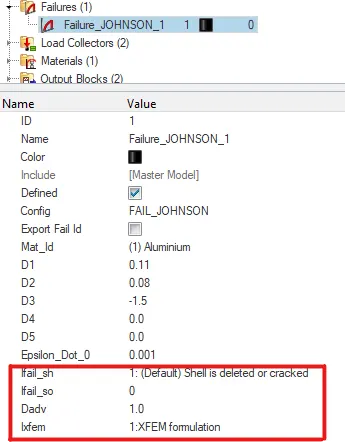
The properties of the failure card are modified to the values are shown in the figure below.
Results
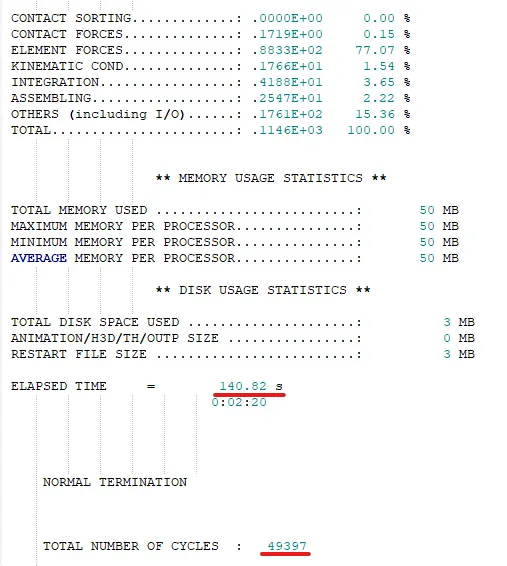
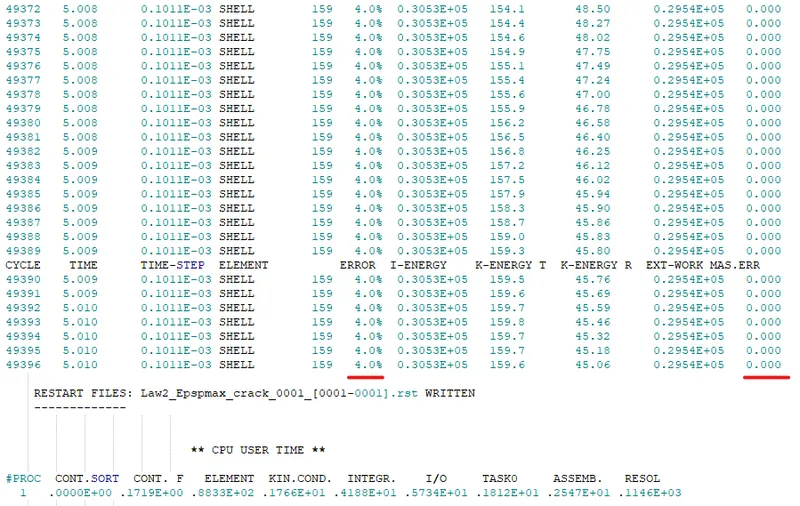
The simulation is run using these settings and the important results of the simulation run, such as number of cycles, simulation time, mass and energy errors, can be viewed in the 0001.out file, as shown below.
Displacement and Von-Mises stress
The displacement and the von mises stress values can be visualized in Hyperview as shown below.
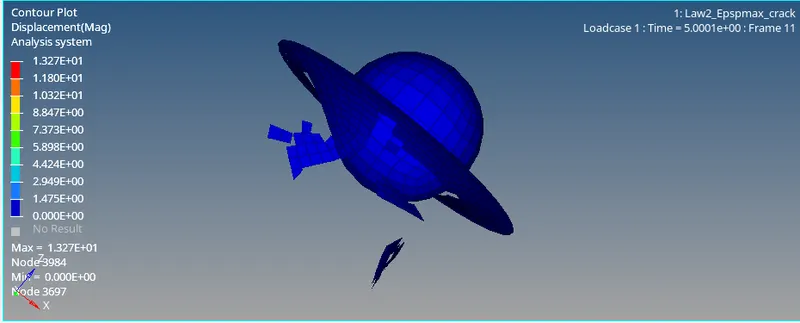
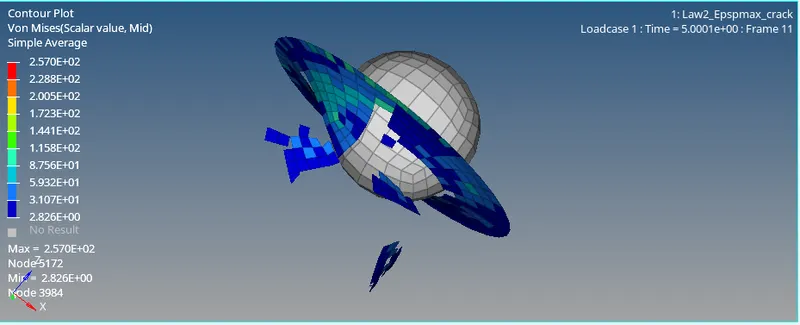
It can be observed that the element breakage occurs, since the circular plate has been defined using a elasto-plastic material card. The max values of the displacement and the von mises stress can be seen in the images above.
Energy Plot
The internal, kinetic, hourglass and the total energies can be plotted using the TO1 file in Hypergraph 2D, as shown below.
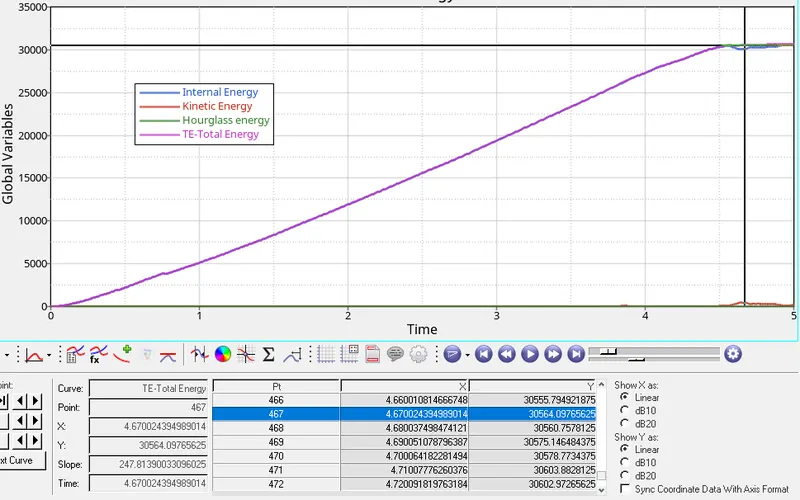
The max value of the total energy is 30564.07.
The internal energy curve closely follows the total energy curve, with slight differences at around 4 seconds, when the breakage occurs and the kinetic energy shows slight variations. However, the hourglass energy remains 0, since the QEPH 24 element formulation has integrated hourglass control.
Resultant rigid wall force
The max resultant rigid wall force and the point at which it occurs is shown in the figure below.
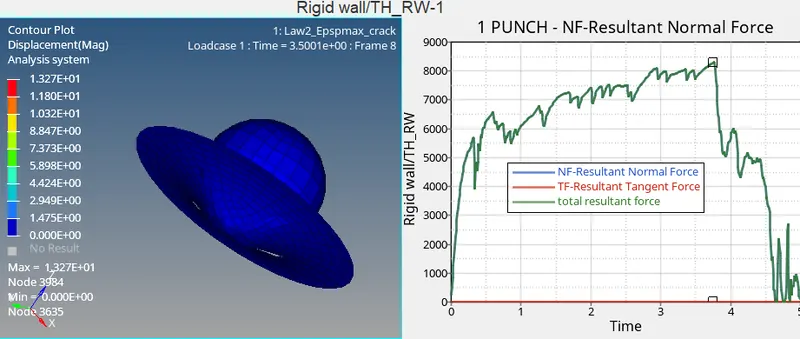
The max resultant force is 8312.17, which occurs at the point where element breakage starts to have an impact, and the forces reduce drastically thereafter, since very few elements of the circular plate are in contact with the rigid sphere thereafter.
Case 3: M2 - JOHNSON COOK - FAIL JOHNSON REMOVED
The failure card is removed from the model and the simulation is run with the other parameters remaining the same.
Results
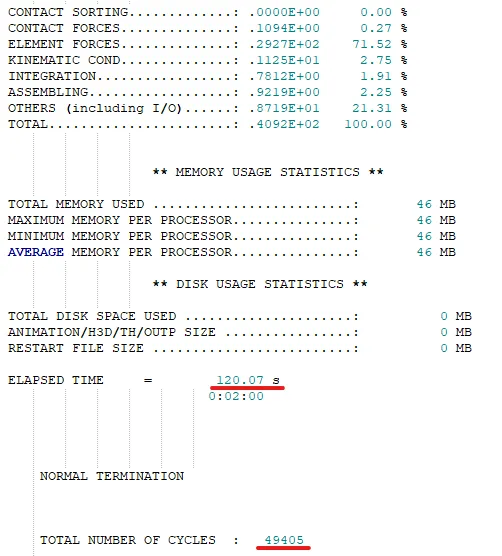
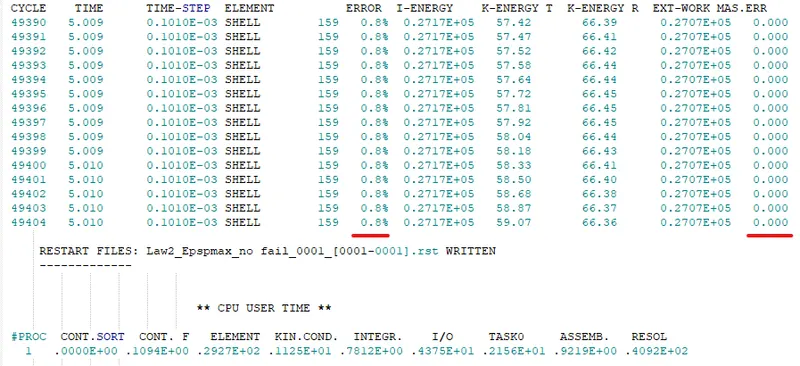
The simulation is run using these settings and the important results of the simulation run, such as number of cycles, simulation time, mass and energy errors, can be viewed in the 0001.out file, as shown below.
Displacement and Von-Mises stress
The displacement and the von mises stress values can be visualized in Hyperview as shown below.
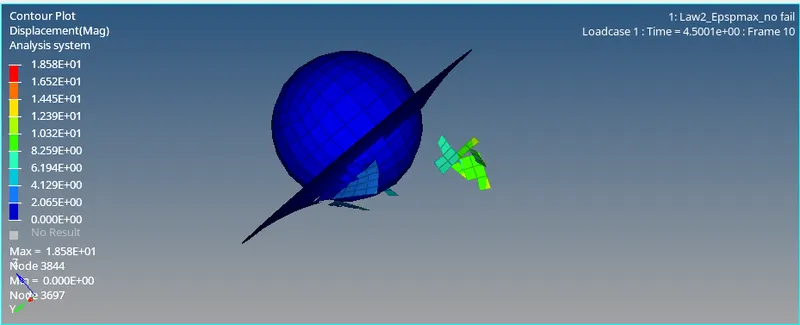
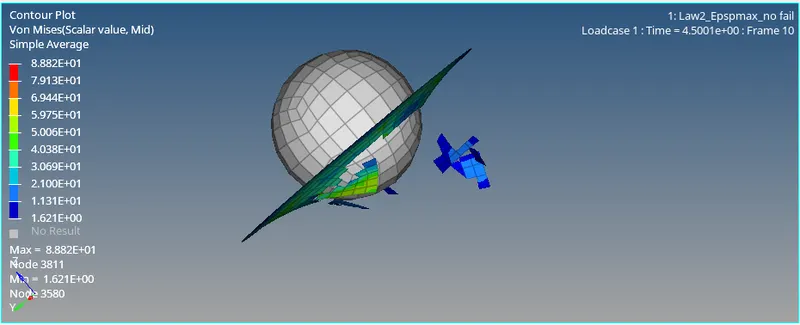
It can be observed that the element breakage occurs, since the circular plate has been defined using a elasto-plastic material card. The max values of the displacement and the von mises stress can be seen in the images above.
Energy Plot
The internal, kinetic, hourglass and the total energies can be plotted using the TO1 file in Hypergraph 2D, as shown below.
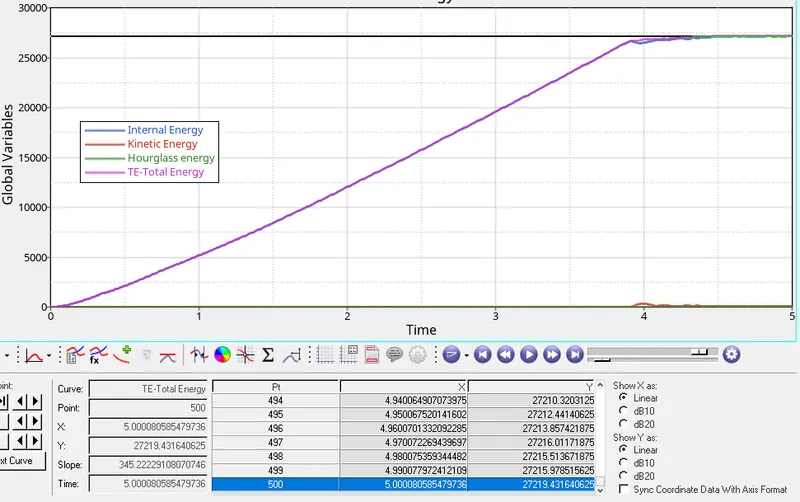
The max value of the total energy is 27219.43.
The internal energy curve closely follows the total energy curve, with slight differences at around 4 seconds, when the breakage occurs and the kinetic energy shows slight variations. However, the hourglass energy remains 0, since the QEPH 24 element formulation has integrated hourglass control.
Resultant rigid wall force
The max resultant rigid wall force and the point at which it occurs is shown in the figure below.
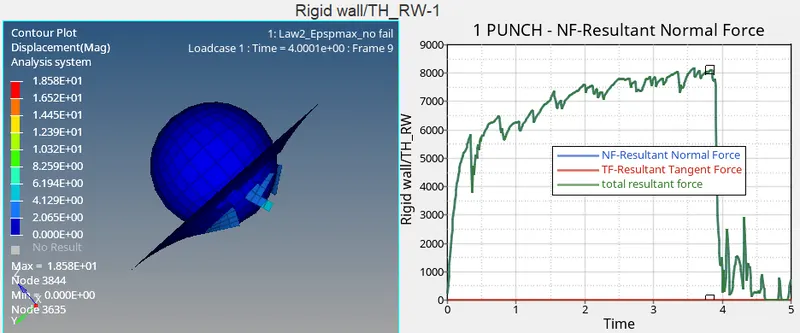
The max resultant force is 8176.41, which occurs at the point where element breakage starts to have an impact, and the forces reduce drastically thereafter, since very few elements of the circular plate are in contact with the rigid sphere thereafter.
Case 4: M2 - JOHNSON COOK - EPS P MAX = 0
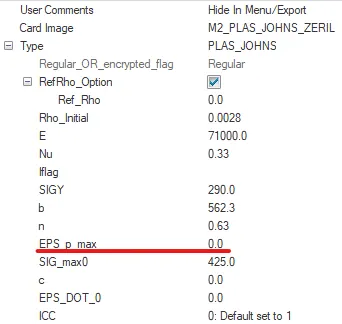
The plastic failure strain eps_p_max is set to zero, which means that the failure would now occur only according the the max stress value SIG_max0, which has been set here to 425, as can be seen in the image below.
Results
The simulation is run using these settings and the important results of the simulation run, such as number of cycles, simulation time, mass and energy errors, can be viewed in the 0001.out file, as shown below.
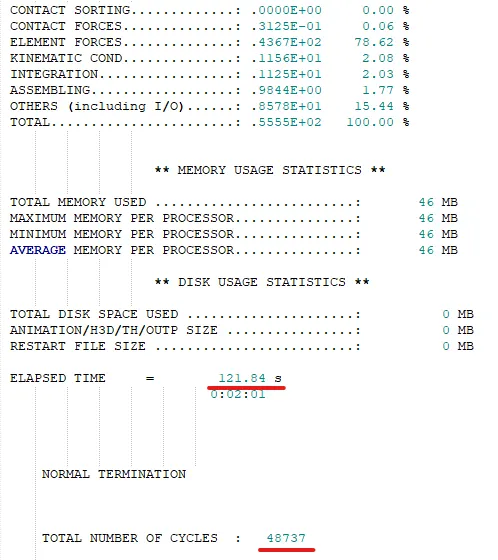
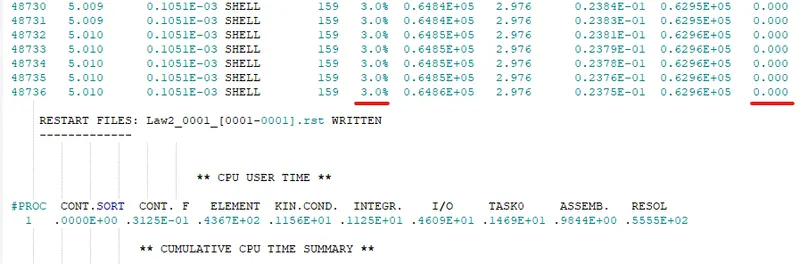
Displacement and Von-Mises stress
The displacement and the von mises stress values can be visualized in Hyperview as shown below.
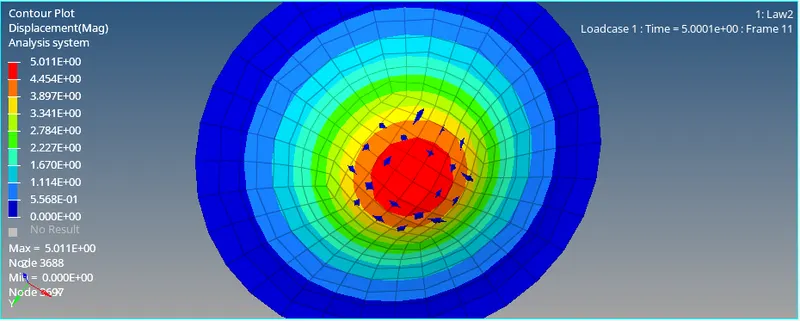
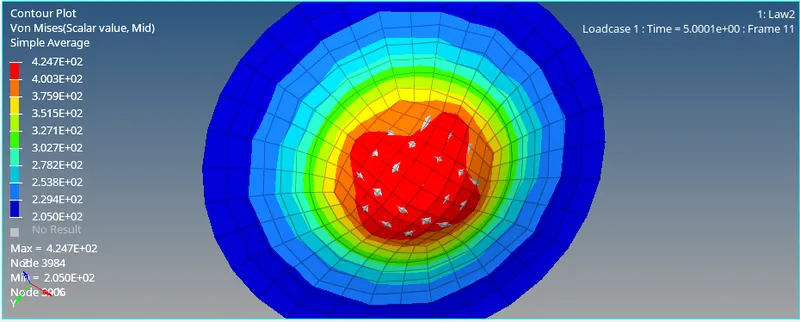
It can be observed that the element breakage does not occur, since the material failure has not been defined based on a plastic failure strain value. The max values of the displacement and the von mises stress can be seen in the images above. It can be seen that the max value of stress attained is 424.7, which is extremely close to the failure stress of 425.
Energy Plot
The internal, kinetic, hourglass and the total energies can be plotted using the TO1 file in Hypergraph 2D, as shown below.
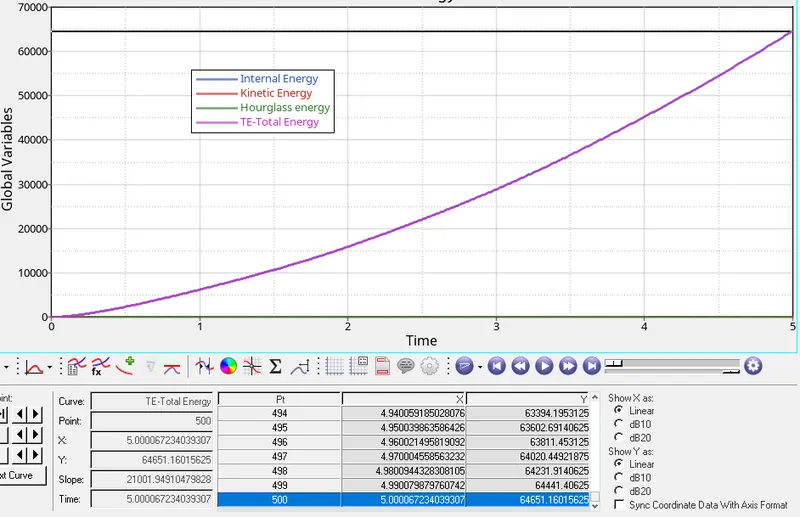
The max value of the total energy is 64651.16. The value of the energy absorbed is much higher, since element failure does not occur until the end of the simulation
The internal energy curve closely follows the total energy curve, with both showing a non-linear increase with time, as the stress and therefore the energy increasing parabolically once the sphere has made contact with the plate. However, the hourglass energy remains 0, since the QEPH 24 element formulation has integrated hourglass control.
Resultant rigid wall force
The max resultant rigid wall force and the point at which it occurs is shown in the figure below.
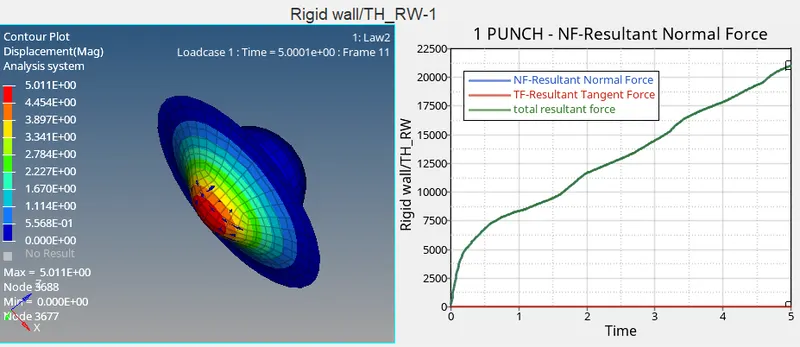
The max resultant force is 21025.71, which occurs at the very end of the simulation, where the normal forces between the sphere and the plate are at a maximum.
Case 4: M1 - ELASTIC
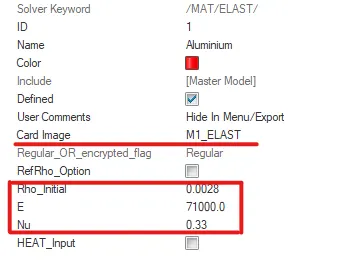
The material is now changed to an elastic formulation with the M1_ELAST card. The elastic region is defined using the three parameters E, Nu and Rho.
Results
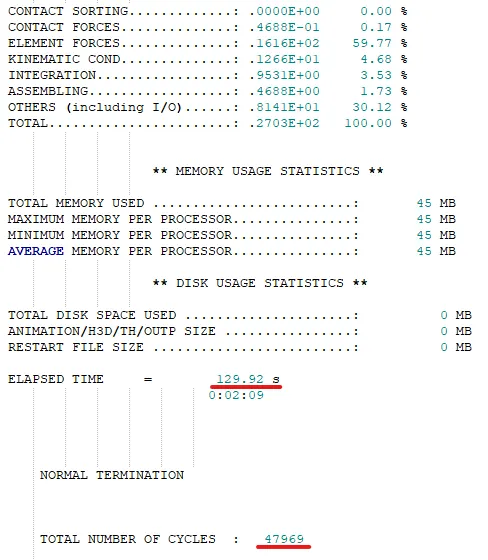
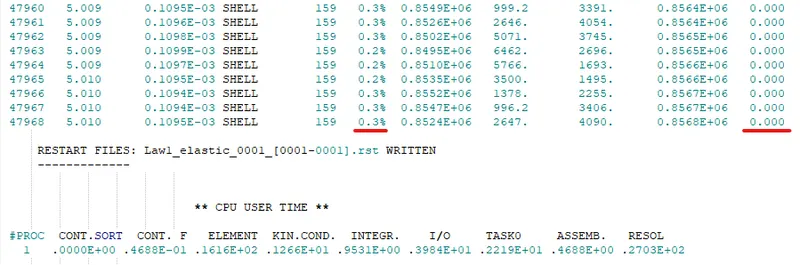
The simulation is run using these settings and the important results of the simulation run, such as number of cycles, simulation time, mass and energy errors, can be viewed in the 0001.out file, as shown below.
Displacement and Von-Mises stress
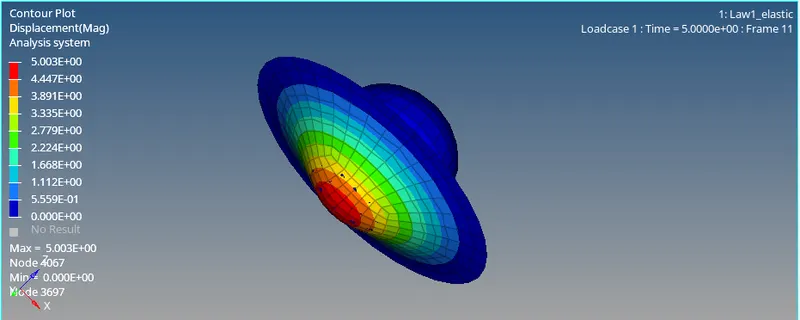
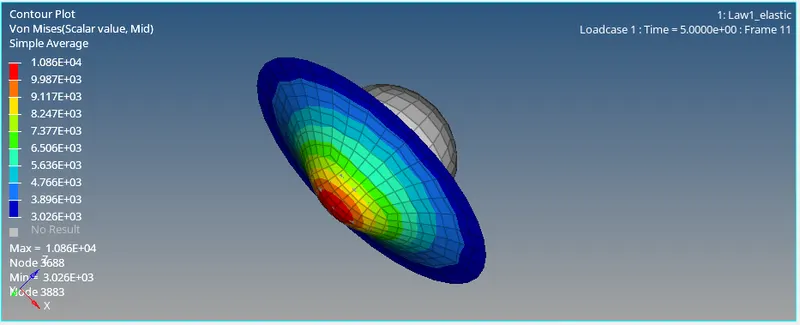
The displacement and the von mises stress values can be visualized in Hyperview as shown below.
It can be observed that the element breakage does not occur, since the material failure has not been defined based on a plastic failure strain value. The max values of the displacement and the von mises stress can be seen in the images above. It can be seen that the max value of stress attained is 424.7, which is extremely close to the failure stress of 425.
Energy Plot
The internal, kinetic, hourglass and the total energies can be plotted using the TO1 file in Hypergraph 2D, as shown below.
The max value of the total energy is 64651.16. The value of the energy absorbed is much higher, since element failure does not occur until the end of the simulation
The internal energy curve closely follows the total energy curve, with both showing a non-linear increase with time, as the stress and therefore the energy increasing parabolically once the sphere has made contact with the plate. However, the hourglass energy remains 0, since the QEPH 24 element formulation has integrated hourglass control.
Resultant rigid wall force
The max resultant rigid wall force and the point at which it occurs is shown in the figure below.
The max resultant force is 21025.71, which occurs at the very end of the simulation, where the normal forces between the sphere and the plate are at a maximum.
Case 5: M1 - ELASTIC
The material is now changed to an elastic formulation with the M1_ELAST card. The elastic region is defined using the three parameters E, Nu and Rho.
Results
The simulation is run using these settings and the important results of the simulation run, such as number of cycles, simulation time, mass and energy errors, can be viewed in the 0001.out file, as shown below.
Displacement and Von-Mises stress
The displacement and the von mises stress values can be visualized in Hyperview as shown below.
It can be observed that the element breakage does not occur, since the material has been considered as elastic. The max values of the displacement and the von mises stress can be seen in the images above. It can be seen that the max value of stress attained is 10860, which is extremely high.
Energy Plot
The internal, kinetic, hourglass and the total energies can be plotted using the TO1 file in Hypergraph 2D, as shown below.
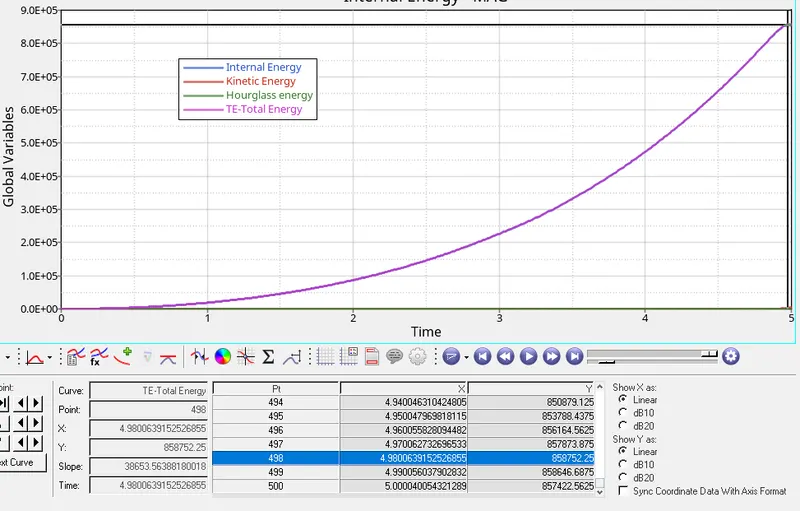
The max value of the total energy is 858752.25. The value of the energy absorbed is much higher, since element failure does not occur until the end of the simulation.
The internal energy curve closely follows the total energy curve, with both showing a non-linear increase with time, as the stress and therefore the energy increase parabolically once the sphere has made contact with the plate. However, the hourglass energy remains 0, since the QEPH 24 element formulation has integrated hourglass control.
Resultant rigid wall force
The max resultant rigid wall force and the point at which it occurs is shown in the figure below.
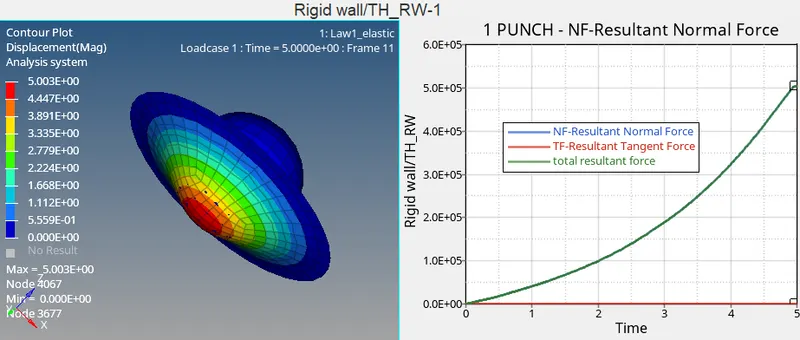
The max resultant force is 504444.50, which occurs at the very end of the simulation, where the normal forces between the sphere and the plate are at a maximum.
Case 6: M27 - PLAS_BRIT
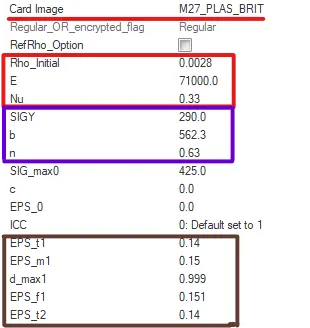
The material is now changed to a plastic_brittle formulation with the M27_PLAS_BRIT card.
- The elastic region is defined using the three parameters E, Nu and Rho (denoted in red).
- The plastic region is defined using the yield stress (SIGY), hardness modulus (b) and hardness exponent (n) (denoted in purple).
- The failure is defined by the strain values given at the end (denoted in brown).
Results
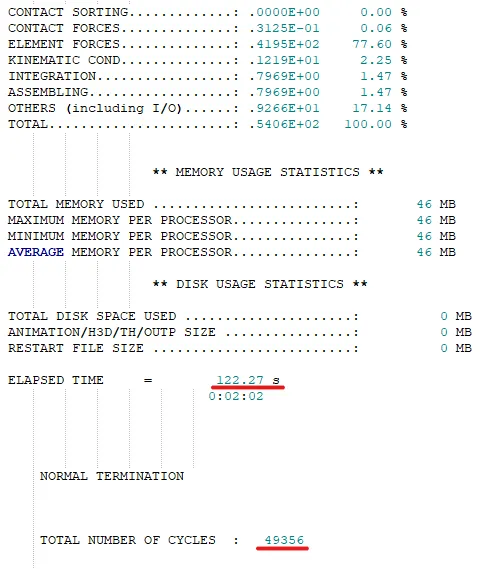
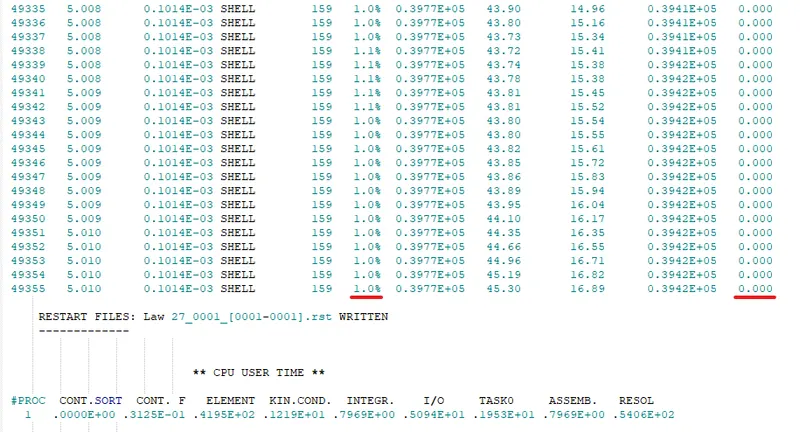
The simulation is run using these settings and the important results of the simulation run, such as number of cycles, simulation time, mass and energy errors, can be viewed in the 0001.out file, as shown below.
Displacement and Von-Mises stress
The displacement and the von mises stress values can be visualized in Hyperview as shown below.
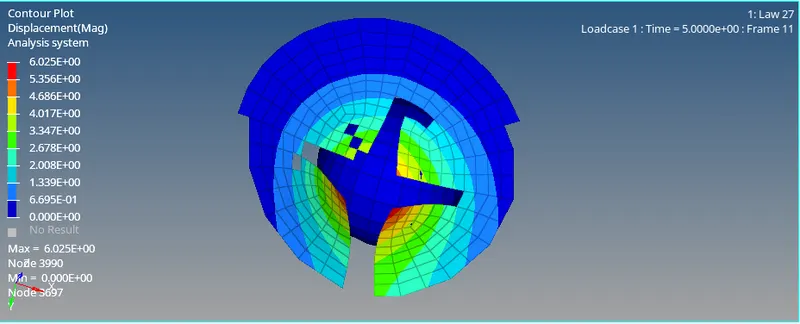
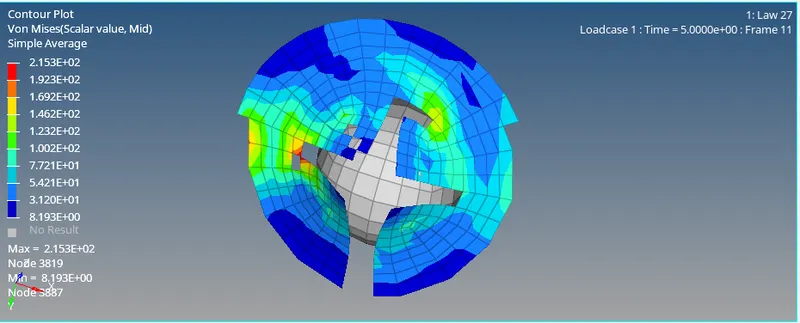
It can be observed that the circular plate is torn apart from the center and the crack proprogates through to the edge of the circular plate, eliminating quite a few elements. The max values of the displacement and the von mises stress can be seen in the images above.
Energy Plot
The internal, kinetic, hourglass and the total energies can be plotted using the TO1 file in Hypergraph 2D, as shown below.
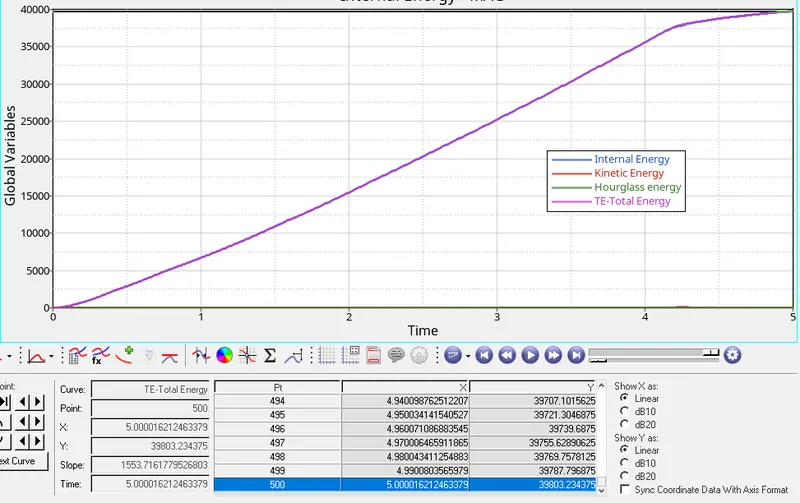
The max value of the total energy is 39803.234. The value of the energy absorbed is in a similar range to that of the M2 JOHNSON-COOK law.
The internal energy curve closely follows the total energy curve. However, the hourglass energy remains 0, since the QEPH 24 element formulation has integrated hourglass control.
Resultant rigid wall force
The max resultant rigid wall force and the point at which it occurs is shown in the figure below.
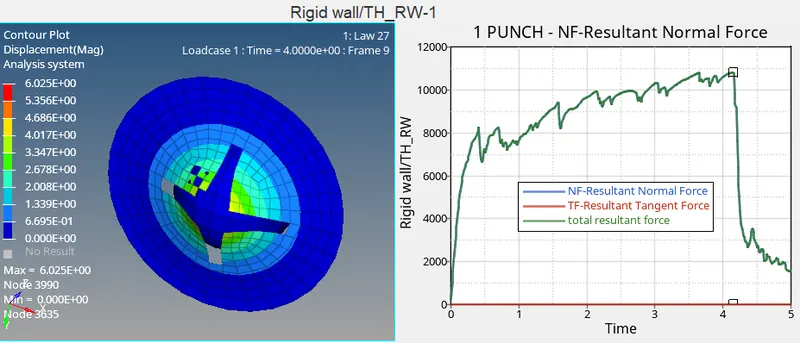
The max resultant force is 10793.78, which occurs at the point where element breakage starts to have an impact, and the forces reduce drastically thereafter, since very few elements of the circular plate are in contact with the rigid sphere thereafter.
Case 7: M36 - PLAS_TAB
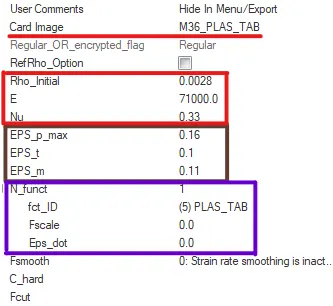
The material is now changed to a plastic formulation with the M36_PLAS_TAB card.
- The elastic region is defined using the three parameters E, Nu and Rho (denoted in red).
- The plastic region is defined using the function id and the load curve (denoted in purple).
- The failure is defined by the strain values given. (denoted in brown).
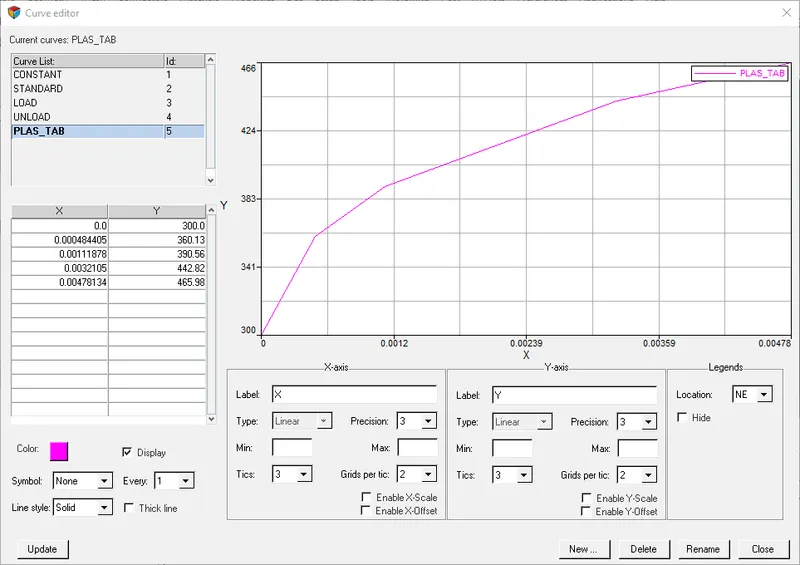
The plastic region is defined starting from the yield stress to the failure strain using the load curve editor as shown in the figure below.
Results
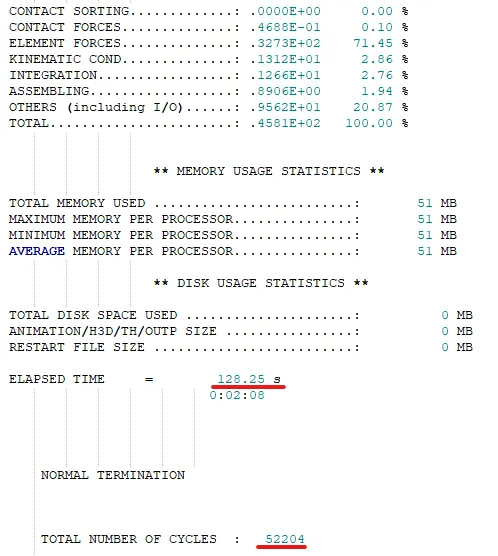
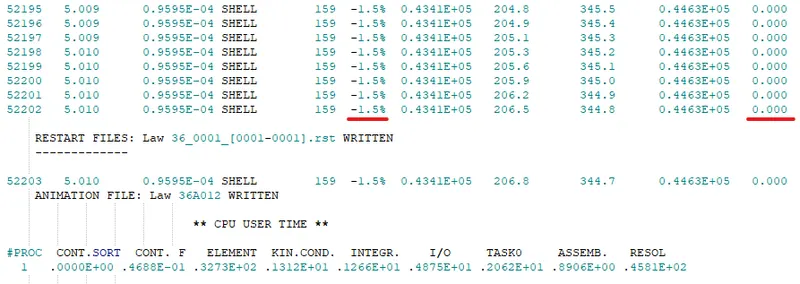
The simulation is run using these settings and the important results of the simulation run, such as number of cycles, simulation time, mass and energy errors, can be viewed in the 0001.out file, as shown below.
Displacement and Von-Mises stress
The displacement and the von mises stress values can be visualized in Hyperview as shown below.
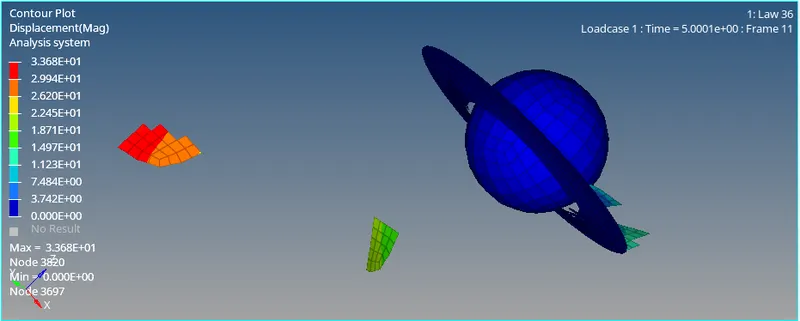
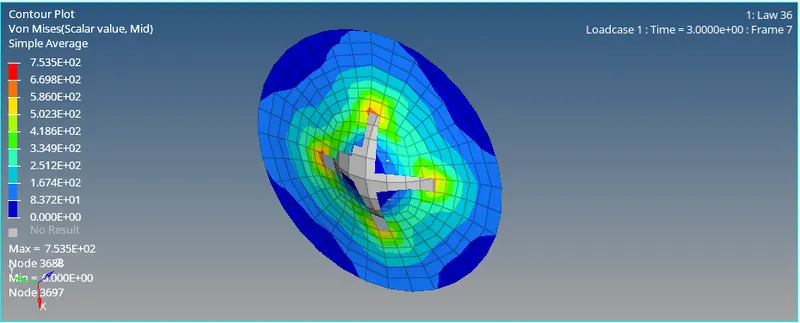
It can be observed that the element breakage occurs, since the circular plate has been defined using a elasto-plastic (piecewise linear) material card. The max values of the displacement and the von mises stress can be seen in the images above.
Energy Plot
The internal, kinetic, hourglass and the total energies can be plotted using the TO1 file in Hypergraph 2D, as shown below.
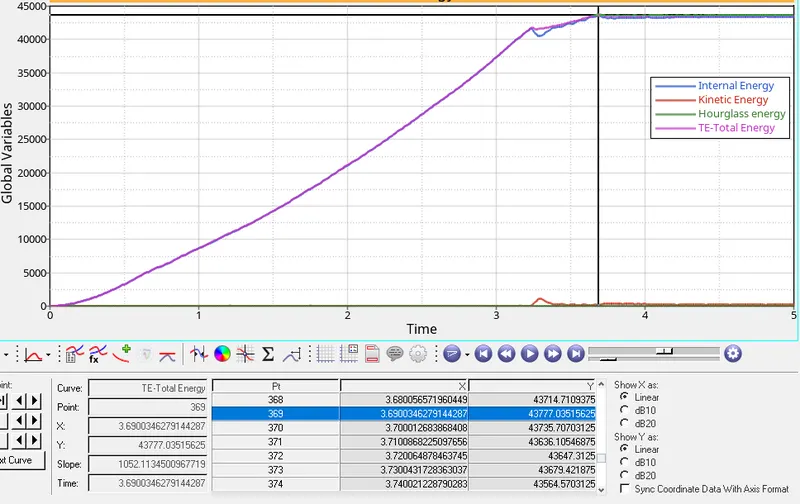
The max value of the total energy is 43777.03. The value of the energy absorbed is in a similar range to that of the M2 JOHNSON-COOK law.
The internal energy curve closely follows the total energy curve. However, the hourglass energy remains 0, since the QEPH 24 element formulation has integrated hourglass control.
Resultant rigid wall force
The max resultant rigid wall force and the point at which it occurs is shown in the figure below.
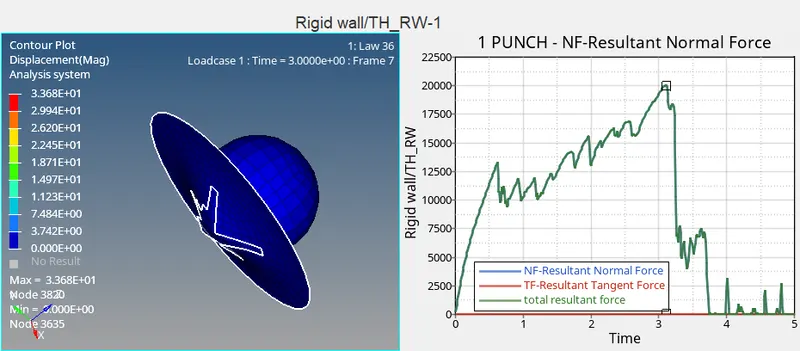
The max resultant force is 20081.40, which occurs at the point where element breakage starts to have an impact, and the forces reduce drastically thereafter, since very few elements of the circular plate are in contact with the rigid sphere thereafter.
Comparison of results
The key values of all the 7 simulations are summarized in the table below and aids finding the case which would best reflect the on-field scenario.
|
CASE |
Number of cycles |
Simulation Time (sec) |
Final Energy error (%) |
Final Mass error (%) |
Max displacement (mm) |
Max von mises stress (kg/mm.ms^2) |
Max total energy (kg.mm^2/ms^2) |
Max resultant force (kg.mm)/ms^2 |
|
1 |
49480 |
126.43 |
0.2 |
0.00 |
27.58 |
328.2 |
27345.91 |
8215.07 |
|
2 |
49397 |
140.82 |
4.0 |
0.00 |
13.27 |
255.0 |
30564.09 |
8312.17 |
|
3 |
49405 |
120.07 |
0.8 |
0.00 |
18.58 |
88.82 |
27219.43 |
8176.41 |
|
4 |
48737 |
121.84 |
3 |
0.00 |
5.011 |
424.7 |
64651.16 |
21025.71 |
|
5 |
47969 |
129.92 |
0.3 |
0.00 |
5.00 |
10860 |
858752.75 |
504444.50 |
|
6 |
49356 |
122.27 |
1.0 |
0.00 |
6.025 |
215.3 |
39803.23 |
10793.78 |
|
7 |
52204 |
128.25 |
-1.5 |
0.00 |
33.68 |
753.5 |
43777.03 |
20081.40 |
The case 7 using the M_36_PLAS_TAB would represent the case closest to the on-field scenario.
Conclusion
The comparison of the 7 test cases yielded a large degree of variation in the results, which emphasises the importance of choosing the right element formulation, material definition and failure mode for a given problem.