RADIOSS Material Laws
RADIOSS MATERIAL LAW
OBJECTIVE: Aim of this assignment is to understand the behavior of materials under different material cards and under different property values of the same material card.
PROBLEM STATEMENT:
- Run the model as it is. Name it as Law2_epsmax_failure.
- Change Ixfem=1, Ifail_sh=1, and Dadv=1 in failure card. Name it as Law2_epsmax_crack.
- Delete failure card. Name it as Law2_epsmax_nofail.
- Delete the value of epsmax. Name it Law2.
- Convert the model into Law1 elastic with same E, RHO, and nu values.
- Change the shell properties to recommended properties in Law27_0000 file.
- Plot the curve, and assign it. Run the simulation.
PROCEDURE:
CASE-1: Running the Failure_Johnson_0000.rad file without any changes.
PROCEDURE:
Step 1- Import the 0000.rad file into the hypermesh window. Go to< Import< Solver deck and search the required file and hit import.
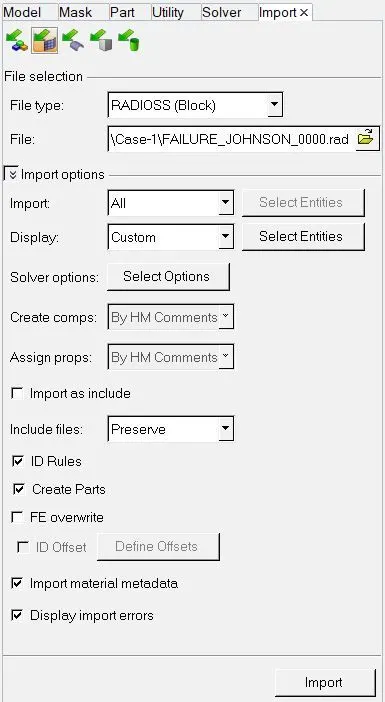
Step 2- Running simulation. Go to< Analysis< Radioss and change the name as required. Also, input option value as –nt 4 which means that it will use 4 cores of the CPU and hit Radioss.

Step 3- Checking the output file. Go to the main folder and open .out file where we have to check % energy error and mass error. Energy error ranges from -0.3%-1.3% with the final value of 0.8% which is within the acceptable limit and there is no mass error.
Step 4- Switch to the hyperview window and load the .h3d file and hit apply. Now we can run animation here. Go to contour< von misses and plot it. Run the animation to observe the simulation.

Step 5- Switch to hypergraph 2d window and load the T01 file. Now we can plot graphs here. Plot internal energy, kinetic energy, total energy and Rigid wall forces graphs to understand what is happening during the impact.

DEFAULT VALUES:
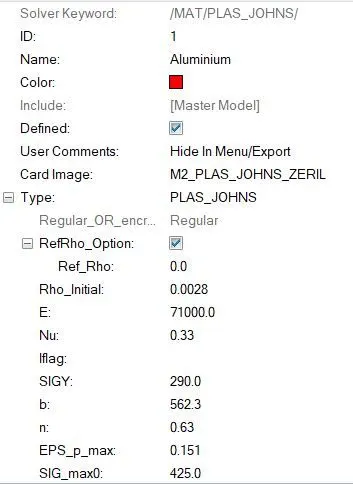
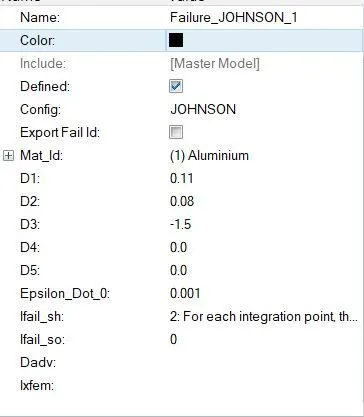
RESULTS:
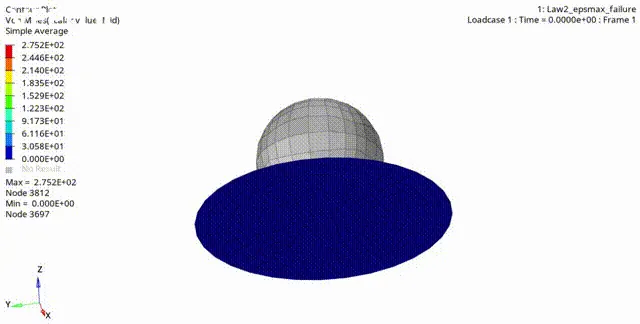
WATCH SIMULATION AND GRAPHS VIDEO HERE: https://www.veed.io/view/7f4ddd75-a7cc-46a2-95a0-141797595538
REMARKS:
We can draw the following conclusion after observing the above graphs and simulation:
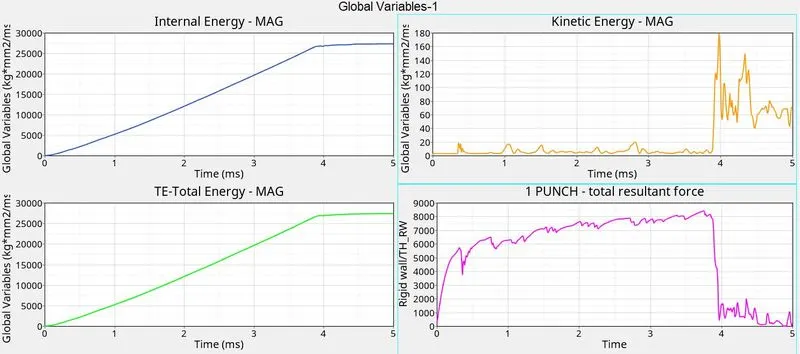
- The elements are getting deleted because of the presence of epsmax value of 0.151 which means the elements will be deleted when one integration point reaches the value of 15.1% of plastic strain. In addition, we have deployed a failure card in this model with default values which also assists in deletion of the values. At default, Ixfem is 0 and Dadv is 1 (but inactive as Ixfem is not 1) which leads to element deletion when ruptured.
- The kinetic energy spikes at aprox 4 ms because at that time a lot of elements are set into motion by the applied impact.
- The internal energy of the elements starts from 0 because there is no external load at 0-time step, and gradually increases because the elements are absorbing the energy under the applied load. However, after 4ms as we can see in the animation, many elements got deleted which means that there are fewer elements to absorb the energy, and thus the curve does not increase further.
- The total energy of the elements, just like internal energy, starts from 0, increases gradually, and then becomes constant at around 4ms because of the same reasons discussed above. In fact, the total energy is the sum of internal, kinetic, hourglass, contact, etc. energies.
- The resultant force graphs increase sporadically up to 4ms and then we can see a steep fall in the graph only to sporadically decrease later. This can again be attributed to the loss of elements from the model. Initially, the elements resist the applied load from the sphere which gives rise to resisting force in the elements thus we can say that the force is increasing. But, when the elements get deleted, there are fewer elements and thus little to no resisting force is generated. With this logic, we can also conclude that the sporadic dips in the initial parts of the graphs signify that elements were deleted there.
CASE-2: Running the Failure_Johnson_0000.rad file after changing Ixfem=1, Ifail_sh=1, and Dadv=1 in the failure card.
PROCEDURE:
Step 1- Import the 0000.rad file into the hypermesh window. Go to< Import< Solver deck and search the required file and hit import.
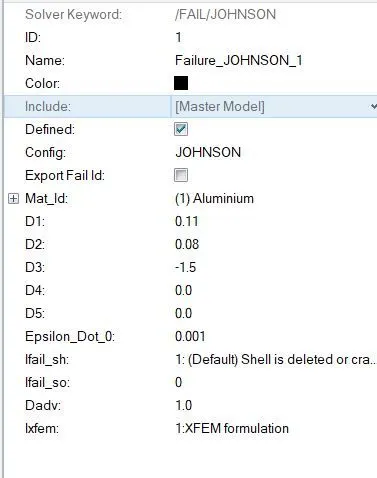
Step 2- Go to the failure card and change the values Ixfem=1, Ifail_sh=1, and Dadv=1. It looks something like this now.
Step 3- Running simulation. Go to< Analysis< Radioss and change the name as required. Also, input option value as –nt 4 which means that it will use 4 cores of the CPU and hit Radioss.
Step 4- Checking the output file. Go to the main folder and open .out file where we have to check % energy error and mass error. Energy error ranges from -0.3% - 4.1% which is within the acceptable limit and there is no mass error.
Step 5- Switch to the hyperview window and load the .h3d file and hit apply. Now we can run animation here. Go to contour< von misses and plot it. Run the animation to observe the simulation.
Step 6- Switch to hypergraph 2d window and load the T01 file. Now we can plot graphs here. Plot internal energy, kinetic energy, total energy, and Rigid wall forces graphs to understand what is happening during the impact.
CASE-2 VALUES:
RESULTS:
WATCH SIMULATION AND GRAPHS VIDEO HERE: https://www.veed.io/view/7db360d4-571d-4a73-bdb4-f4a47ba36543
REMARKS:
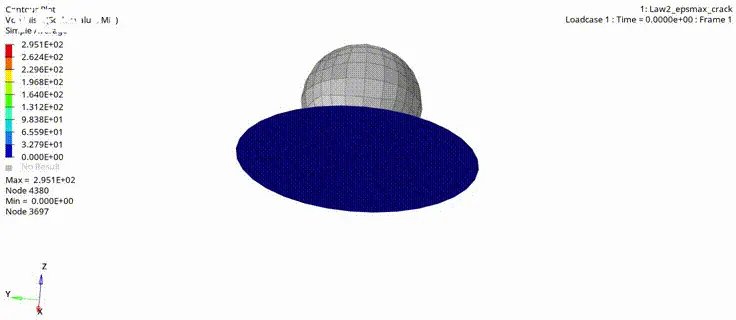
- Like the previous case, the elements were deleted in this scenario too. But, there is a major difference because here the elements were deleted after a proper crack formation rather than abruptly. The failure criteria of Ixfem=1 leads to element crack rather than element deletion. The criteria Ddv=1 advance the crack in case of neighboring elements failure, and the failure criteria of Ifail_sh=1deletes the shell elements. This simulation is more realistic than case 1.
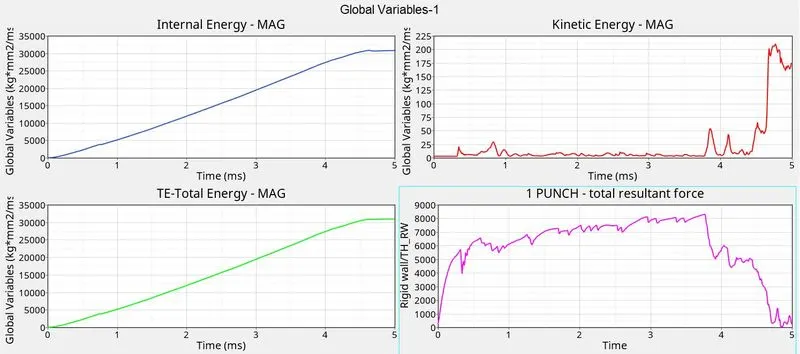
- The internal energy curve looks similar to the one we have observed in the previous case but with different values. Here, the graph becomes constant after 4.5ms implying that at this time there is the deletion of the elements.
- The above statement can be corroborated from the force graph where we can observe a gradual increase in internal force with the graph gradually decreasing from around 3.8ms and a steep decrease from 4.5ms. Thus we can say that many elements were deleted at around 4.5ms.
- The kinetic energy to looks similar with different values obviously. Unlike in case-1, we observe only a small increase in KE graph at 3.8ms which means that some elements were deleted at this time step. However, we observe a steep increase in the graph at 4.5ms signifying that many elements were deleted then.
CASE-3: Running the Failure_Johnson_0000.rad file after deleting the failure card.
PROCEDURE:
Step 1- Import the 0000.rad file into the hypermesh window. Go to< Import< Solver deck and search the required file and hit import.
Step 2- Go to the failure card, right-click on it and delete the card.
Step 3- Running simulation. Go to< Analysis< Radioss and change the name as required. Also, input option value as –nt 4 which means that it will use 4 cores of the CPU and hit Radioss.
Step 4- Checking the output file. Go to the main folder and open .out file where we have to check % energy error and mass error. Energy error ranges from -0.3% - 0.8% which is within the acceptable limit and there is no mass error.
Step 5- Switch to the hyperview window and load the .h3d file and hit apply. Now we can run animation here. Go to contour< von misses and plot it. Run the animation to observe the simulation.
Step 6- Switch to hypergraph 2d window and load the T01 file. Now we can plot graphs here. Plot internal energy, kinetic energy, total energy, and Rigid wall forces graphs to understand what is happening during the impact.
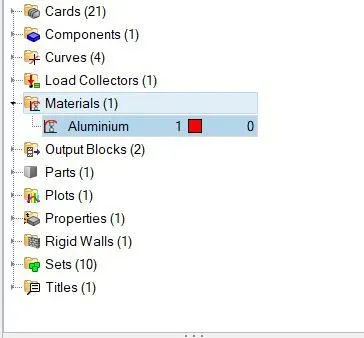
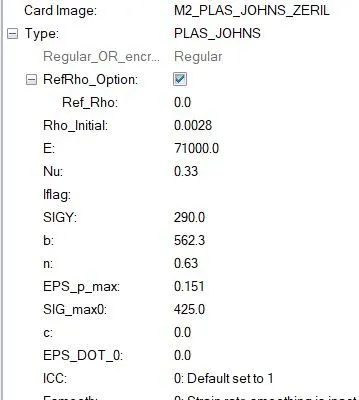
CASE-3 REQUIREMENT:
RESULT:
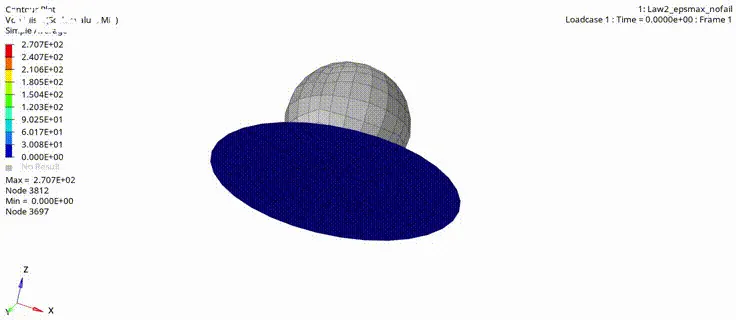
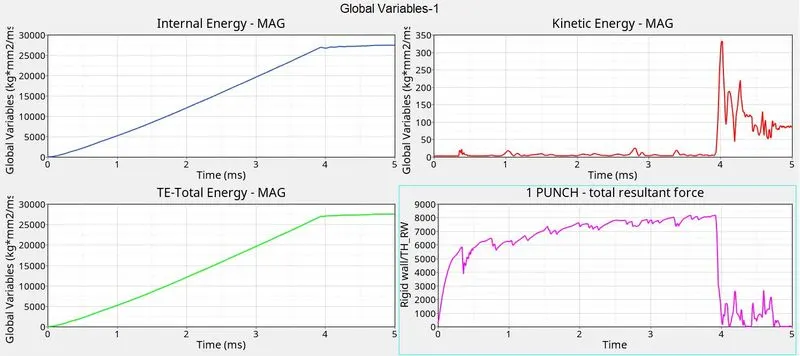
WATCH SIMULATION AND GRAPHS VIDEO HERE: https://www.veed.io/view/86d81af9-aff2-41a3-a212-ded08b35746a
REMARKS:
- In this simulation too the elements got deleted. However, the main reason for this is the value of Eps_Max= 0.151 which means that when one integration point of the element would reach the value equal to 15.1% of max plastic strain, the element would get deleted.
- The internal energy graph of this simulation is approximately equal to case-1 where we have the same values as the default failure card value. The internal energy increases gradually till 4ms and then becomes constant.
- The kinetic energy curve too resembles the case-1 scenario with the graph shooting abruptly at around 4ms. There is very little difference in the time that the graphs show this behavior. In case-1, the shoot was a little earlier.
- The internal force curve too is very similar to that we have observed in case-1. The force increases till approx 4ms and then falls down because, at this time step, many elements got deleted.
CASE-4: Running the Failure_Johnson_0000.rad file after deleting the failure card and deleting the value of epsmax.
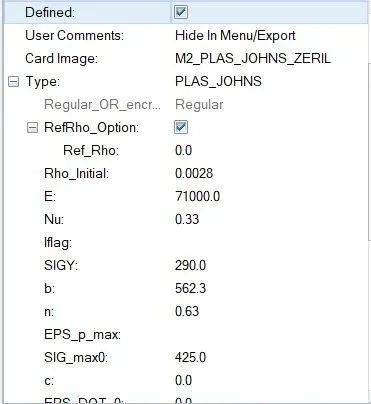
PROCEDURE: Delete that value of Eps_max from the material card and follow the similar procedure as mentioned above.
CASE-4 REQUIREMENT:
RESULT:
WATCH SIMULATION AND GRAPHS VIDEO HERE: https://www.veed.io/view/618eac49-687b-4d5c-b8ea-9aeff1f75224
REMARKS:
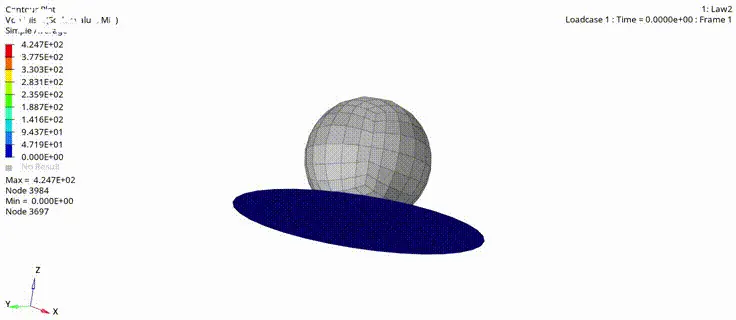
- Here, we can observe that no elements get deleted. This is because we have not set the parameter to delete the element if it reaches some percentage of the max plastic strain value. The max plastic strain value that we have for this simulation is 1.232 and the default value of Eps_max is 10^30 thus the elements were not deleted.
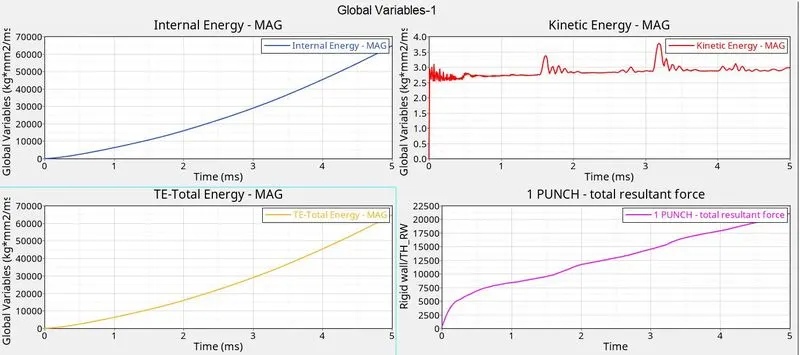
- As the elements were intact till the end of the simulation, the internal energy goes on increasing gradually. The elements thus absorb the impact load applied by the sphere till the end of the simulation.
- The kinetic energy shoots initially and then does not change much. However, if we compare it with the internal energy, the KE is negligible.
- The force curve is constantly and gradually increasing which indicates that the elements of the plate are resisting the impact from the sphere. There are no steeps or shoots in this curve which suggests that there is no element deletion which can be clearly seen in the animation.
CASE-5: Running the Failure_Johnson_0000.rad file after deleting the failure card and deleting the value of epsmax. Convert the model into Law1 elastic with the same E, RHO, and nu values
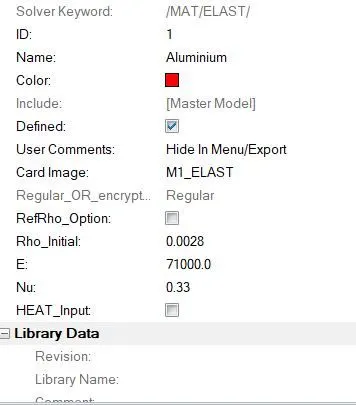
PROCEDURE: Change the card image from M2_PLAS_JOHN_ZERIL to M1_ELAST, input E, rho, and nu values, and follow the similar procedure as mentioned above.
CASE-5 REQUIREMENT:
RESULT:
WATCH SIMULATION AND GRAPHS VIDEO HERE: https://www.veed.io/view/31b4ca45-46e7-47ae-b39f-661b8435ebe9
REMARKS:
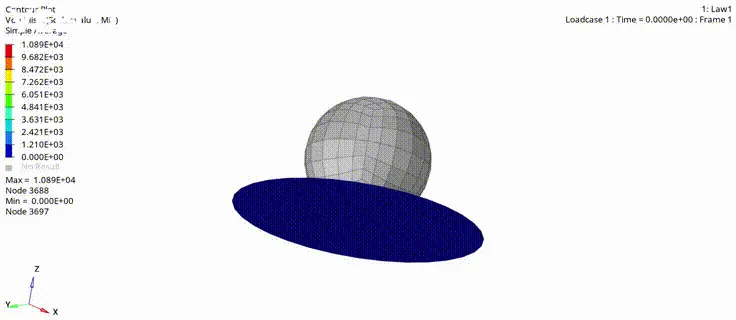
- As the above card is used for elastic materials, it exhibits an elastic nature. Thus, the solver will run the simulation in the elastic region. Hence, in the simulation, we can see that there is no element deletion or crack formation.
- This material card is used for a purely elastic material, and thus it has the capability to withstand enormous force. This is the reason we can observe very high stress of about 1089 MPa in the animation.
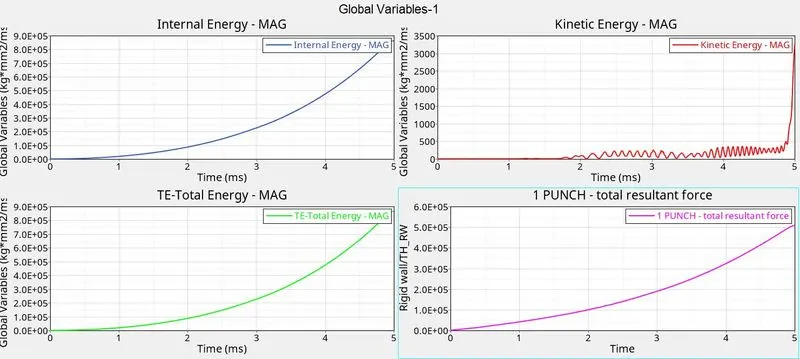
- The kinetic energy is almost zero for some time, then it varies for some time and finally shoots to the maximum value. This happens when the elements stretch a lot to resist the load exerted by the sphere.
- The internal energy, total energy, and resultant force curves vary exponentially because the material is purely elastic material with linear characteristics in the elastic region. If the force from the sphere were removed, the plate would have returned to its initial position.
CASE-6: Change the shell properties to recommended properties in Law27_0000 file.
PROCEDURE:
Step 1- Import the Law27_0000.rad file into the hypermesh window. Go to< Import< Solver deck and search the required file and hit import.
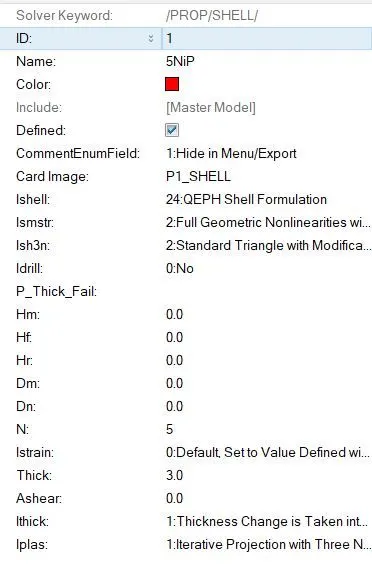
Step 2- After step-1 mentioned above, go to the property card and enter the recommended property card values. Ishell=24 Ismstr=2 Ish3N=2 N=5 Ithick=1 and Iplas=1.
Step 3- Running simulation. Go to< Analysis< Radioss and change the name as required. Also, input option value as –nt 4 which means that it will use 4 cores of the CPU and hit Radioss.
Step 4- Checking the output file. Go to the main folder and open .out file where we have to check % energy error and mass error. Energy error ranges from -0.3% - 0.8% which is within the acceptable limit and there is no mass error.
Step 5- Switch to the hyperview window and load the .h3d file and hit apply. Now we can run animation here. Go to contour< von misses and plot it. Run the animation to observe the simulation.
Step 6- Switch to hypergraph 2d window and load the T01 file. Now we can plot graphs here. Plot internal energy, kinetic energy, total energy and Rigid wall forces graphs to understand what is happening during the impact.
CASE-6 REQUIREMENT:
RESULT:
WATCH SIMULATION AND GRAPHS VIDEO HERE: https://www.veed.io/view/40f9a121-d10c-43ed-9537-2dcdf7a9a797
REMARKS:
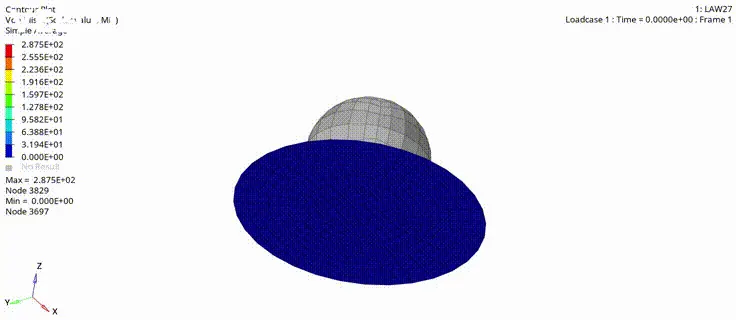
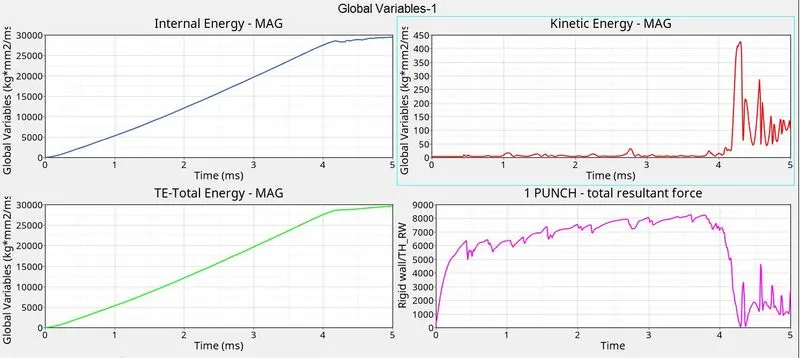
- Plast/Brit material card combines the Johnson cook material model with an orthographic brittle failure model.
- We can observe in the animation that the elements get deleted because the value of Eps_F is defined in both directions. This is the tensile failure strain value at which the elements would get deleted.
- The KE graphs shoot at around the 4ms mark because that is the time when the elements are deleted from the simulation. At the same time, the internal energy becomes constant which until now was increasing gradually because there are very few elements to absorb the kinetic energy of the sphere.
- The KE is very low as compared to internal energy thus the total energy curve is similar to that of the internal energy curve.
- The Rigid wall forces increase initially because the elements develop resisting force in response to the applied force. But, as the elements are deleted after 4ms, there are less elements in contact to develop the resisting force, so the force curve falls down.
CASE-7: Change the card image from Law_27 to Law_36 and input the values, plot, and assign the curve before running the simulation.
Step 1- Import the 0000.rad file into the hypermesh window. Go to< Import< Solver deck and search the required file and hit import.
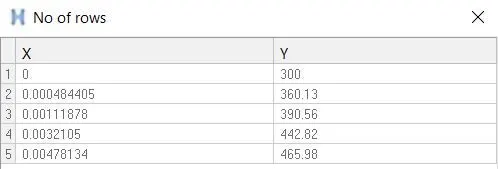
Step 2- Plot the curve. Right click< create curve< insert the values< rename.
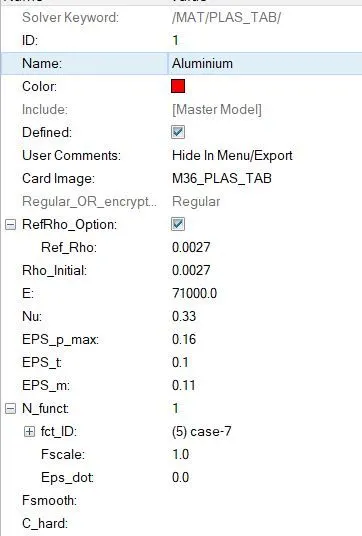
Step 3- Change card image from Law_27 to Law_36 and insert the values of E, rho, and nu.
Step 4- Running simulation. Go to< Analysis< Radioss and change the name as required. Also, input option value as –nt 4 which means that it will use 4 cores of the CPU and hit Radioss.
Step 5- Checking the output file. Go to the main folder and open .out file where we have to check % energy error and mass error. Energy error ranges from -0.3%-1.8% with the final value of 0.8% which is within the acceptable limit and there is no mass error.
Step 6- Switch to the hyperview window and load the .h3d file and hit apply. Now we can run animation here. Go to contour< von misses and plot it. Run the animation to observe the simulation.
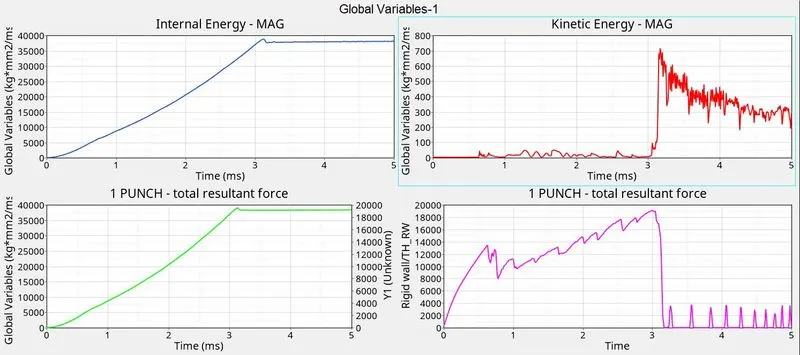
Step 7- Switch to hypergraph 2d window and load the T01 file. Now we can plot graphs here. Plot internal energy, kinetic energy, total energy and Rigid wall forces graphs to understand what is happening during the impact.
CASE-7 REQUIREMENT:
RESULT:
WATCH SIMULATION AND GRAPHS VIDEO HERE: https://www.veed.io/view/93218130-533a-4c0a-aa7b-fca50b5bdced
REMARKS:
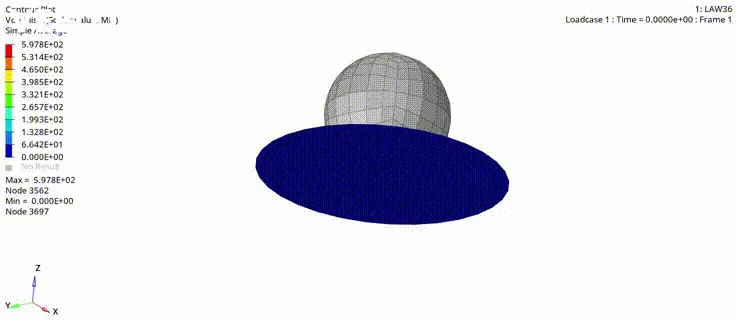
- Here the elements are deleted earlier (at around 3ms) as seen in the animation because we have assigned the value of 0.16 to Eps_max which means the elements would be deleted when one integration point reaches the value of 16% of maximum plastic strain.
- It is also interesting to note that this model is more brittle than the one we have seen in case-6 as it breaks almost 1ms earlier than the latter.
- Again, we can note the changes in the graphs of KE, TE, and IE at 3ms. The KE energy spikes at that step because many elements are set into motion. Further, IE becomes constant at that time step because there are no elements in contact with the sphere that would generate the strain energy.
- The force curve dips at 3ms because there are no elements to resist the incoming force from the sphere.
COMPARISON:
| CASE | ENERGY ERROR | MASS ERROR | SIMULATION TIME (s) | NUMBER OF CYCLES | ELEMENT BEHAVIOUR | VON MISES STRESS (MPa) |
| CASE-1 | 0.8% | 0 | 289 | 49380 | Deleted after 4ms | 275.2 |
| CASE-2 | 4.1% | 0 | 420 | 49217 | Crack formation, propagation, and deletion after 4ms | 295.1 |
| CASE-3 | 0.8% | 0 | 287 | 49408 | Deleted after 4ms | 270.7 |
| CASE-4 | 3% | 0 | 300 | 48737 | Preserved | 424.7 |
| CASE-5 | 1.3% | 0 | 270 | 47969 | Preserved | 1089 |
| CASE-6 | 0.8% | 0 | 377 | 49508 | Deleted after 4ms | 287.5 |
| CASE-7 | -1.8% | 0 | 419.51 | 53143 | Deleted after 3ms | 597.8 |
CONCLUSION: Through this assignment, I have learned the following things:
- To create and edit the material card
- Difference between different values in the same material card
- Difference between different material cards
- Plot and read energy and force graphs