To study the practical effects of various material laws in Hypermesh
Objective: To study and plot the effects of various material laws and properties on given simulation and determine the case that would represent the on-field situation accurately.
Procedure:
Case 1:
1. Open the solver input deck in Hyperworks. Change the material properties to default, except N and thick. Run the simulation and open the results in Hyperview.
2. Open the Engine output file and note the Energy and mass erors:
The Energy error fluctuates from 0% to -3%, increases to 0.1% and then goes down to -10%.
Mass error is 0.
3. Note the deformation behaviour of the model:
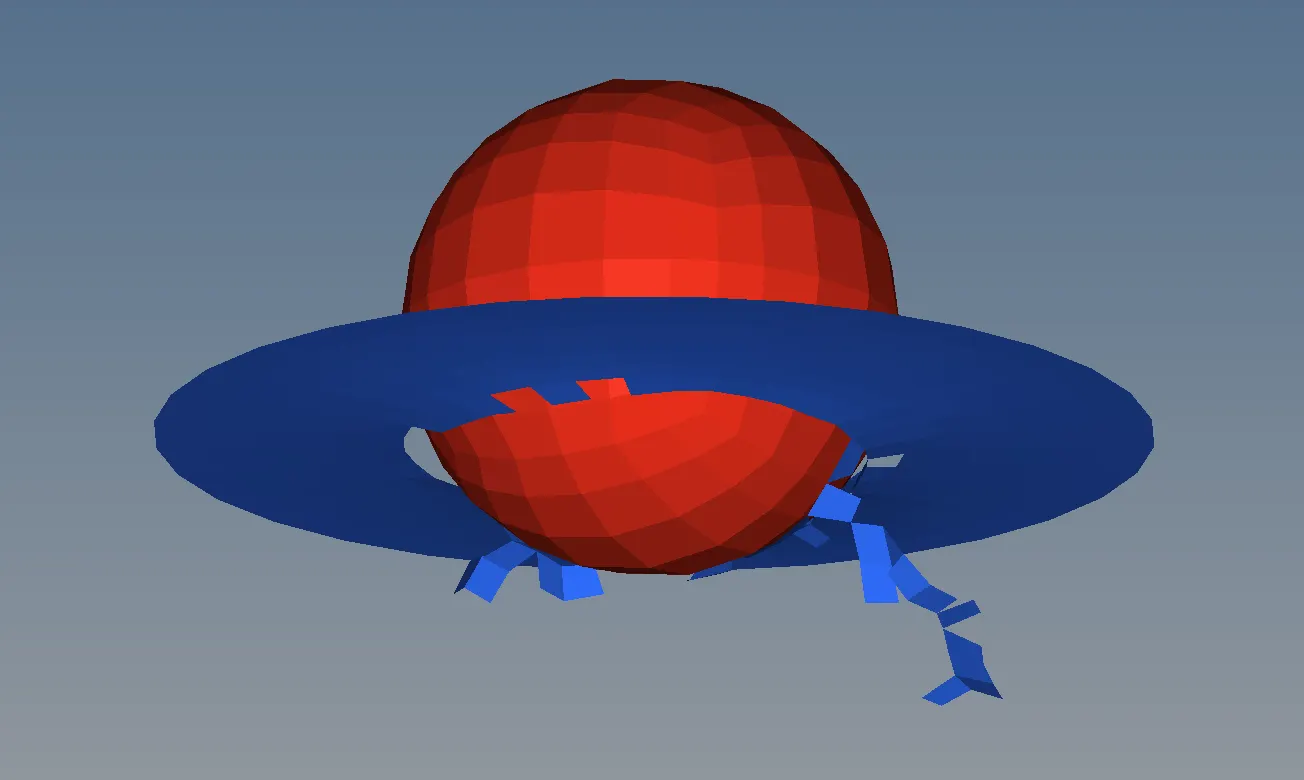
We can see that the deformation and element failure is unnatural. The failing elements are getting deleted. This clearly does not represent a real world scenario.
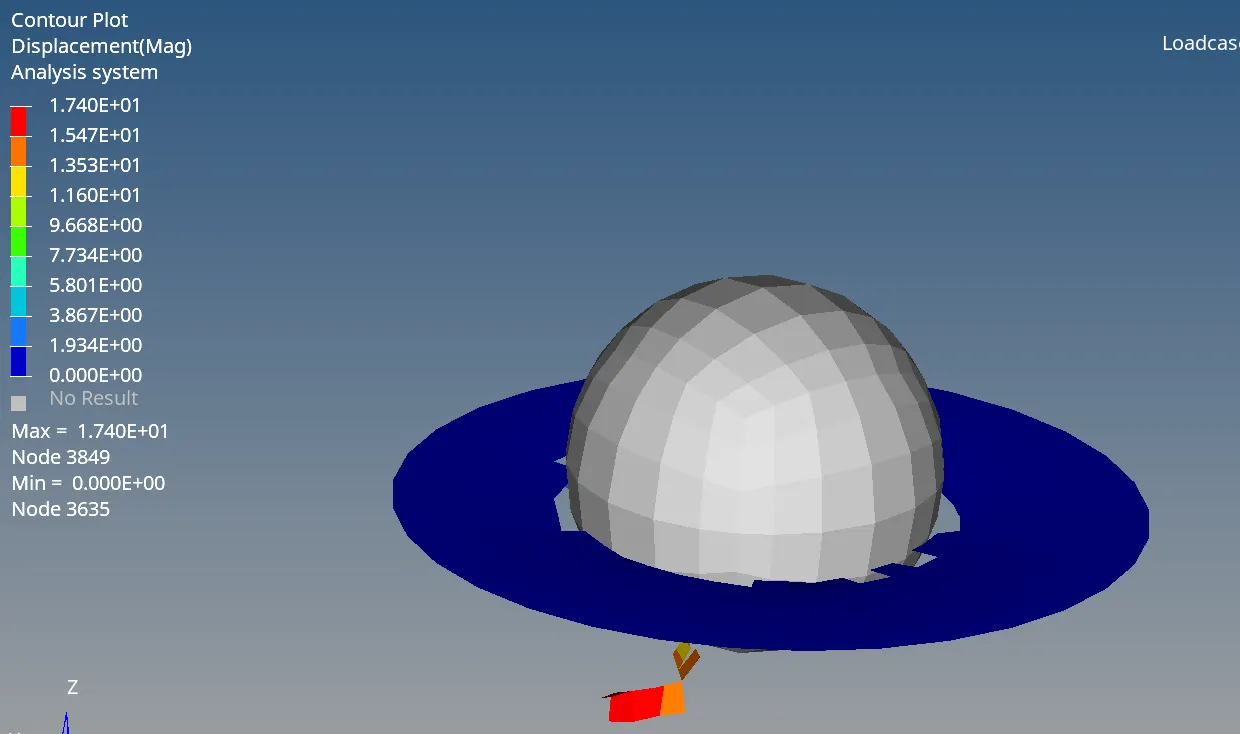
4. Displacement plot:
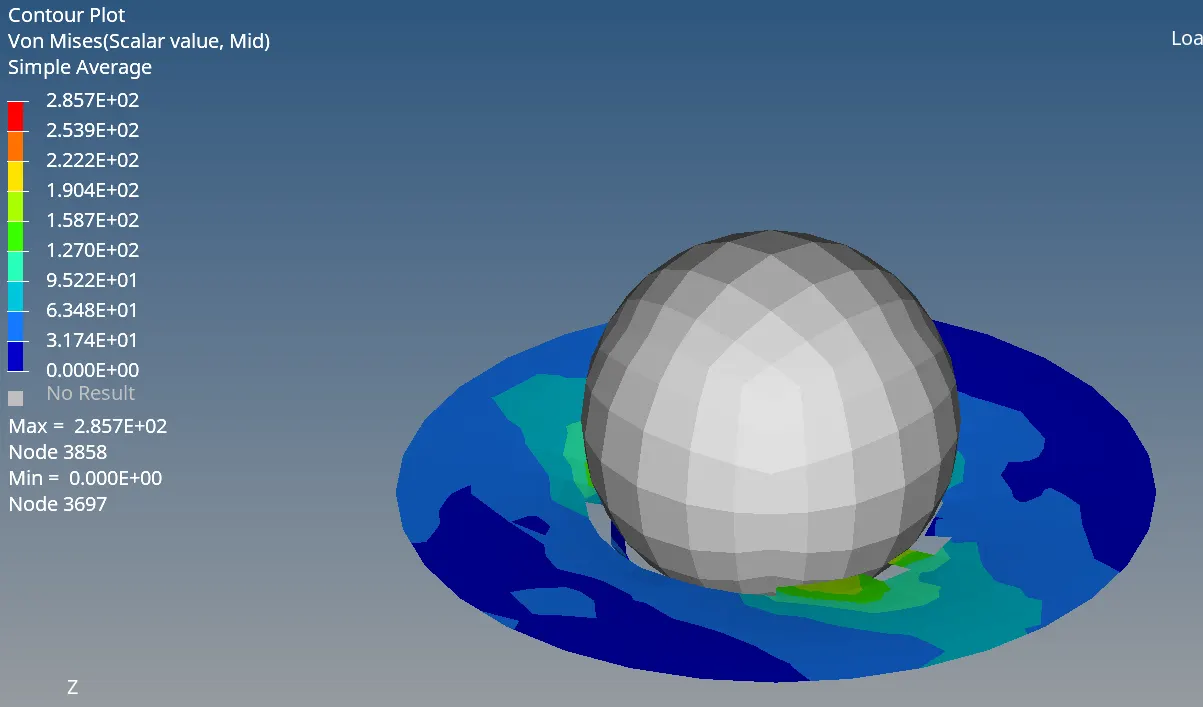
5. Von Mises Stress distribution:
6. Energy Plot:
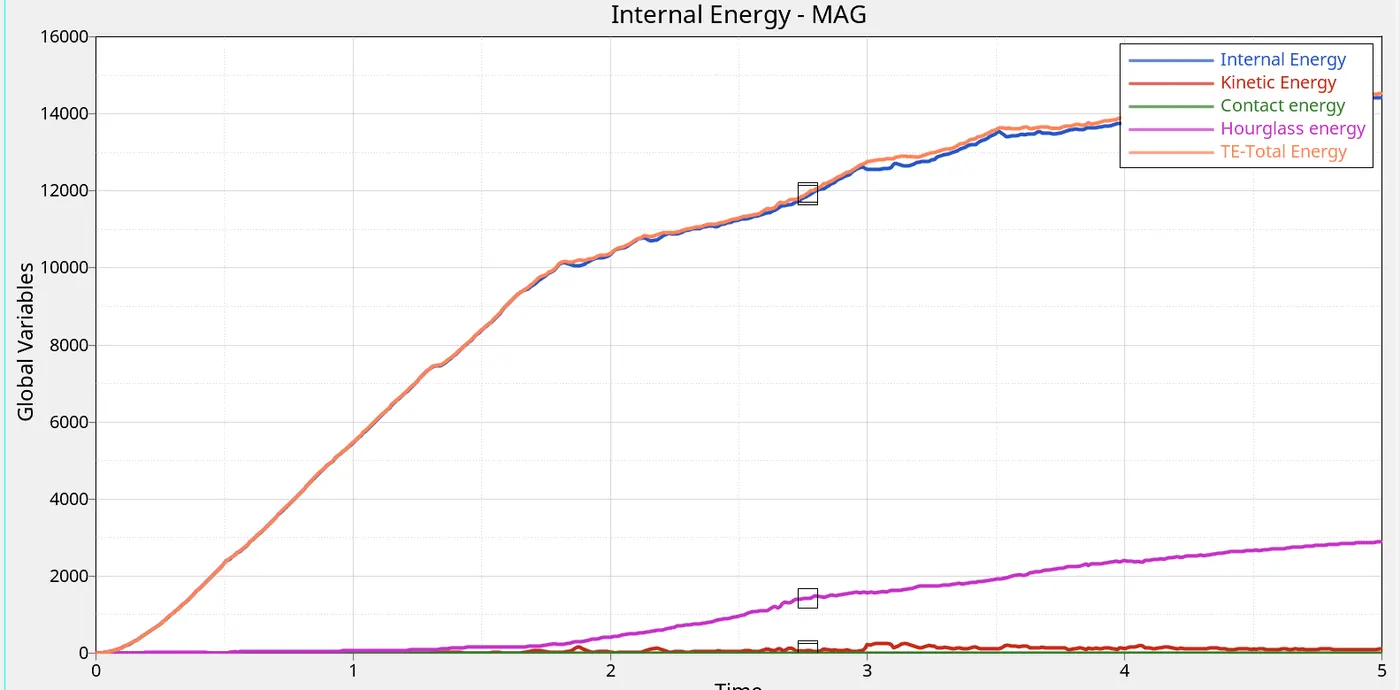
We notice that there is significant hourglass energy in the simulation.
B. Case 2:
1. Run the simulation according to the given criteria for case 2 and open the results in Hyperview.
2. The Energy error varies from 2.3% to -9.6%. Mass error is 0.
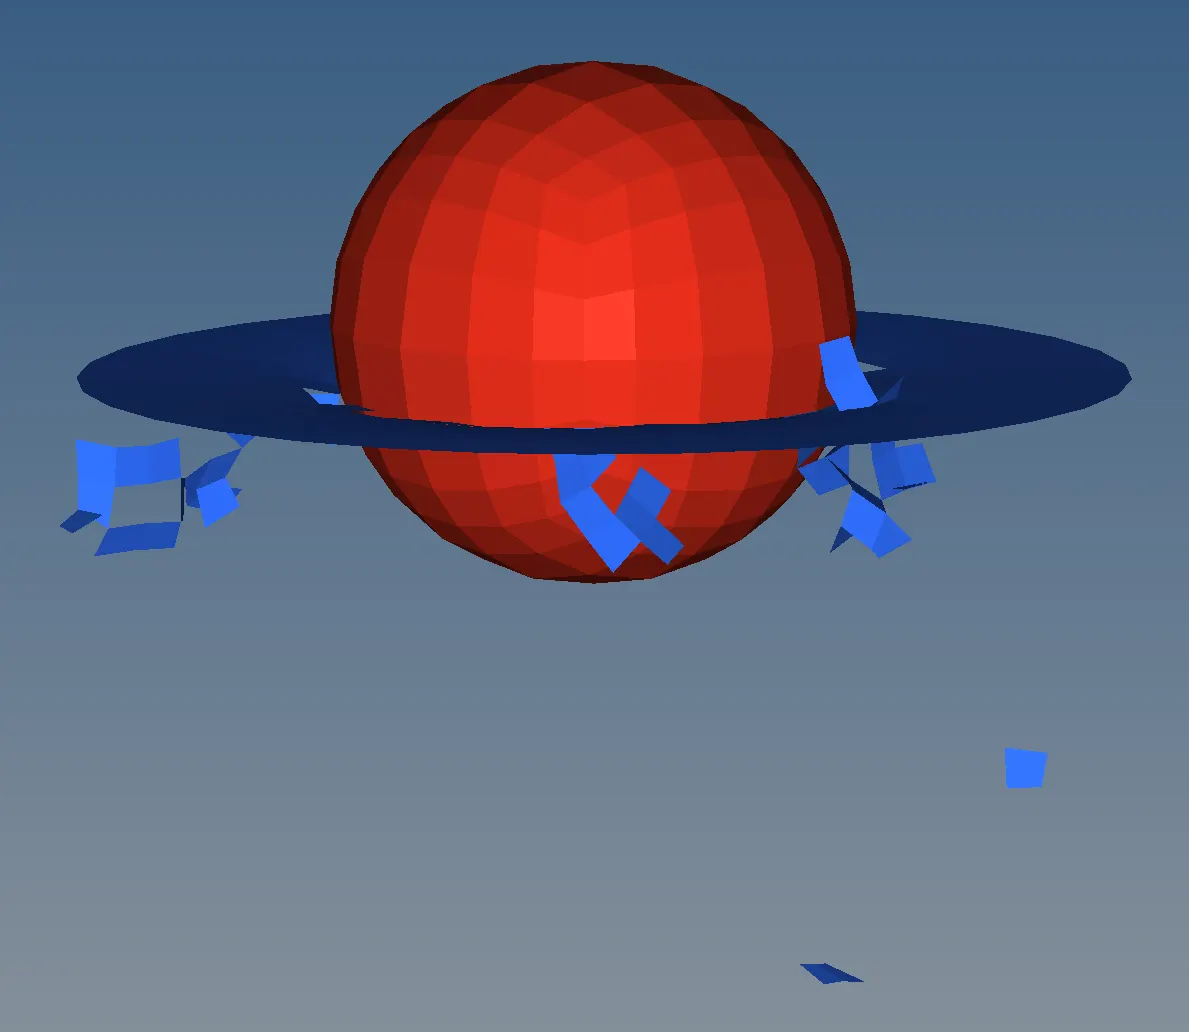
3. Deformation behaviour:
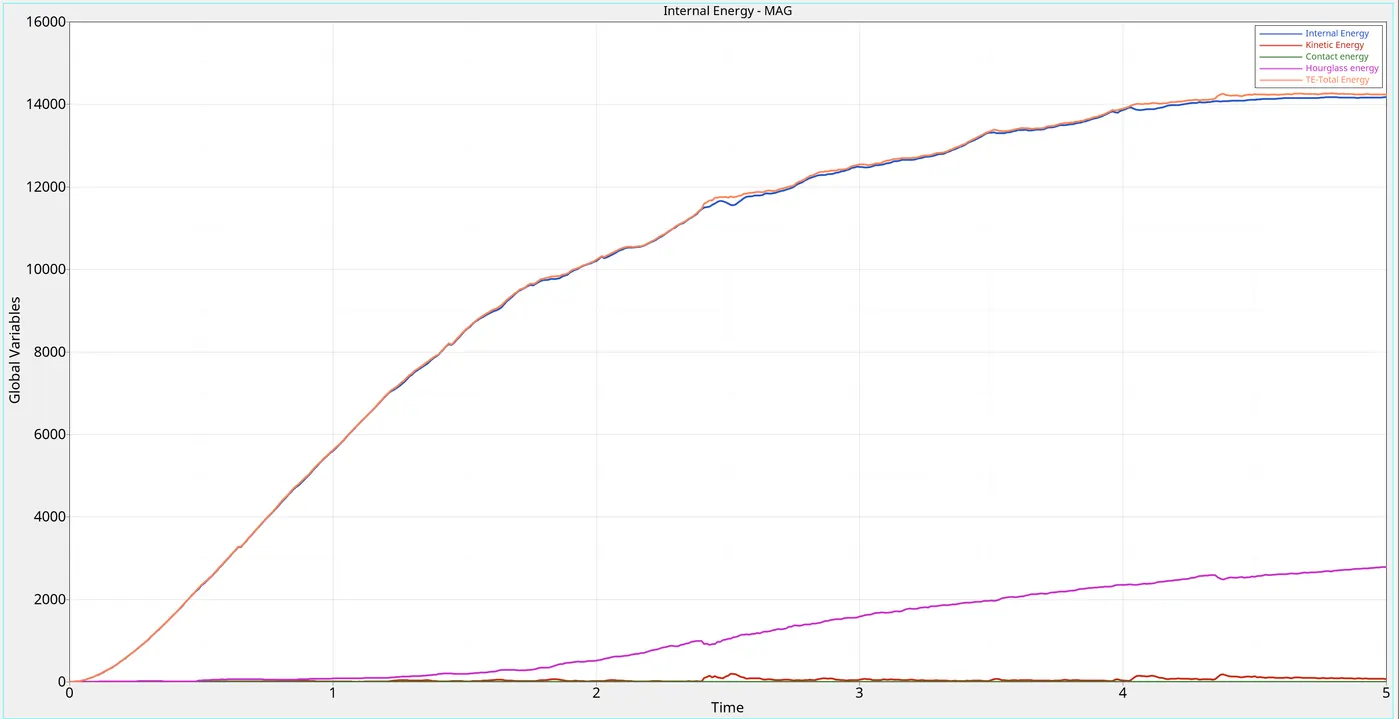
The model deforms unnaturally, which is due to the large amounts of Hourglassing happening, as evident from the graphs.
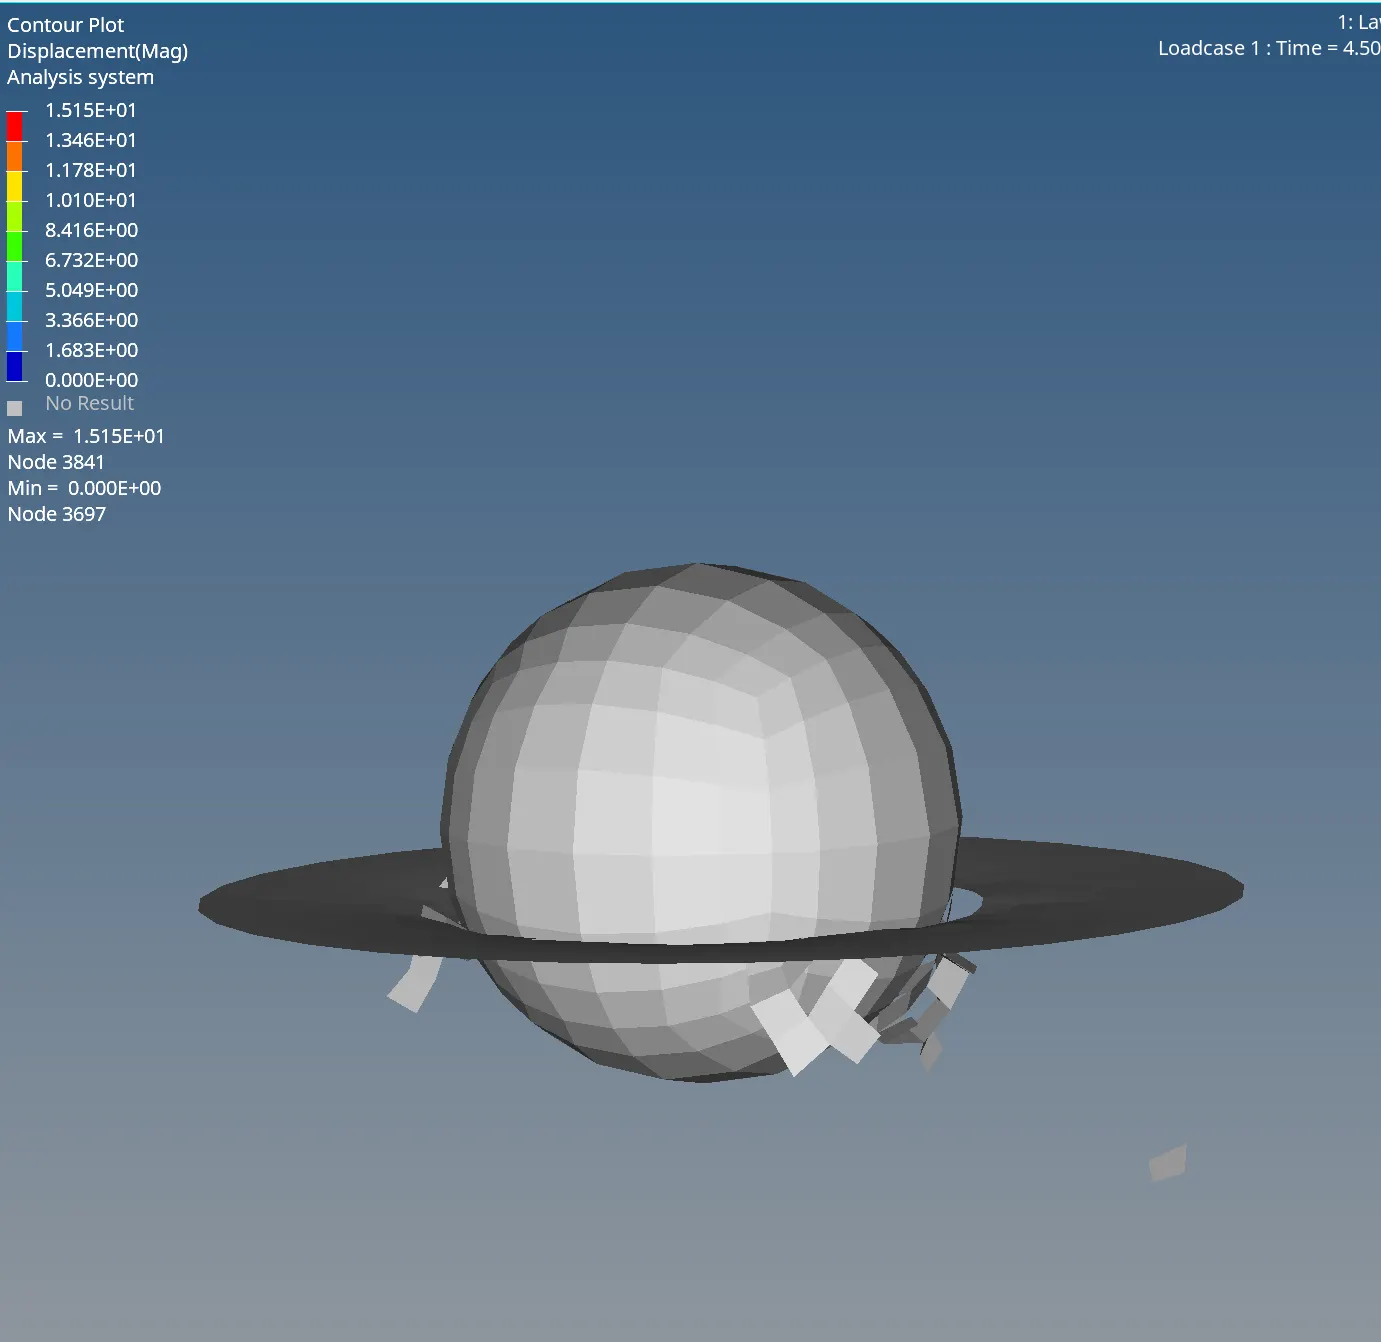
4. Displacement plot:
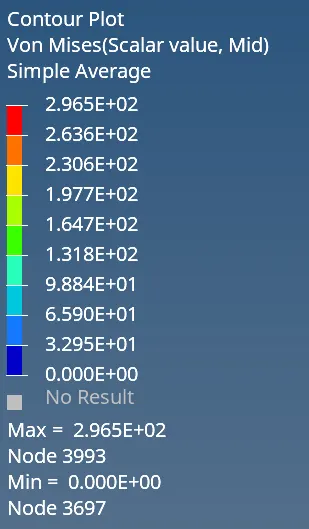
5. Von Mises stress distribution:
6. Energy Plots:
C. Case 3
1. Delete the failure card and run the simulation.
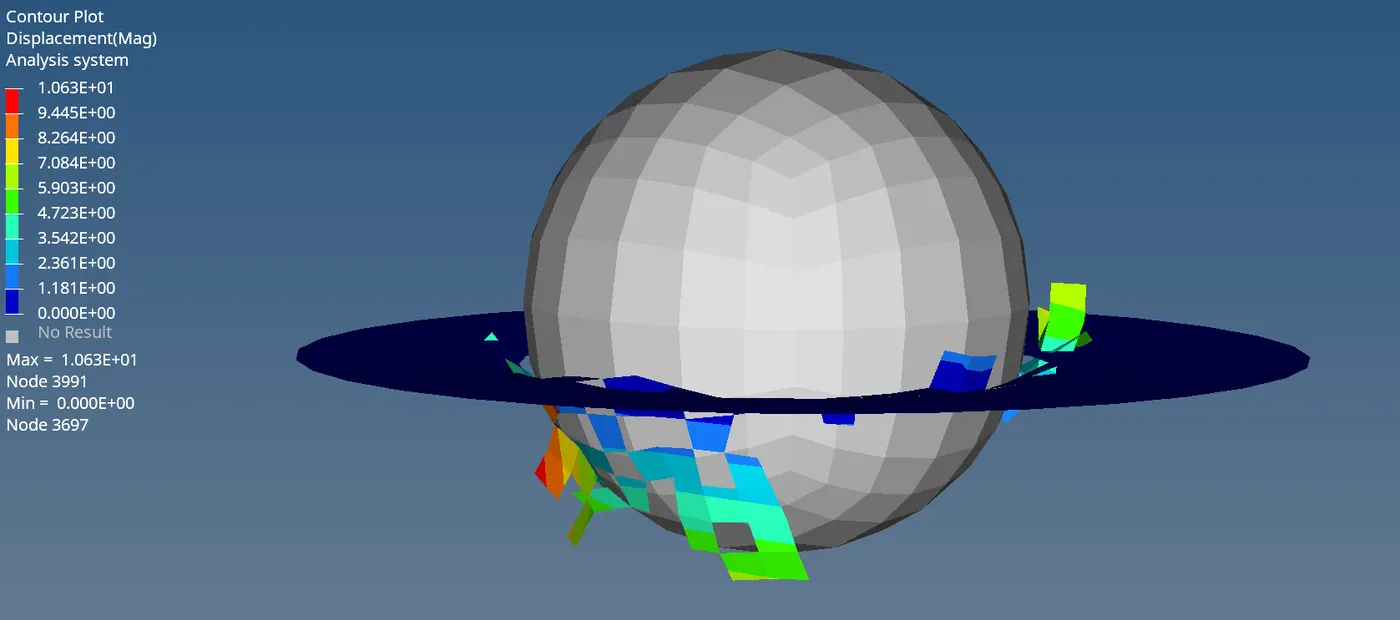
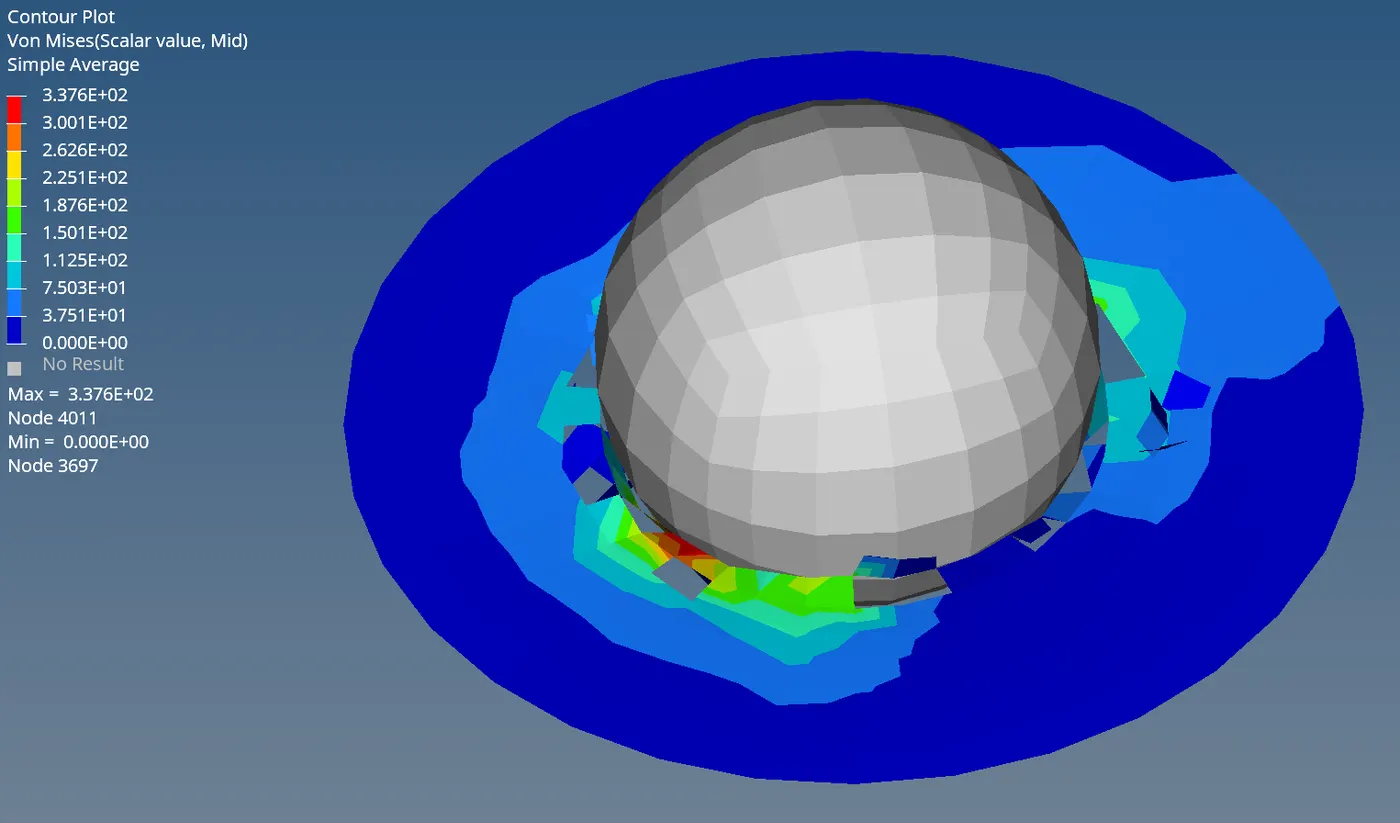
2. Energy Error fluctuates between 0.3% and -11.9%. Mass error is 0.
3. Deformation behaviour: The model deforms unnaturally, which is due to the large amounts of Hourglassing happening, as evident from the graphs.
4. Displacement plot:
5. Von Mises stress distribution:
6. Energy Plot:
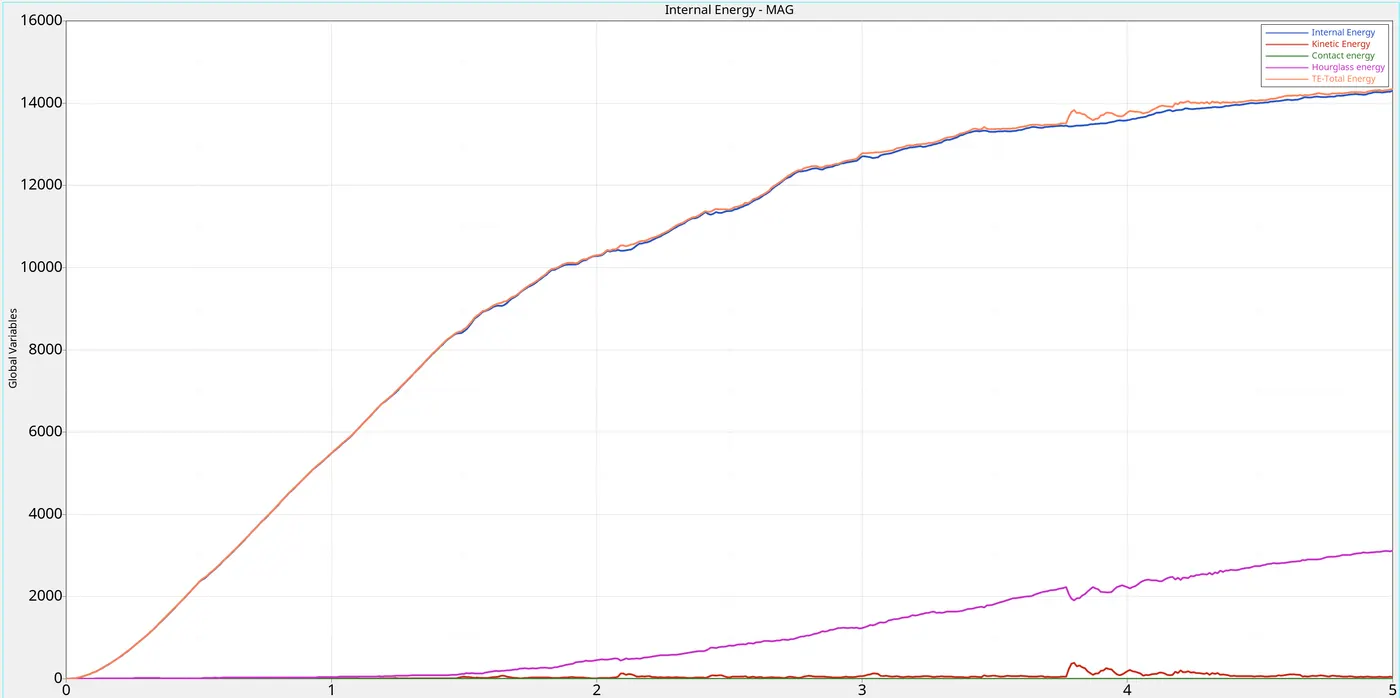
As with previous cases, theres significant hourglassing in this case too.
Case 4
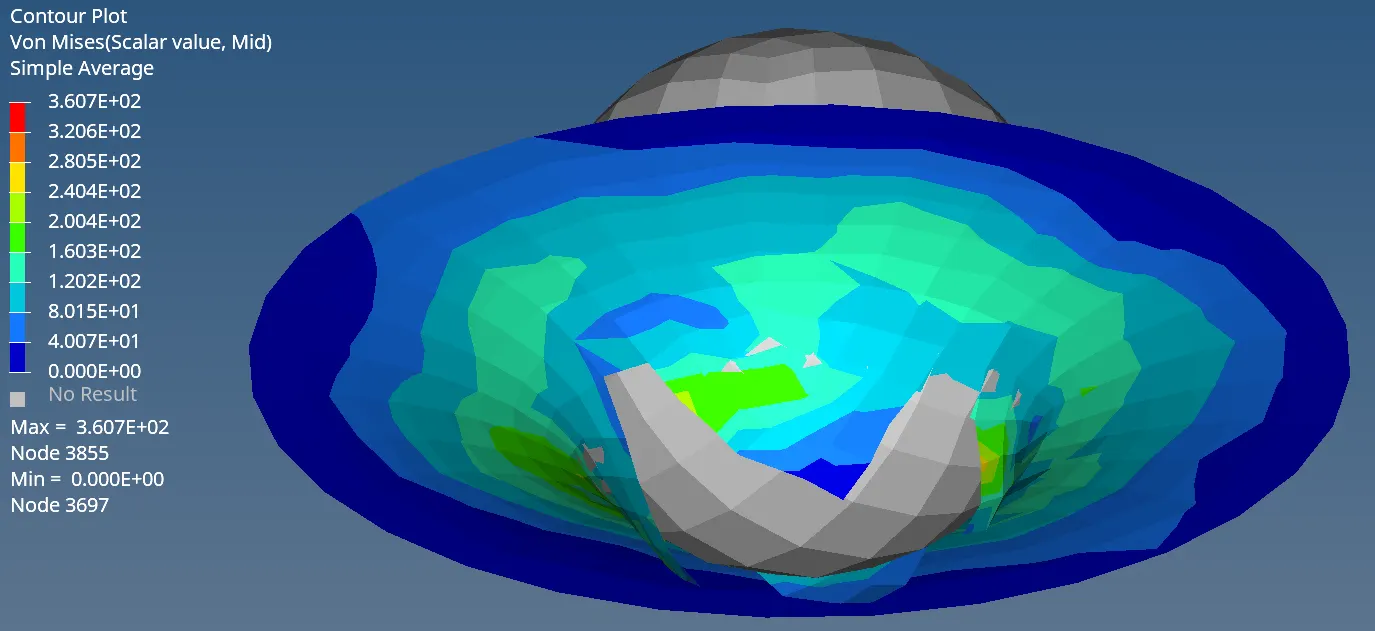
In this case we run the simulation without Eps_P_max value. That means no strain failure criteria for the elements
1. Change Eps_p_max value to 0 and run the simulation
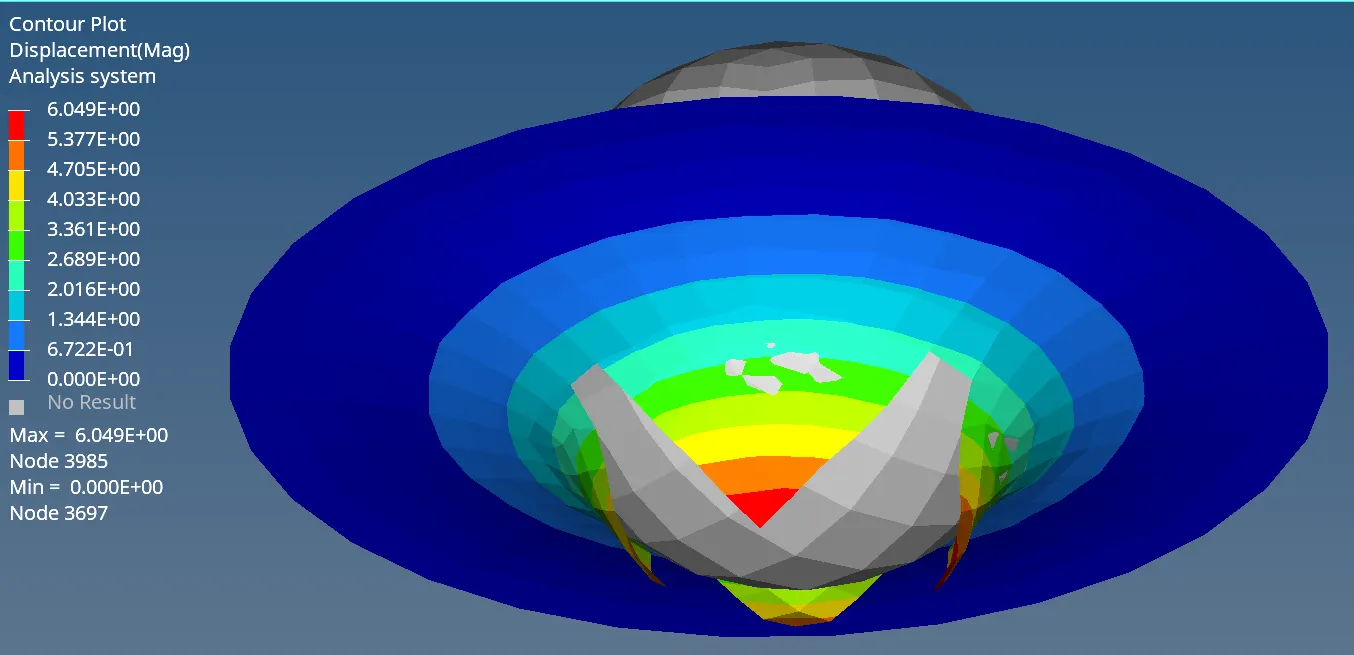
2. Energy error ranges from -2.6% to 1.1% and mass error is 0.
3. Deformation behaviour: The model splits equally in four directions from the center, as there is no strain based failure.
4. Displacement plot:
5. Von Mises stress distribution:
6. Energy plot:
Case 5
In this case we run the simulation using the Elastic material type (Law 1)
1. Apply Elastic material card to the component and run the simulation
2. Energy error fluctuates in the range of 2.1% to -9.6%. Mass error is 0.
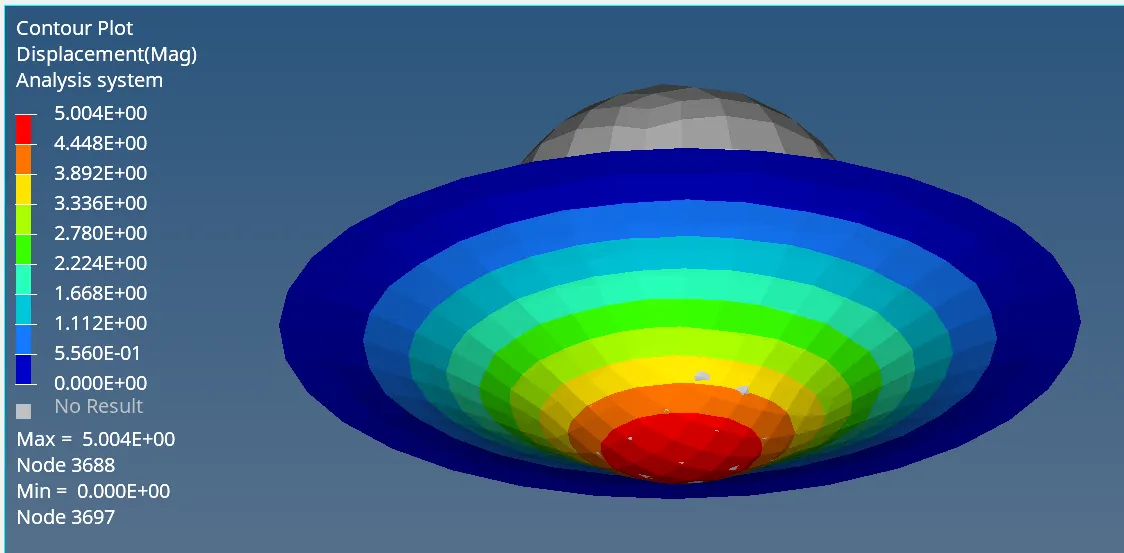
3. Deformation behavior: The plate deforms like a trampoline, with no failure occuring, since it is a purely Elastic material.
4. Displacement plot:
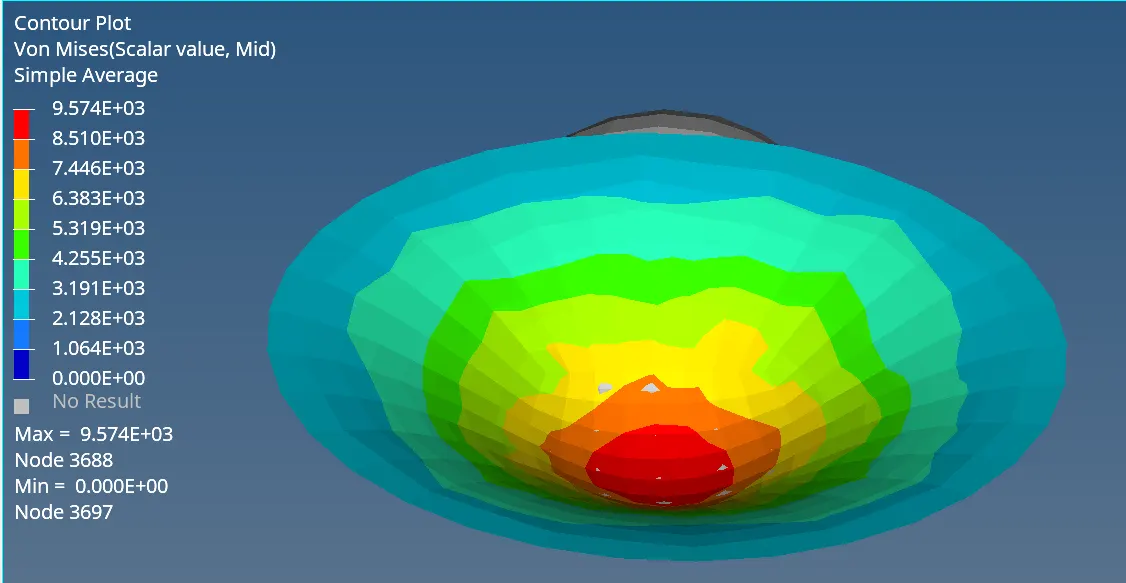
5. Von Mises stress distribution:
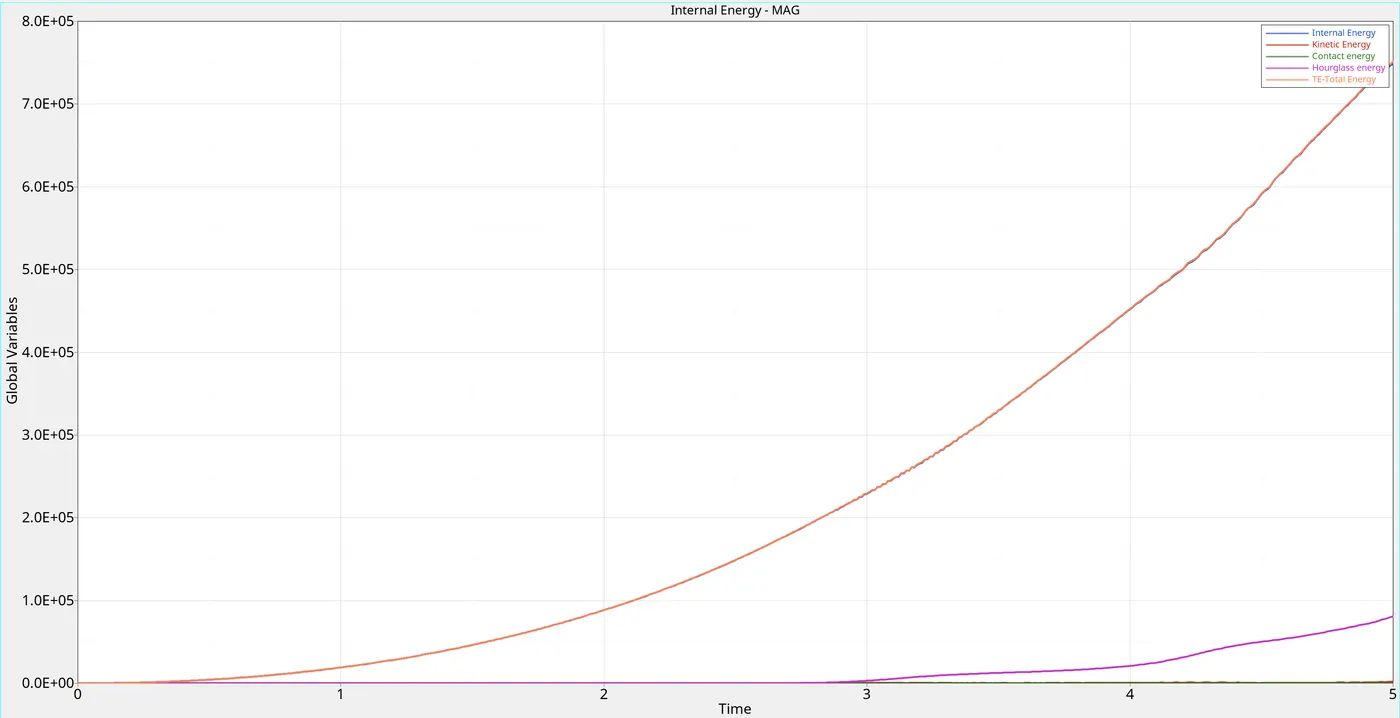
6. Energy plots:
Case 6
In this case we use the Plas-Brit material
1. Run the analysis after applying the Law 27 material card
2. Energy error varies from 0.6% to -9.1%. Mass error is 0
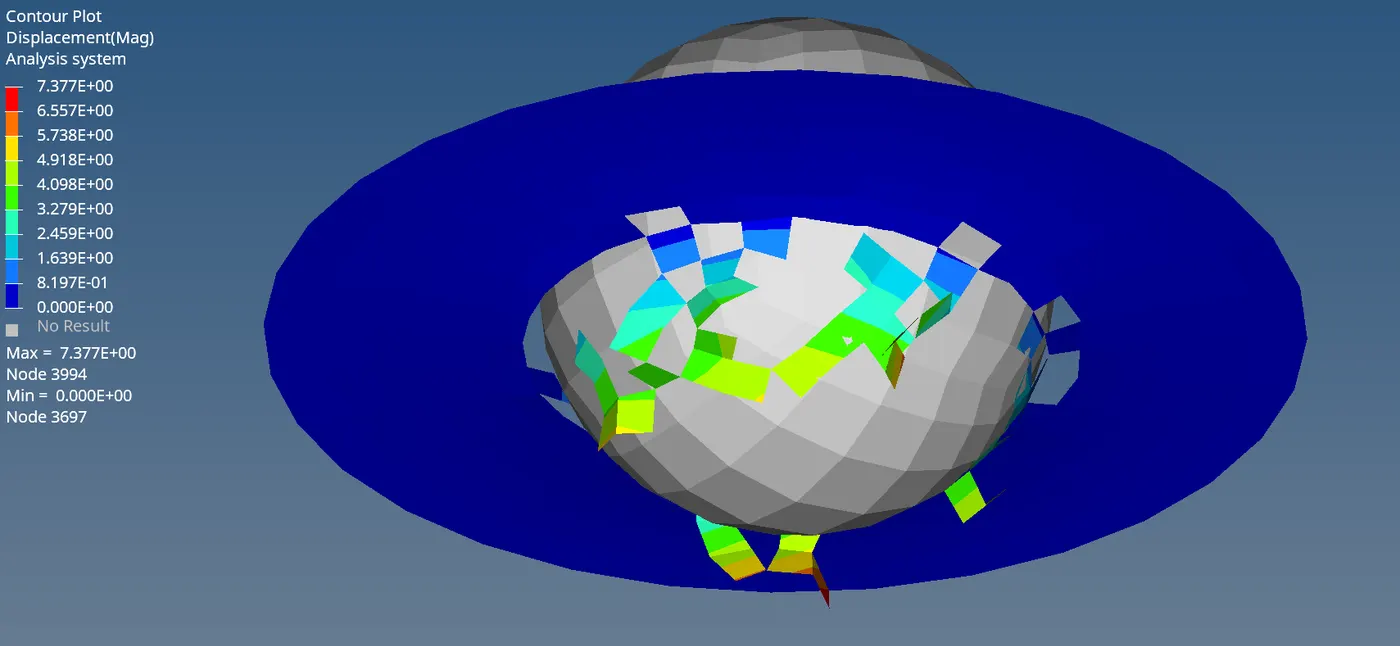
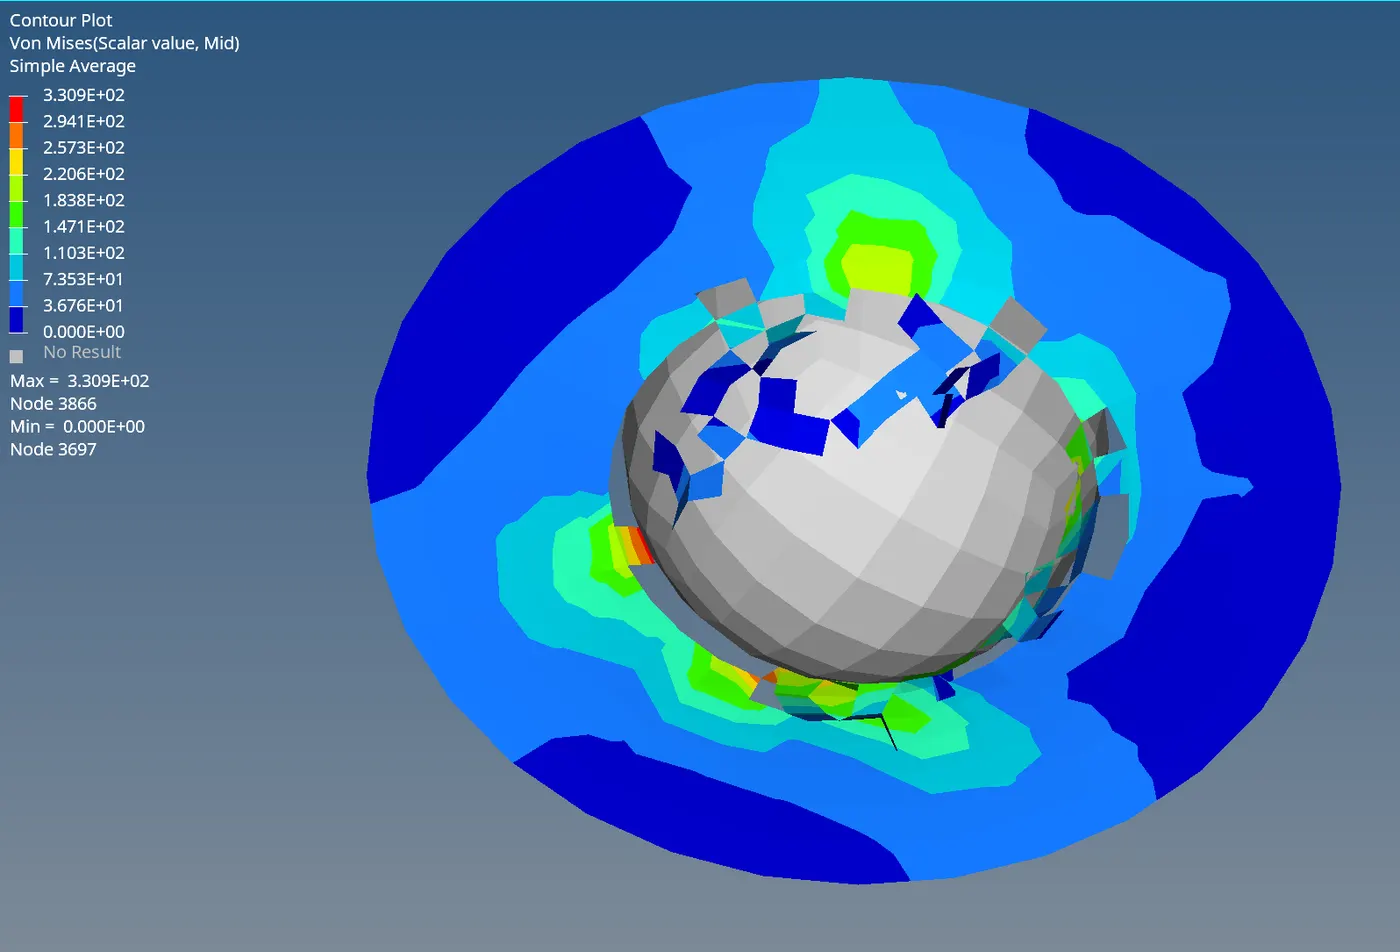
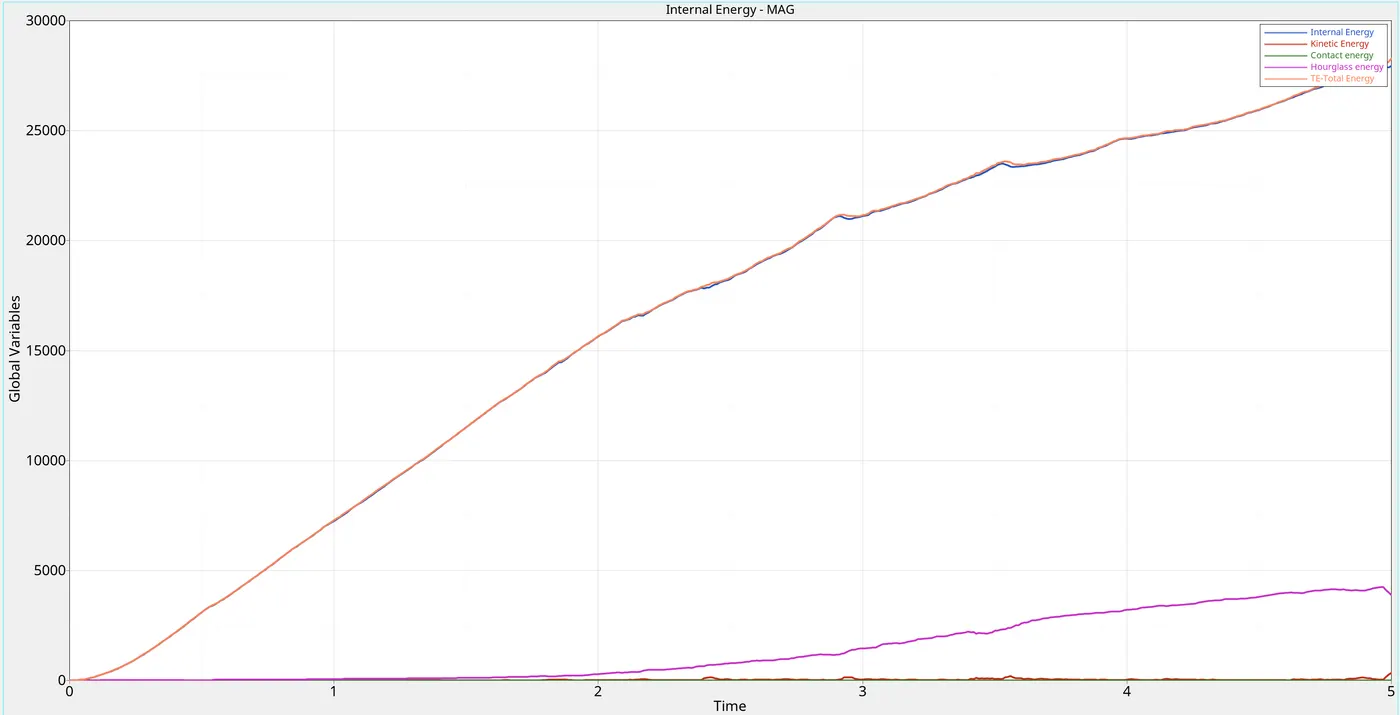
3. Deformation behaviour: The deformation is similar to previous results with large amount of hourglassing, which leads to unnatural element deformation behaviour.
4. Displacement plot:
5. Von Mises stress distribution:
6. Energy Plots:
Case 7:
In this case we will be using the Plas_Tab material
1. Assign the material card 36 and the properties provided in the slides. Run the simulation
2. The energy error varies between 0.9% and -1.9%. Mass error is 0.
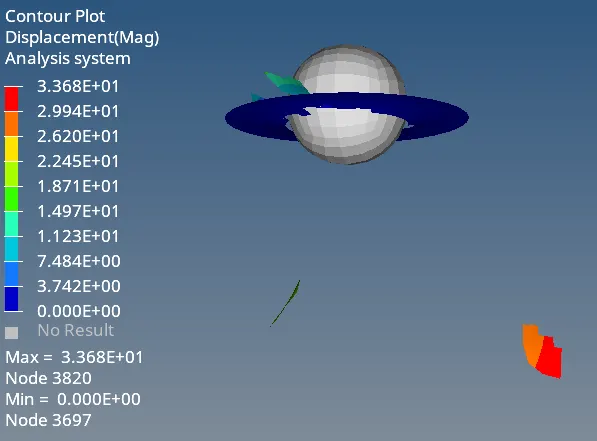
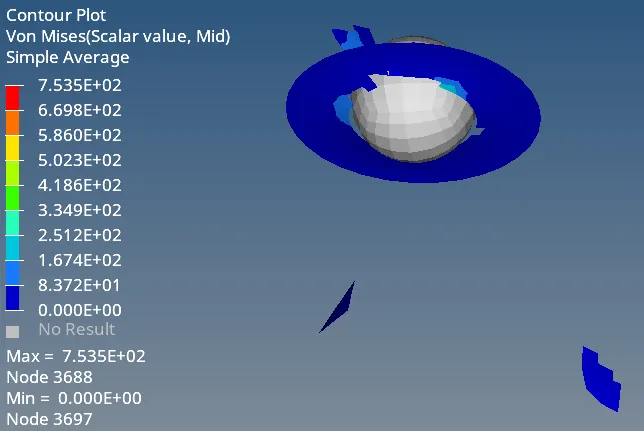
3. Deformation behaviour: As with previous cases, the deformation behaviour is unnatural.
4. Displacement plot:
5. Von Mises stress distribution:
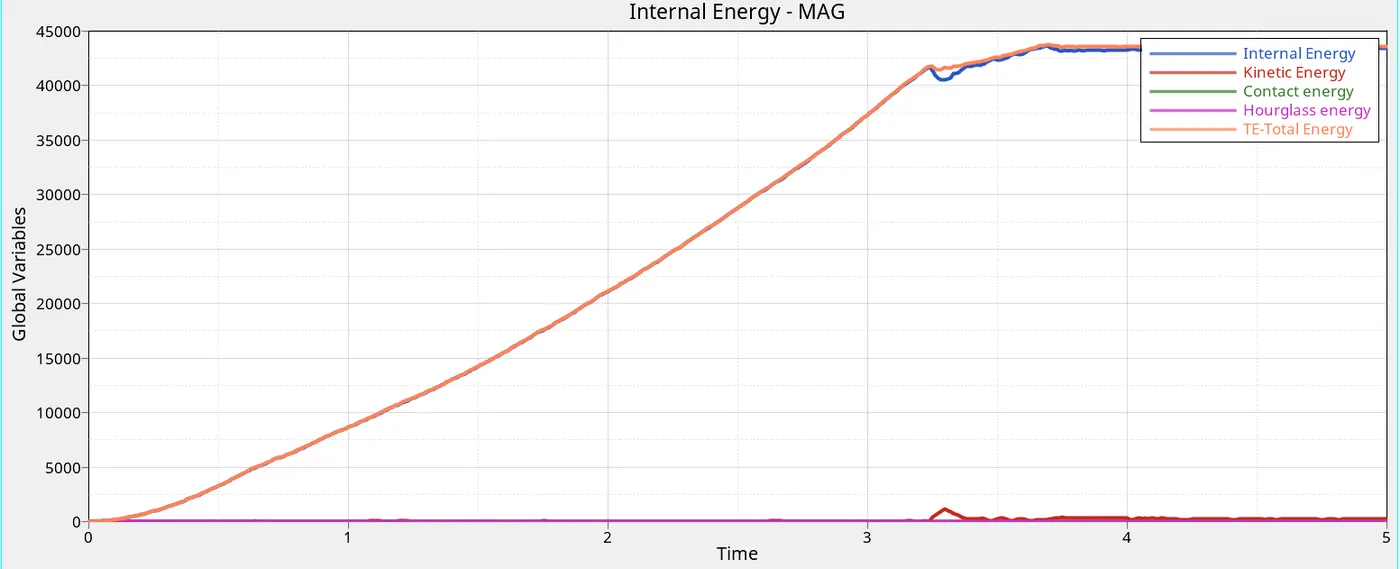
6. Energy Plots:
Summary:
The above results can be summarised as shown in the table below:
| Sr. No | Case | Simulation time (s) | No. of cycles | Max displacement (mm) | Max Von Mises stress (Gpa) |
Energy error (%) |
Hourglassing |
| 1 | Law2_epsmax_failure | 71.2 | 38769 | 17.4 | 285.7 | 0.1 to -10 | High |
| 2 | Law2_epsmax_crack | 68.48 | 39343 | 15.15 | 296.5 | 2.3 to -9.4 | High |
| 3 | Law2_epsmax_nofail | 77.63 | 43175 | 10.63 | 337.6 | 0.3 to -11.9 | High |
| 4 | Law2 | 66.74 | 38857 | 6.05 | 360.7 | 1.1 to -2.6 | Low |
| 5 | Law1 | 69.43 | 37562 | 5 | 9574 | 2.1 to -9.6 | High |
| 6 | Law27 | 94.95 | 42807 | 7.377 | 330.9 | 0.6 to -9.1 | High |
| 7 | Law36 | 105.77 | 52206 | 33.68 | 753.5 | 0.9 to -1.6 | Low |
Stress study:
1. We can see that in case 5, i.e elastic material, the max stress value is the highest. This is because there is no element failure and hence no energy is lost. All the energy is sustained by the plate, which leads to the abnormal stress value.
2. In case 4, we see a higher value of stress compared to the other elasto-plastic materials, because strain failure criteria is removed. Thus fewer elements fail and hence there is more amount of energy sustained by the elements, leading to higher stress values.
3. When failure card is removed in case 3, the max stress value increases, as less number of elements will fail and hence more energy will be sustained, leading to higher stress values.
Energy Study:
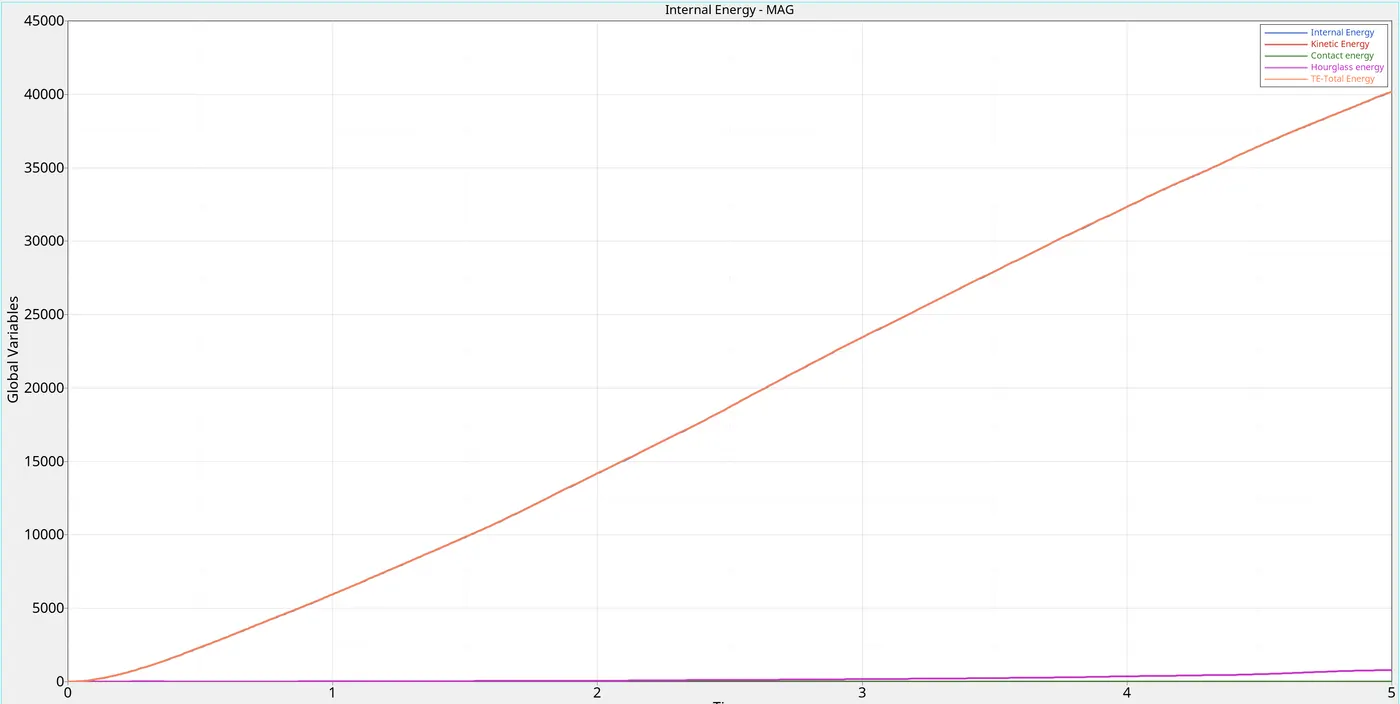
1. As expected, the total energy in the case of elastic material is the highest, as no energy is lost to failing elements. There is some hourglassing, but its proportion compared to the total energy is lower as compared to other elastic-plastic materials.
2. The total energy graph in case of elastic material is an exponetial curve, as the energy buildup keeps increasing. In contrast, in other cases the elements lost energy and hence the curve has a higher slope in the beginning, which flattens out as the elements are lost due to failure and hence offer no resistance.
Simulation time:
Case 7 took the highest time to solve, while case 4 took the least.
Conclusion:
1. The first 3 cases achieved relatively similar values of max stress and total energy.
2. The deformation behaviour of all cases except Case 4 was unnatural, with the elements splitting off the model, which is due to large amount of hourglassing
3. Elastic material gives a highly unrealistic scenario in case of large deformations
4. Based on the deformation behaviour and stress values, it is safe to asume that Case 4 represents a scenario that best matches real world test conditions.