COMPARISON OF DIFFERENT MATERIAL LAWS WITH A SPHERE AND RUPTURE PLATE MODEL IN RADIOSS
AIM:
To run the simulation for seven different cases and to compare the results of seven cases.
OBJECTIVE:
- To run the simulation by using the Failure Johnson model and named as Law2_epsmax_failure and save the results.
- To modify the Failure Johnson parameters of the previous model by changing the value of ifail_sh = 1, Dadv =1, and ixtem = 1, to run the model and named as Law2_epsmax_crack.
- By deleting the Failure Johnson card and run the simulation as Law2_epsmax_nofail.
- To remove the Eps_p_max value from the default Failure Johnson model and run the simulation as Law2.
- By changing the card image of the previous model from Law2 to Law1 elastic and save the results.
- To change again the card image of the previous model from law1 to Law 36 elasto_plastic and save the results.
- Importing the Law27 model with recommended shell properties and run the simulation
- Compare all the results and observe each case.
SOFTWARE USED: HYPERMESH.
KEYWORDS: Internal energy, Kinetic energy, Total energy, Von Moses stress.
THEORY:
Law 1_Elastic:
This material law is used to model purely elastic materials. The material stiffness is determined by only two values: the Young's modulus (E), and Poisson's ratio ( υ">υυ ). The shear modulus (G) can be computed using E and ν">νν ,
The value of density is always used in explicit simulations and it may also be used in static implicit simulations to reach a better convergence in quasi-static analysis.
Global integration approach is applied to LAW1 and shell elements (/PROP/TYPE1 (SHELL)), when the number of integration points through the shell thickness is different from NP=1 (membranes).
Law 2_Johnson Cook:
This is an elasto-plastic material model that includes strain rate and temperature effects with true stress and strain output.
In this model the material behaves as a linear-elastic material when the equivalent stress is lower than the plastic yield stress. For higher stress values, the material behavior is plastic, and the true stress is calculated as,
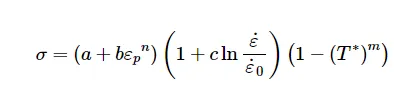
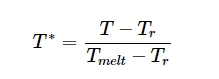
εp">εpεp - Plastic strain
ε˙">˙εε˙ - Strain rate
T">TT - Temperature
Tr - Ambient temperature
Tmelt - Melting temperature
In this model, the material behaves as a linear-elastic material when the equivalent stress is lower than the plastic yield stress. For higher stress values, the material behavior is plastic and the stress is calculated as,
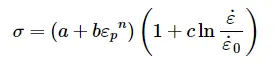
εp">εpεp - Plastic strain
ε˙">˙εε˙ - Strain rate
The plasticity hardening exponent, n must be less than 1
Law36_Plas_Tab:
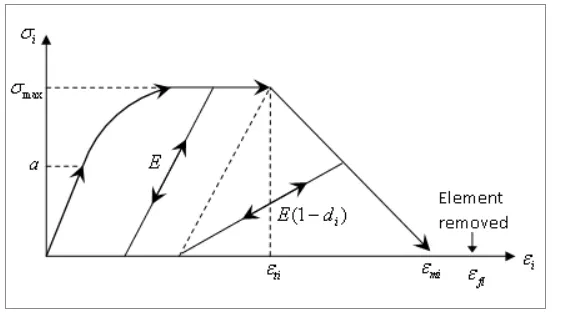
The first point of yield stress functions (plastic strain vs stress) should have a plastic strain value of zero. If the last point of the first (static) function equals 0 in stress, default value of εpmax">εmaxpεpmax is set to the corresponding value of εp">εpεp .
Element deletion.
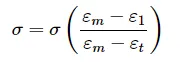
The kinematic hardening model is not available in global formulation (N=0 in shell property keyword) that is, hardening is fully isotropic.
In case of kinematic hardening and strain rate dependency, the yield stress depends on the strain rate.
Strain rate filtering is used to smooth strain rates.
In these two simple examples, strain rate and temperature are not considered. The stress-strain relationship could be simplified,
With three typical loadings (example: pure tension, pure shear or pure compression) material parameter D1 D2 and D3 could be determined using the above simplified stress-stain relationship.
Case-1
law2_epsmax:
- Initially open the model by selecting the import option and load the file as Failure_Johnson_0000.rad and now the model will display that is shown below,
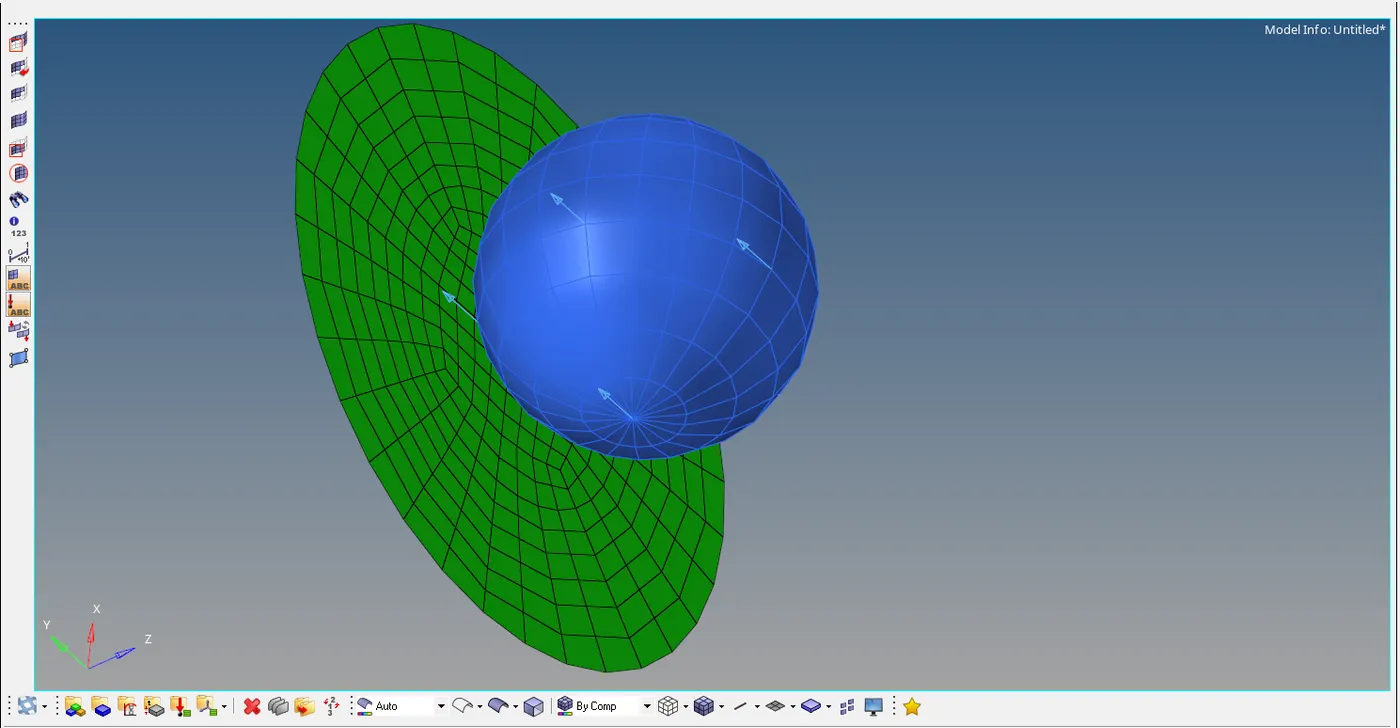
- Run the model as it is without changing any material and failure card and named it as Law2_epsmax_failure. By selecting the option Analysis>radioss and select the folder to save the output of simulation and named the folder as Law2_epsmax_failure.
- In the analysis toolbar enter the option as -nt 4 to get better performance and results. Now select radioss option to run the simulation.
- After completion of the simulation, the output will be stored in that saved folder Law2_epsmax_failure and open the output file Law2_epsmax_failure_0001.out we will obtain the energy error and mass error in that output that is shown below,

Fig: Energy error and Mass error
- The total number of cycles and the simulation time also noticed in that output and the values are shown below,
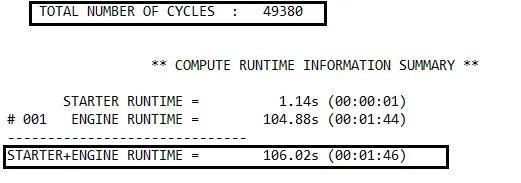
Fig: CycleTime
- Now we want to create the Vonmises stress Contour Plot by selecting the workspace as hyperview then load the model Law2_epsmax_failure.h3d and click apply to obtain the model that box is shown as below,

- In hyper view we want to change some options like result type as Vonmises and averaging mode as simple. Therefore after changed the option and click apply to get Vonmises stress Contour Plot that is shown below,
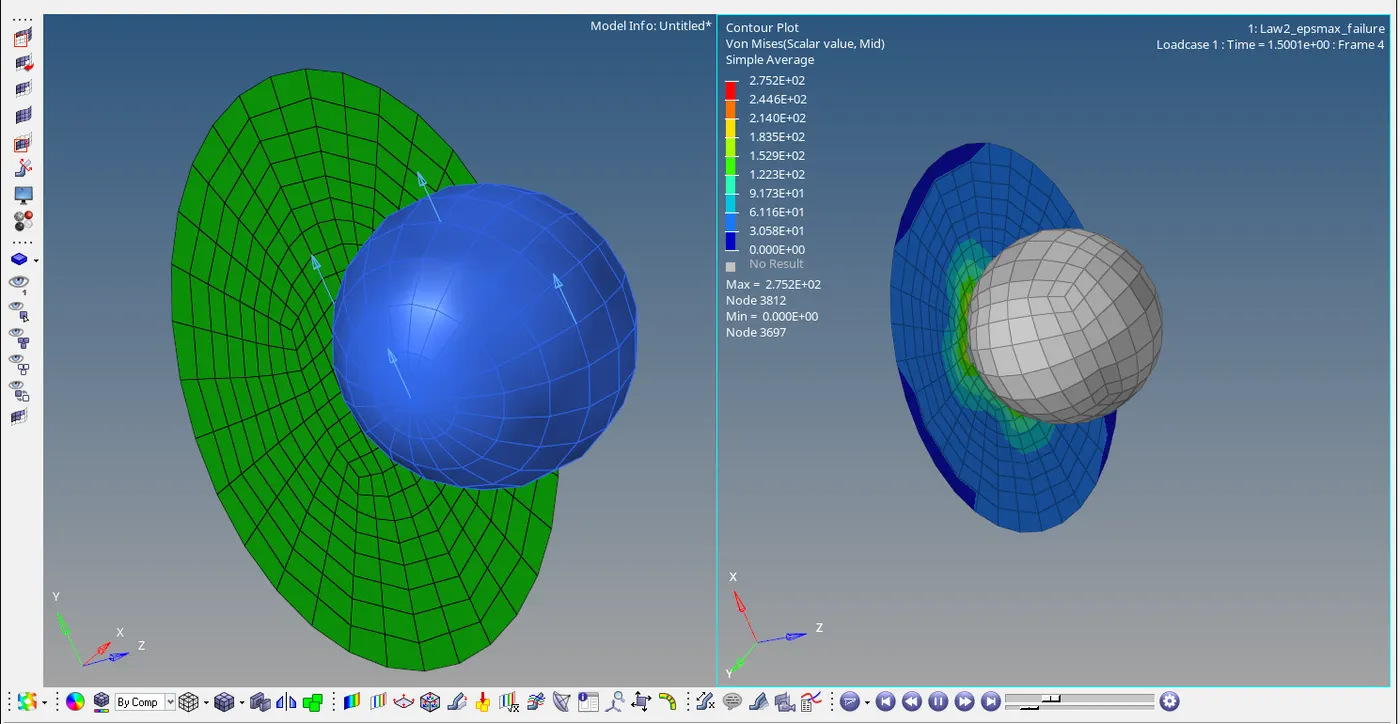
Fig: Open model with Vonmises stress Contour Plot
- Now the contour plot is generated click the mesh icon to visualize the deformation of elements in each node. Here if you see in the plot contour above is Von Mises stress, here the component going to crash with time as we run our simulation. It shows a different range of colors as stress increases on the component. Von Mises stress is a value used to determine if a given material will yield or fracture. It is mostly used for ductile materials, such as metals. Von Mises stress is computed and compared to the yield stress material. If the von mises is smaller than the yield stress the computed stress is the one used in order to compute the internal force of the element
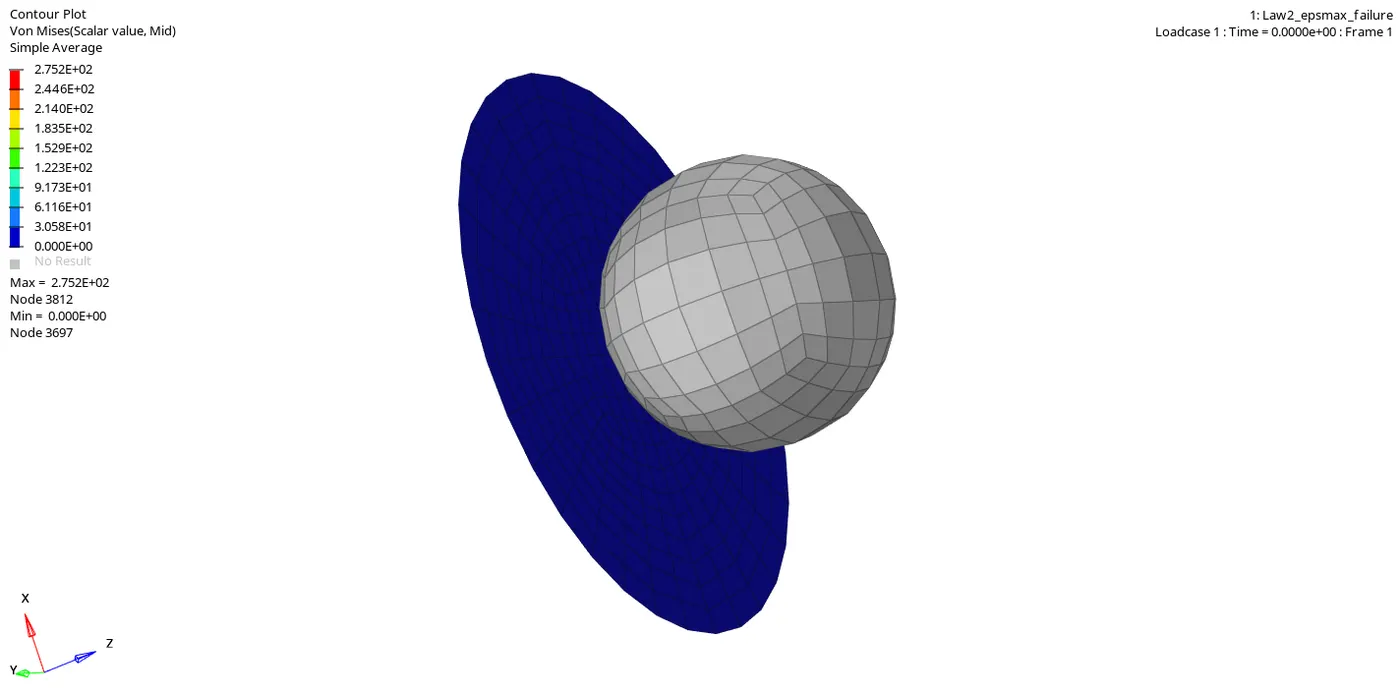
Fig: Vonmises stress Contour Plot
- Here above Von mises stress plot shows that the maximum value of stress is 2.752E+02Mpa and the minimum value of stress as 0 during the rigid ball crashed in the Aluminium plate.
- To create the plot for each energy and absorbs that what was happening during the crash and how could the element gets deforming while applying some force. Now select hyperchart option that will give the empty graph as a display. Import the file Law2_epsmax_failureT01 and click the apply option.
ENERGY PLOTS:
INTERNAL ENERGY:
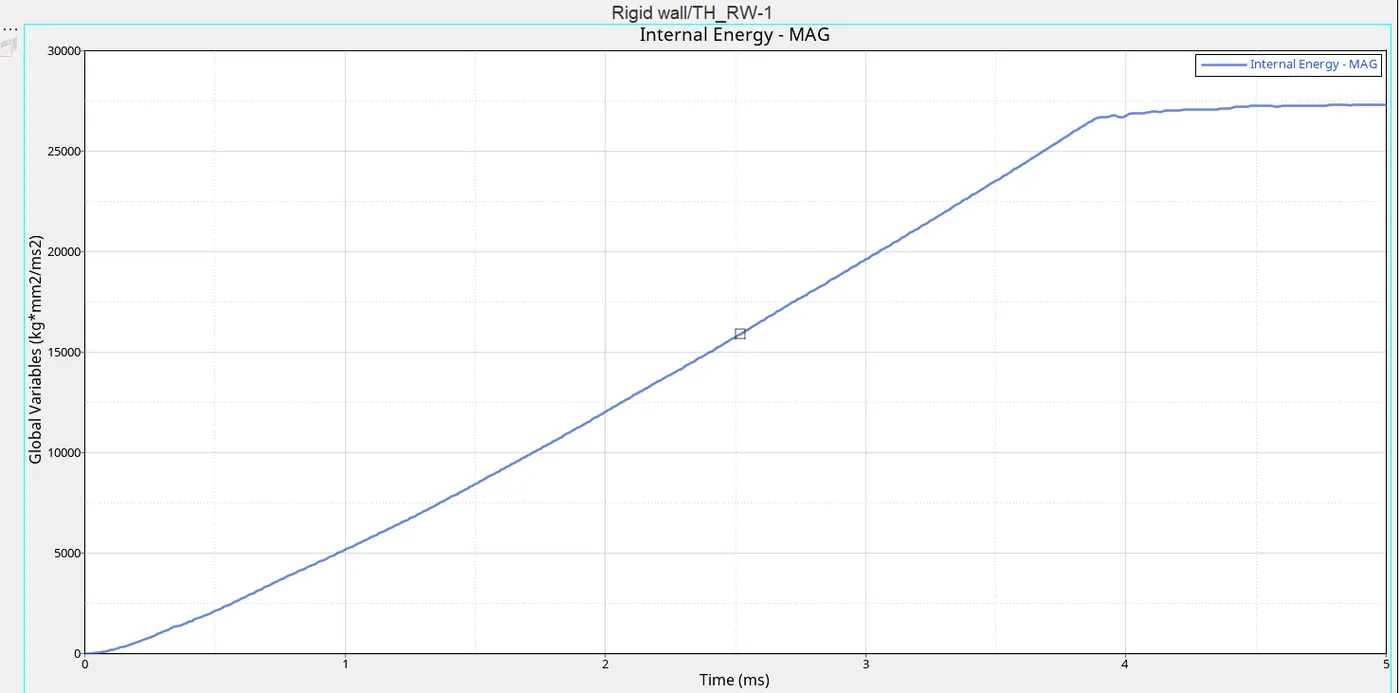
Fig: Internal Energy Plot
- This energy plot shows that increase in energy while the rigid ball crashed on the aluminium plate because of the contacts in the element it rises and after deformation of elements it will break and there is no contact between the elements then it flows constantly.
- It reaches above 25000kg*mm^2/ms^2 when the time of 4ms and after that elements in the plate is deleted and remains constant.
KINETIC ENERGY:
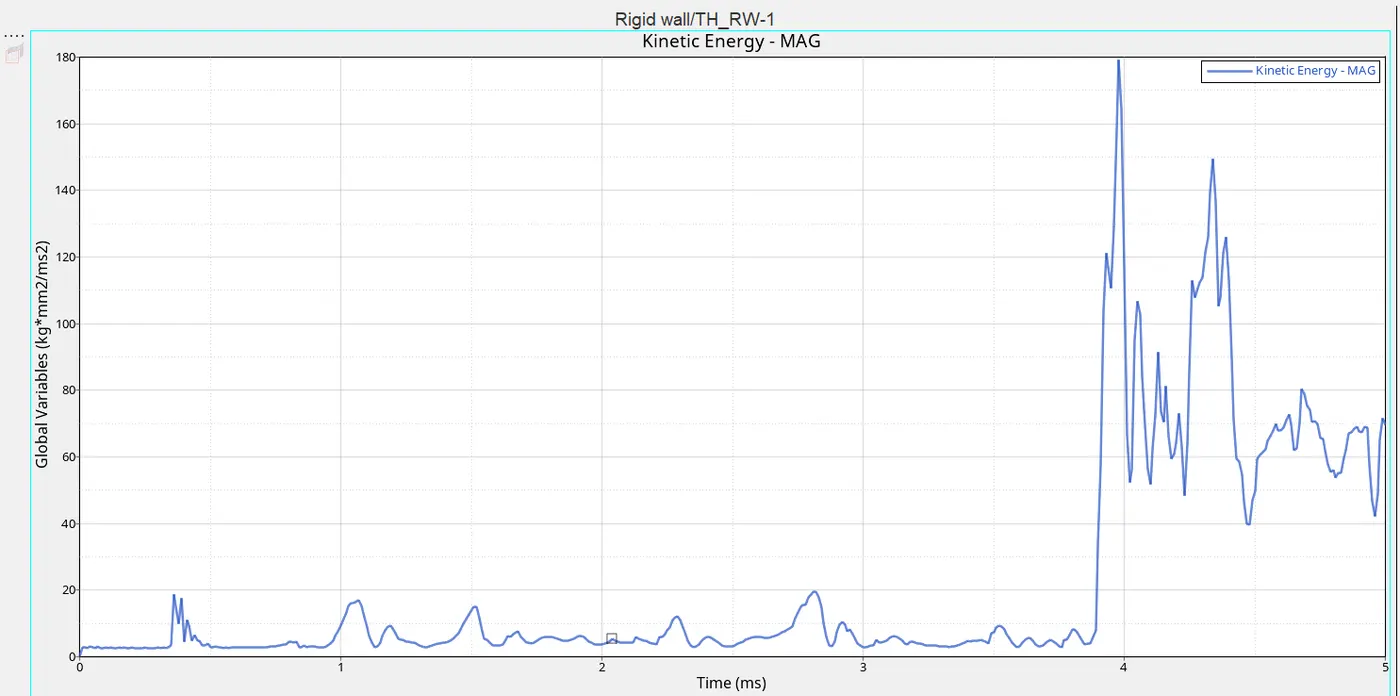
Fig: Kinetic Energy Plot
- In this energy, the plot shows that while the kinetic energy is acting between the rigid punch and the plate it keeps a constant flow of energy but it reaches the yield point of 180 kg*mm^2/ms^2 when the time of 4ms elements will delete and there is no contact between the punch and the aluminium plate that case the sudden peak will appear.
- After the deletion of an element, it will again decrease due to no contact between the punch and plate.
TOTAL ENERGY:
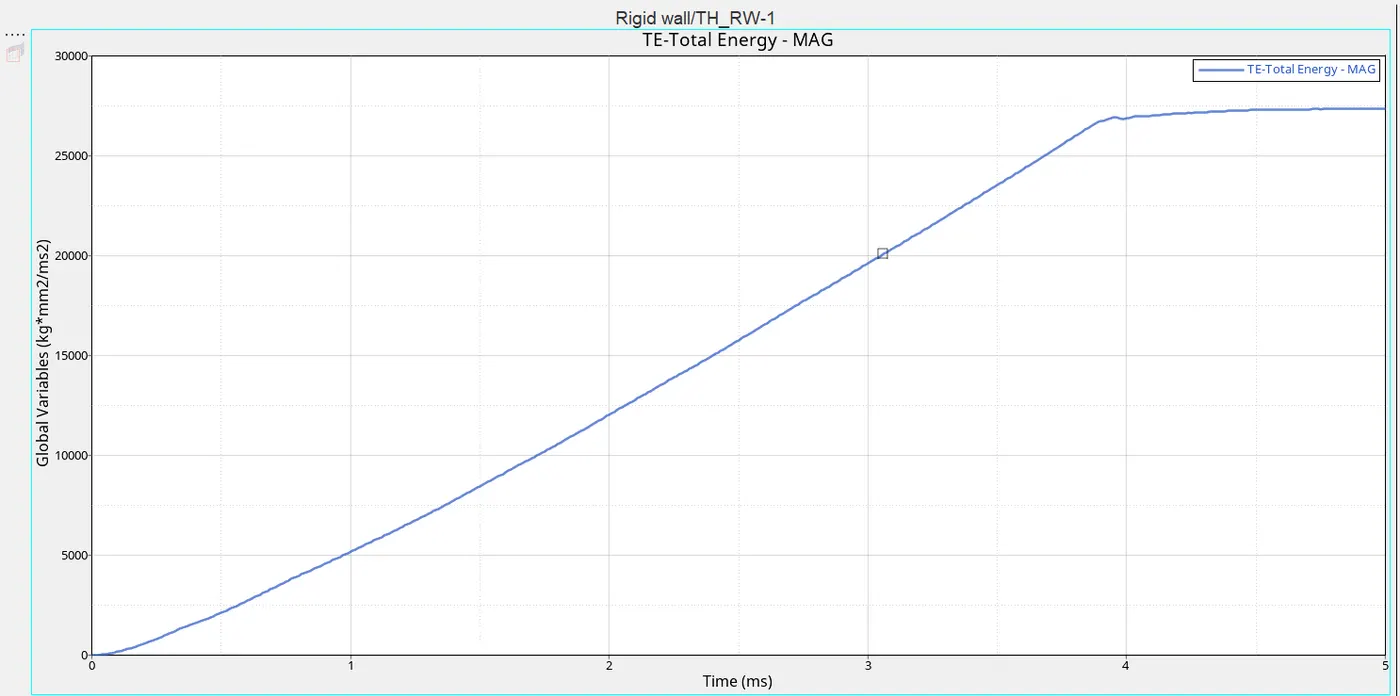
Fig: Total Energy Plot
- This energy plot shows the total energy acting when the rigid ball is crashed on the aluminium plate and that energy is represented as total energy = sum of internal energy and kinetic energy.
- In this graph, energy reaches above 26000 kg*mm^2/ms^2 at the time of 4.8 sec.
TOTAL PLOT:
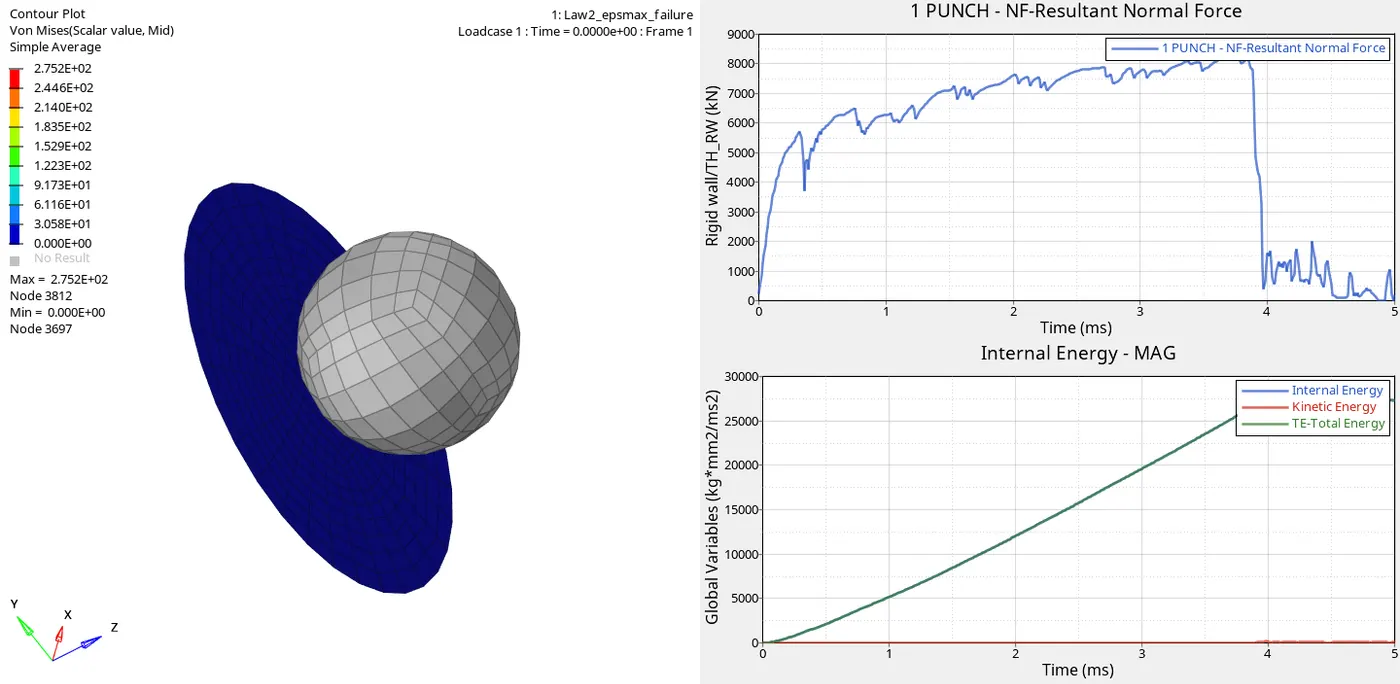
FIG: Total Plots
- By observing these energy plots show that internal energy reaches a certain level in the graph because of elements contact with the punch it will create some energy so that it increases in the internal plot. When the deformation of elements is acted that will break the element in a certain yield point. The break in elements shows the constant flow in the internal plot because of no contact in punch and plate.
- The kinetic energy is obtained when the punch is crashed on the plate and while deletion of the element it shows that peak in energy and again it will decrease due to no contact of the plate.
- The total energy will calculate depends upon the internal energy and kinetic energy because the sum of all energy is considered as total energy. Therefore the total energy plot shows the rise in energy for a certain level and then it flows constantly.
Case-2
Law2_epsmax_crack:
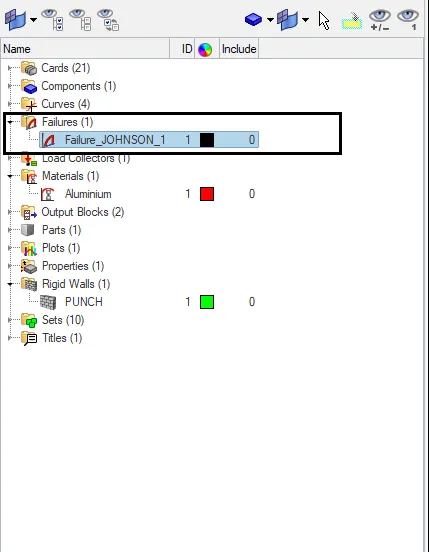
- In case-2 same process is followed as like case-1 open the model by selecting the import option and load the file as Failure_Johnson_0000.rad and now the model will display. Now select the failure card and change the values that are shown below,
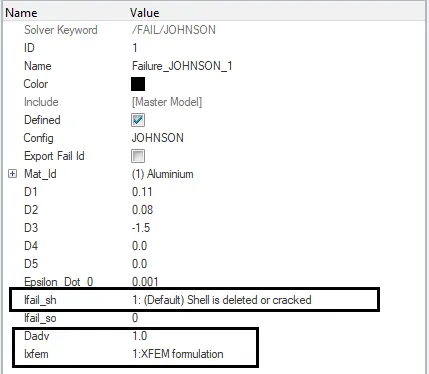
- Run the model by changing the failure card as ifail_sh = 1, Dadv = 1, and ixfem = 1 then named it as Law2_epsmax_crack. By selecting the option Analysis>radioss and select the folder to save the output of simulation and named the folder as Law2_epsmax_crack. The changed values are shown below,
- In the analysis toolbar enter the option as -nt 4 to get better performance and results. Now select radioss option to run the simulation.
- After completion of the simulation, the output will be stored in that saved folder Law2_epsmax_crack and open the output file Law2_epsmax_crack_0001.out we will obtain the energy error and mass error in that output that is shown below,

Fig: Energy error and Mass error
- The total number of cycles and the simulation time also noticed in that output and the values are shown below,
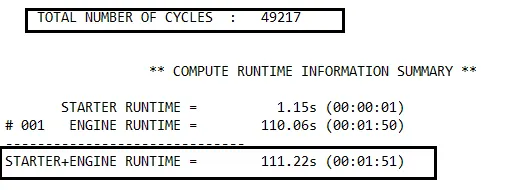
Fig: CycleTime
- Now we want to create the Vonmises stress Contour Plot by selecting the workspace as hyperview then load the model Law2_epsmax_crack.h3d and click apply to obtain the model that box is shown as below,

- In hyperview we want to change some options like result type as Vonmises and averaging mode as simple. Therefore after changed the option and click apply to get Vonmises stress Contour Plot that is shown below,
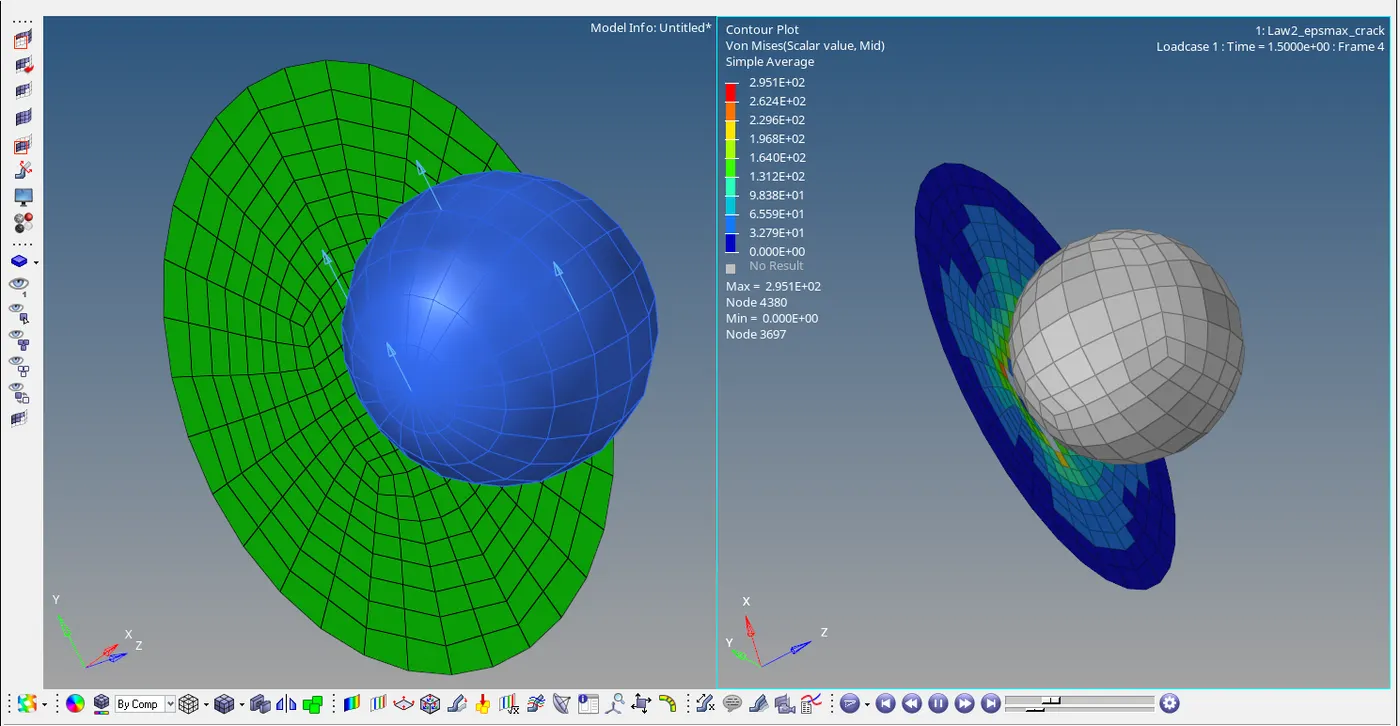
Fig: Open model with Vonmises stress Contour Plot
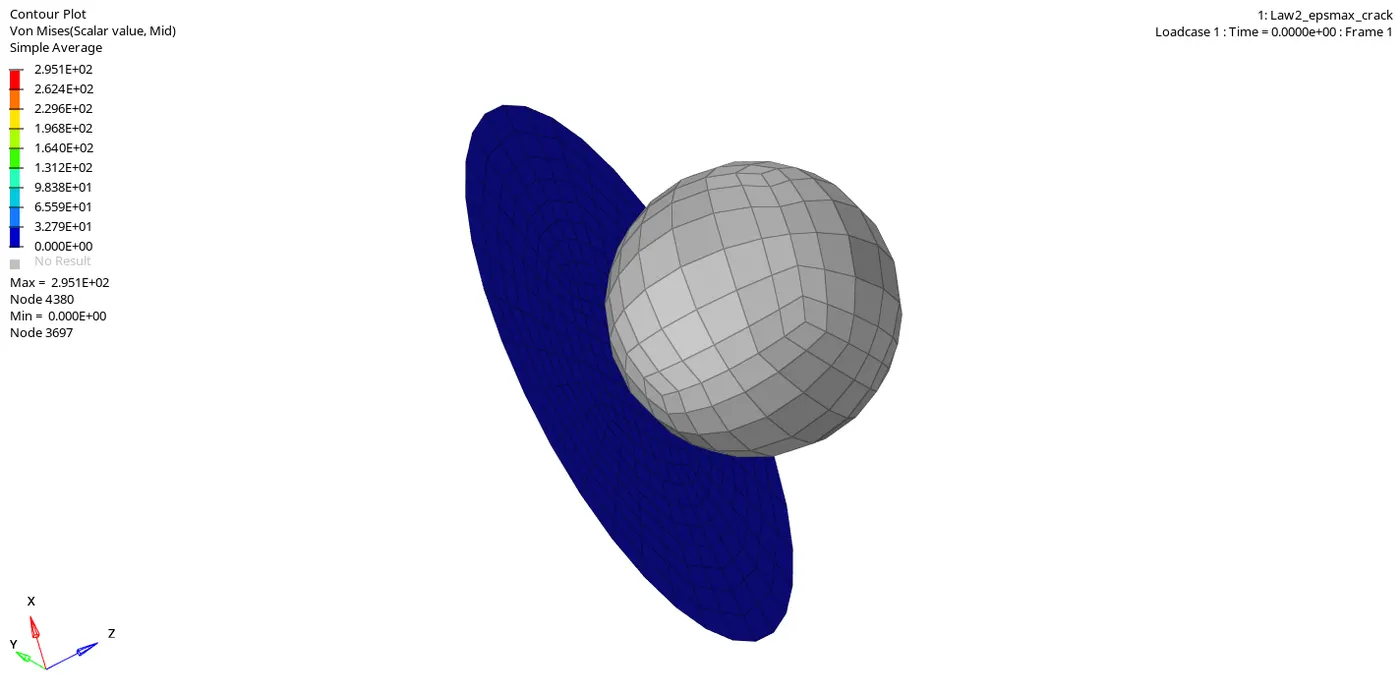
Fig: Vonmises stress Contour Plot
- Here above Von mises stress plot shows that the maximum value of stress is 2.951E+02Mpa and the minimum value of stress as 0 during the rigid ball crashed in the Aluminum plate.
- To create the plot for each energy and absorbs that what was happening during the crash and how could the element gets deforming while applying some force. Now select hyperchart option that will give the empty graph as a display. Import the file Law2_epsmax_crackT01 and click the apply option that toolbar is shown as below,

ENERGY PLOTS:
INTERNAL ENERGY
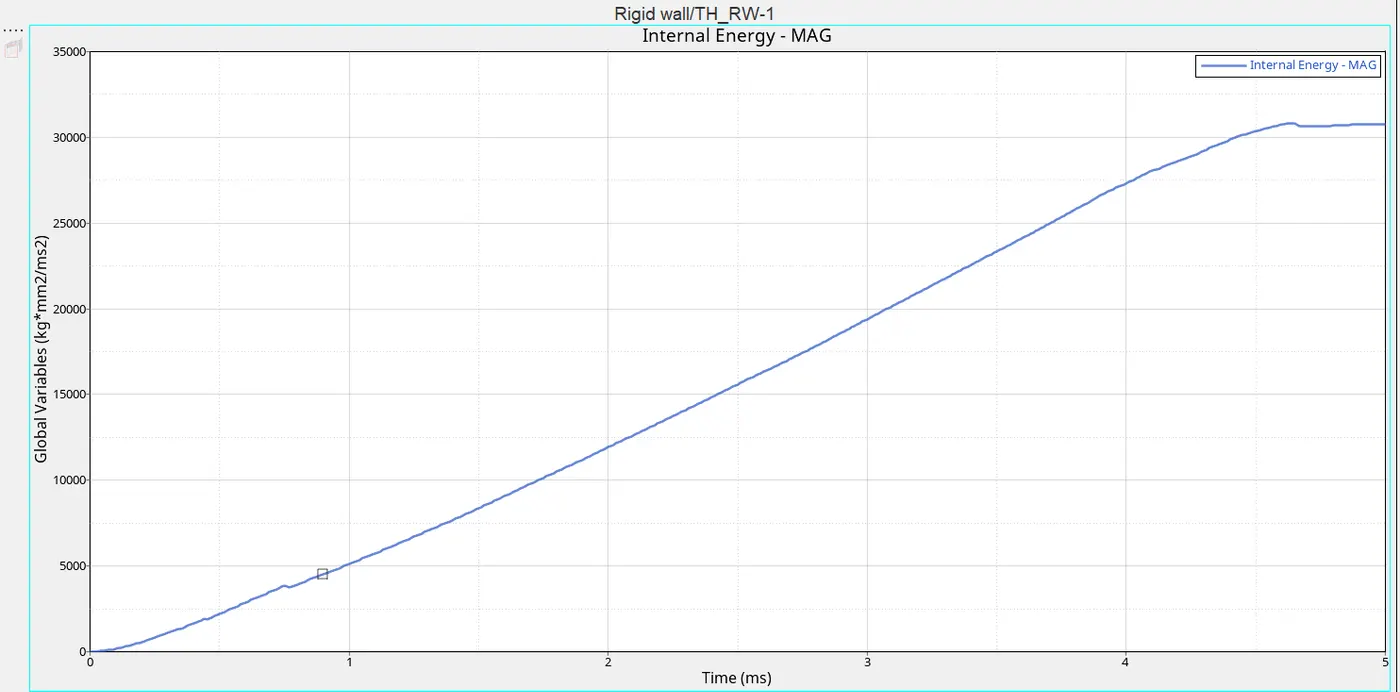
Fig: Internal Energy Plot
- This energy plot shows that increase in energy while the rigid ball crashed on the aluminium plate because of the contacts in the element it rises and after deformation of elements it will break and there is no contact between the elements then it flows constantly.
- It reaches above 30000kg*mm^2/ms^2 when the time of 4.5ms and after that elements in the plate is deleted and remains constant.
KINETIC ENERGY:
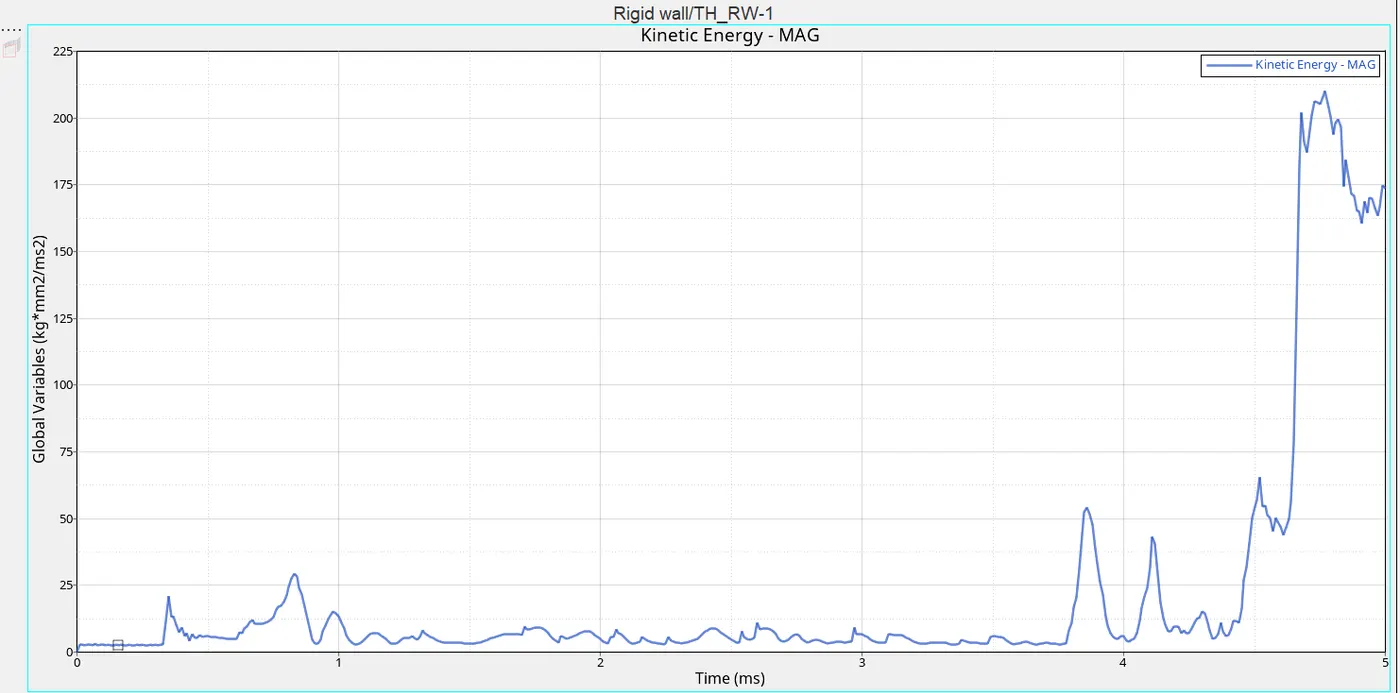
Fig: Kinetic Energy Plot
- In this energy, the plot shows that while the kinetic energy is acting between the rigid punch and the plate it keeps a constant flow of energy but it reaches the yield point of 210 kg*mm^2/ms^2 at the time of 4.8ms elements will be deleted and there is no contact between the punch and the aluminium plate that case the sudden peak will appear.
- After the deletion of the element, it will again decrease due to no contact between the punch and plate.
TOTAL ENERGY:
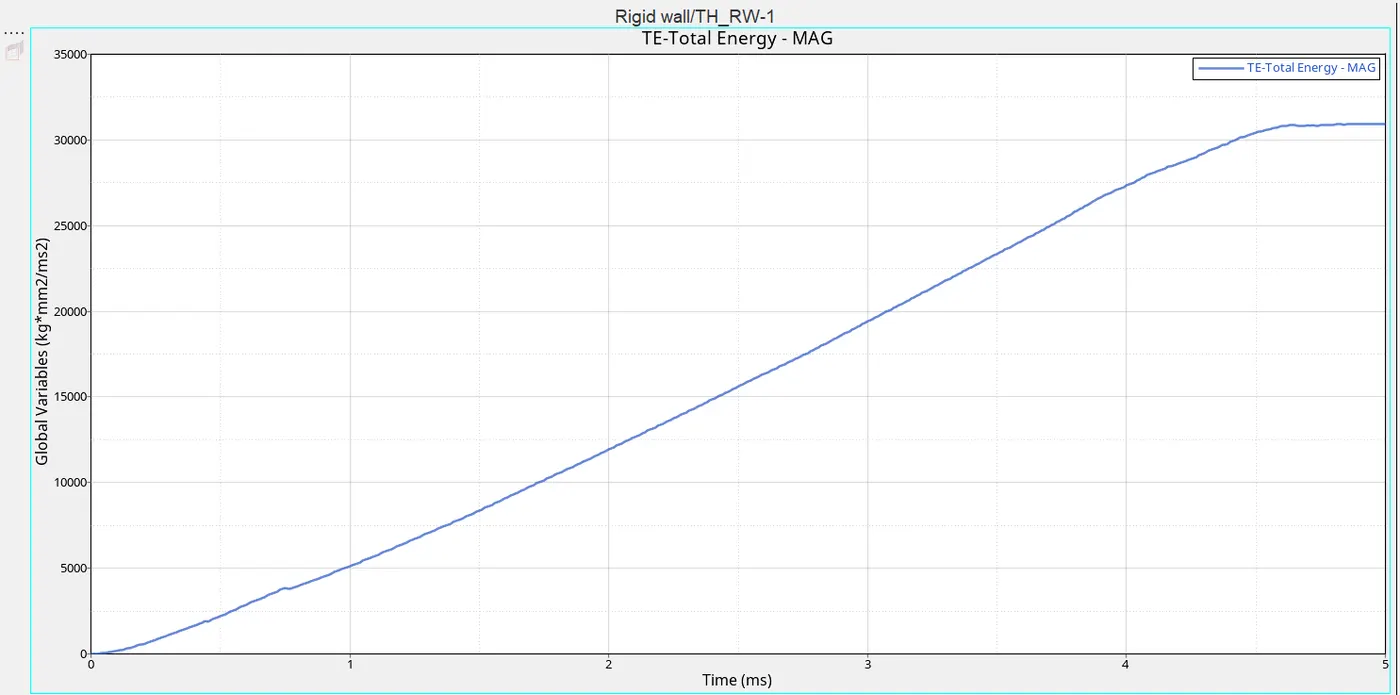
Fig: Total Energy Plot
- This energy plot shows the total energy acting when the rigid ball is crashed on the aluminium plate and that energy is represented as total energy = sum of internal energy and kinetic energy.
- In this graph, an energy reaches above 30000 kg*mm^2/ms^2 at the time of 4.5 sec.
TOTAL PLOTS:
Fig: Total Plots
Case-3
Law2 -epsmax_nofail:
- In this case, the same process is followed as like a case-1, open the model by selecting the import option and load the file as Failure_Johnson_0000.rad and now the model will display. Before running the model we want to delete the failure card in this case. Run the model and named it as Law2 -epsmax_nofail.
- The deleted image of the failure card in that model is shown below,
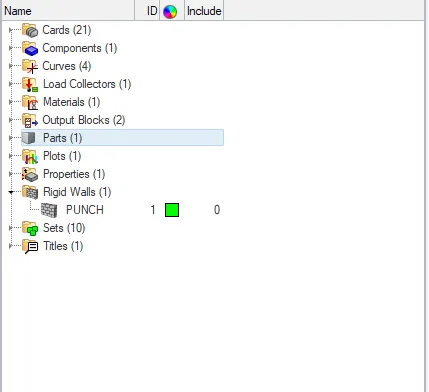
- By selecting the option Analysis>radioss and select the folder to save the output of simulation and named the folder as Law2_epsmax_nofails.
- In the analysis toolbar enter the option as -nt 4 to get better performance and results. Now select radioss option to run the simulation.

- After completion of the simulation, the output will be stored in that saved folder Law2_epsmax_nofail and open the output file Law2_epsmax_nofail_0001.out we will obtain the energy error and mass error in that output that is shown below,

Fig: Energy error and Mass error
- The total number of cycles and the simulation time also noticed in that output and the values are shown below,
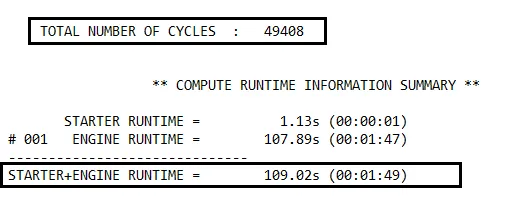
Fig: CycleTime
- Now we want to create the Vonmises stress Contour Plot by selecting the workspace as hyperview then load the model Law2_epsmax_nofail.h3d and click apply. In hyperview we want to change some options like result type as Vonmises and averaging mode as simple. Therefore after changed the option and click apply to get Vonmises stress Contour Plot that is shown below,
Fig: Open model with Vonmises stress Contour Plot
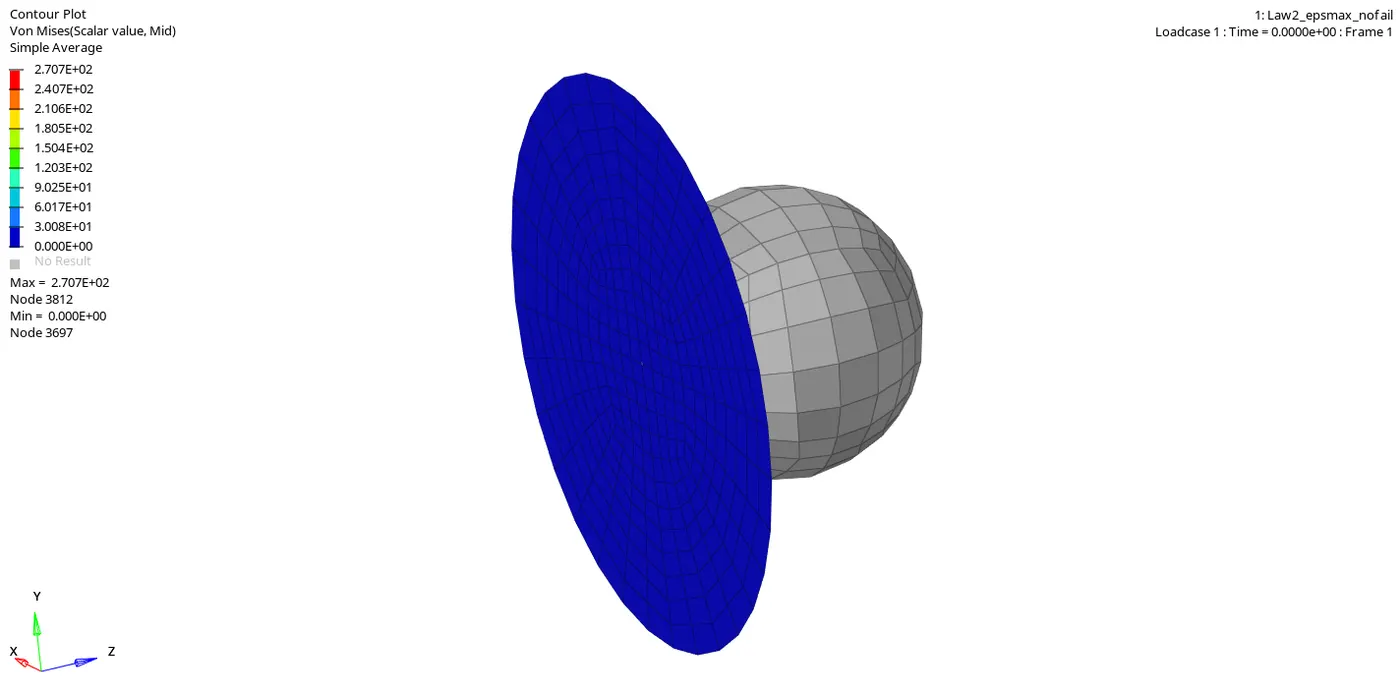
Fig: Vonmises stress Contour Plot
- Here above Von mises stress plot shows that the maximum value of stress is 2.707E+02Mpa and the minimum value of stress as 0 during the rigid ball crashed in the Aluminium plate.
- To create the plot for each energy and absorbs that what was happening during the crash and how could the element gets deforming while applying some force. Now select hyperchart option that will give the empty graph as a display. Import the file Law2_epsmax_nofailT01 and click the apply option.
ENERGY PLOTS:
INTERNAL ENERGY:
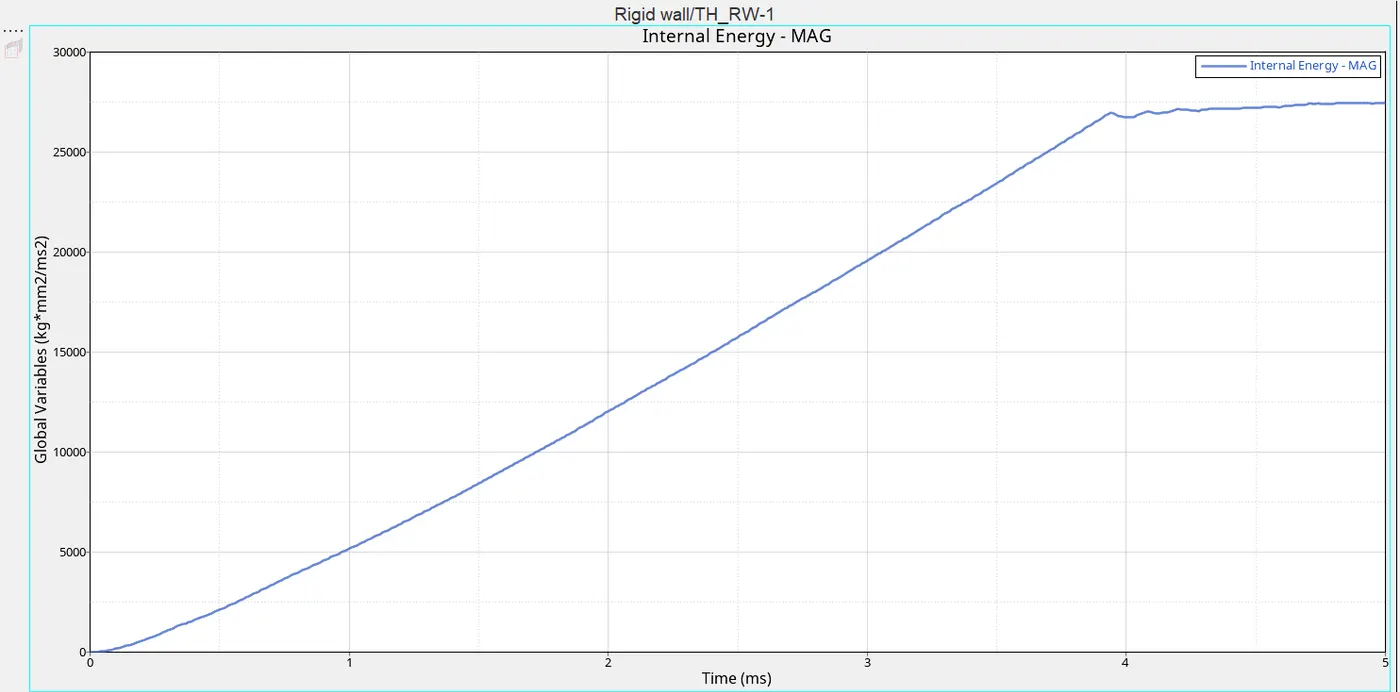
Fig: Internal Energy Plot
- This energy plot shows that increase in energy while the rigid ball crashed on the aluminium plate because of the contacts in the element it rises and after deformation of elements it will break and there is no contact between the elements then it flows constantly.
- It reaches above 27000kg*mm^2/ms^2 when the time of 3.9ms and after that elements in the plate is deleted and remains constant.
KINETIC ENERGY:
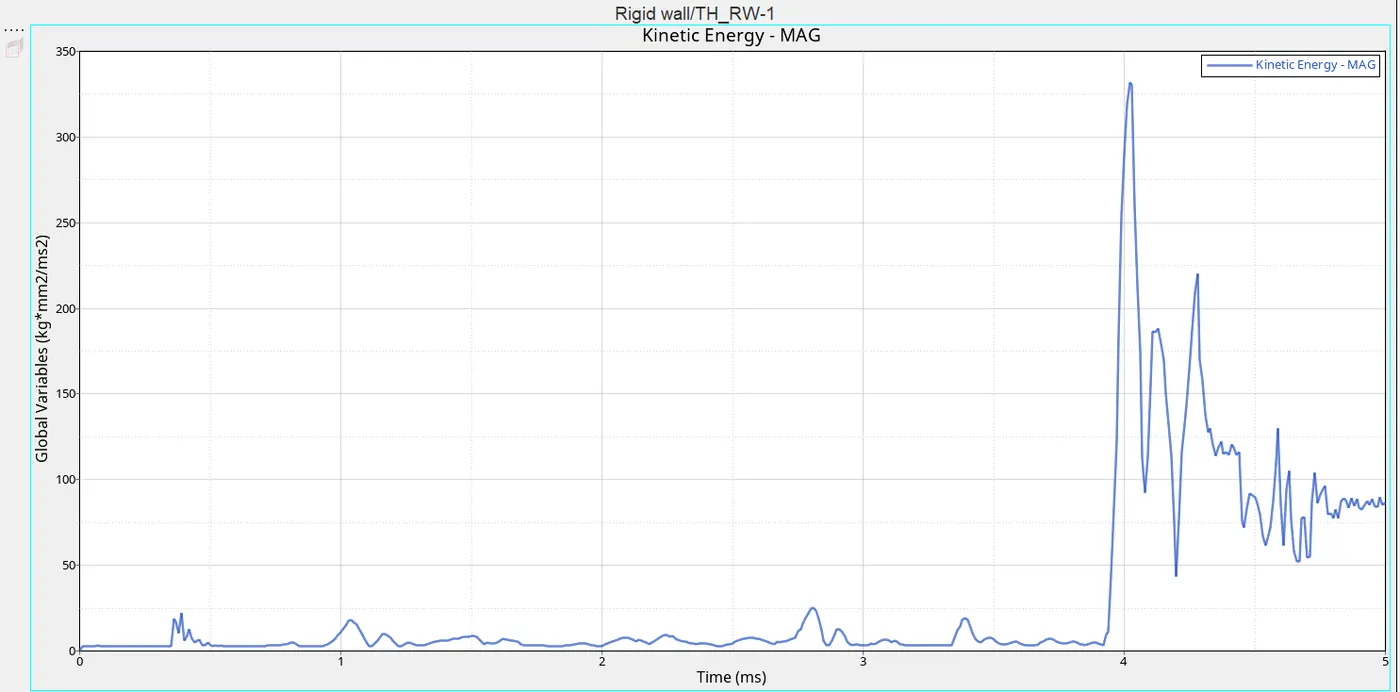
Fig: Kinetic Energy Plot
- In this energy, the plot shows that while the kinetic energy is acting between the rigid punch and the plate it keeps a constant flow of energy but it reaches the yield point of 330 kg*mm^2/ms^2 when the time of 4ms an element will be deleted and there is no contact between the punch and the aluminium plate that case the sudden peak will appear.
- After the deletion of the element, it will again decrease due to no contact between the punch and plate.
TOTAL ENERGY:
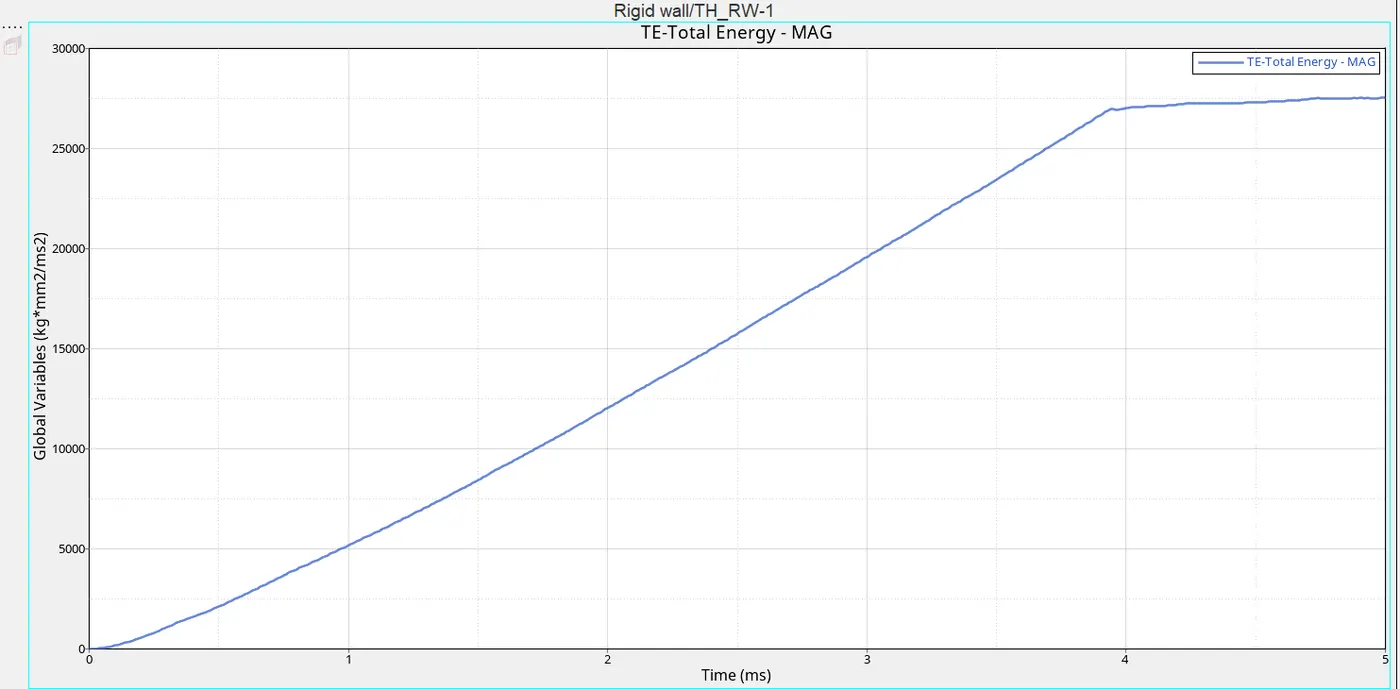
Fig: Total Energy Plot
- This energy plot shows the total energy acting when the rigid ball is crashed on the aluminium plate and that energy is represented as total energy = sum of internal energy and kinetic energy.
- In this graph, energy reaches above 27000 kg*mm^2/ms^2 at the time of 3.8 sec.
TOTAL PLOTS:
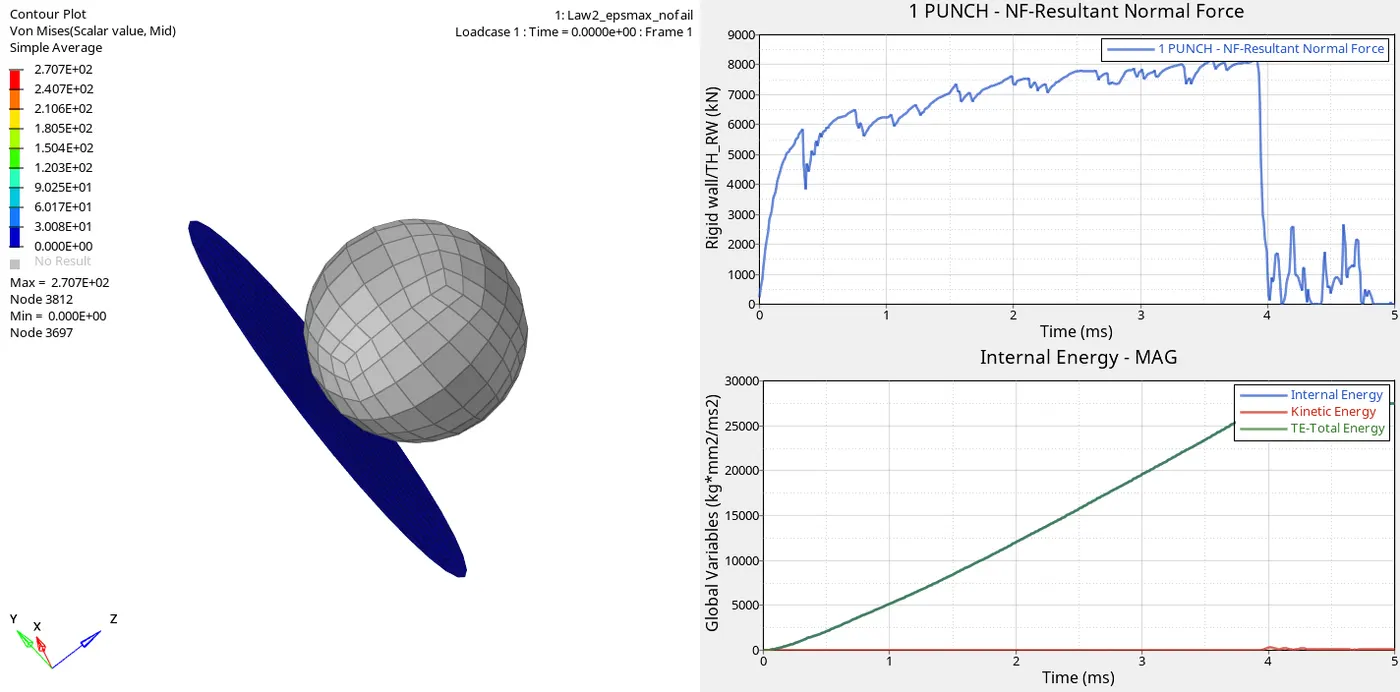
Fig: Total Plots
Case-4
Law2:
- Initially open the model by selecting the import option and load the file as Failure_Johnson_0000.rad and now the model will display. Now we want to delete the value of EPS_p_max in the same model in this case and to run the simulation. Here the value of EPS_p_max = 0 is shown as below,
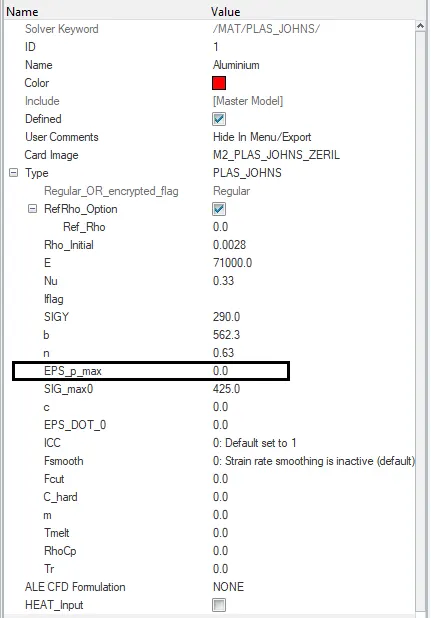
- Run the model and named it Law2. By selecting the option Analysis>radioss and select the folder to save the output of simulation and named the folder as Law2.
- In the analysis toolbar enter the option as -nt 4 to get better performance and results. Now select radioss option to run the simulation.

- After completion of the simulation, the output will be stored in that saved folder Law2 and open the output file Law2_0001.out we will obtain the energy error and mass error in that output that is shown below,

Fig: Energy error and Mass error
- The total number of cycles and the simulation time also noticed in that output and the values are shown below,
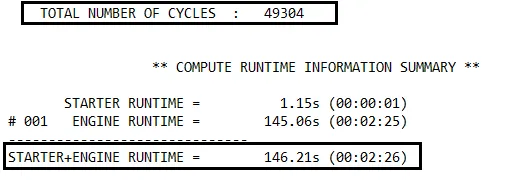
Fig: CycleTime
- Now we want to create the Vonmises stress Contour Plot by selecting the workspace as hyperview then load the model Law2.h3d and click apply. In hyperview we want to change some options like result type as Vonmises and averaging mode as simple. Therefore after changed the option and click apply to get Vonmises stress Contour Plot that is shown below,
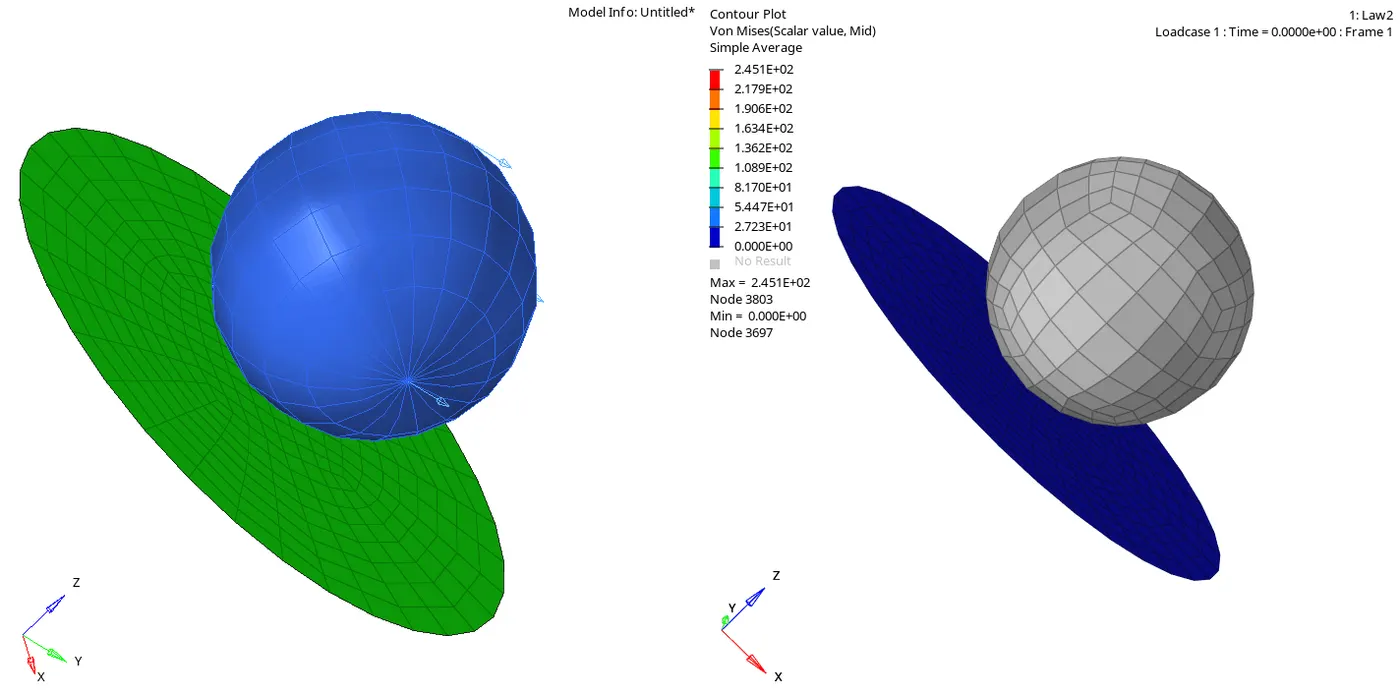
Fig: Open model with Vonmises stress Contour Plot
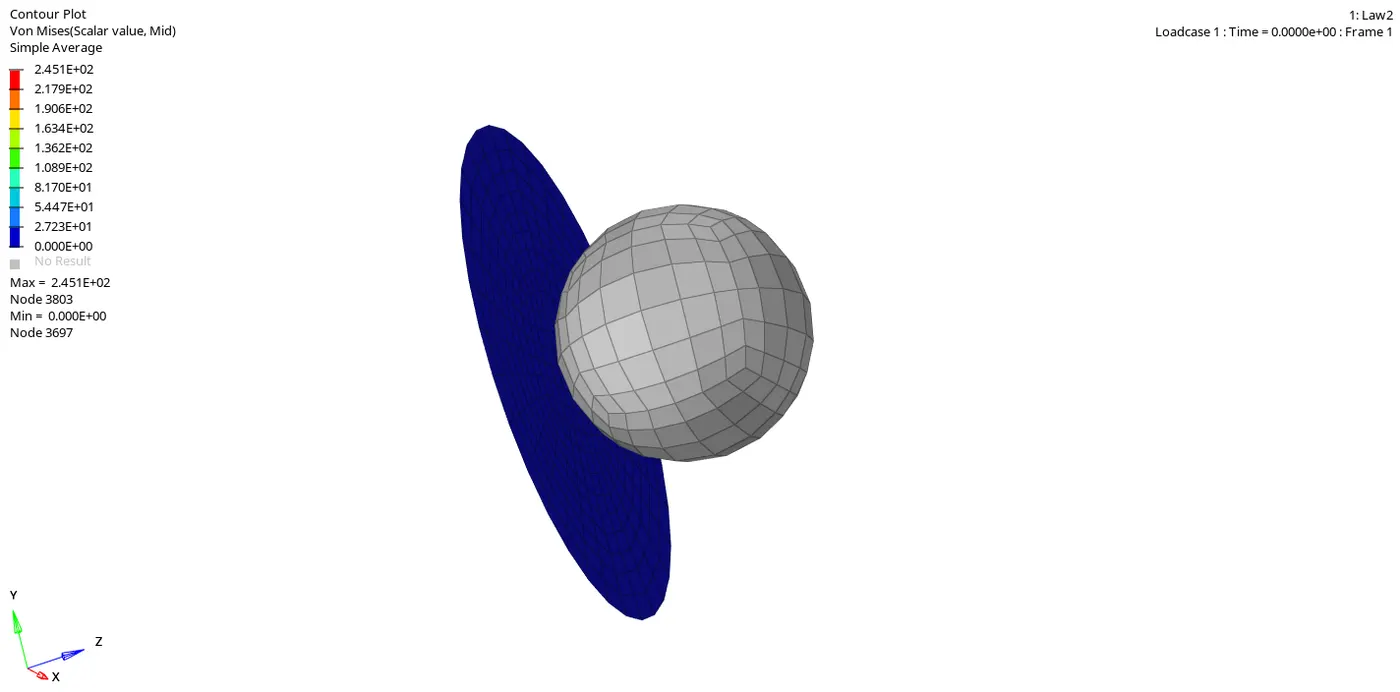
Fig: Vonmises stress Contour Plot
- Here above Von mises stress plot shows that the maximum value of stress is 2.451E+02Mpa and the minimum value of stress as 0 during the rigid ball crashed in the Aluminium plate.
- To create the plot for each energy and absorbs that what was happening during the crash and how could the element gets deforming while applying some force. Now select hyperchart option that will give the empty graph as a display. Import the file Law2T01 and click the apply option.
ENERGY PLOTS:
INTERNAL ENERGY:
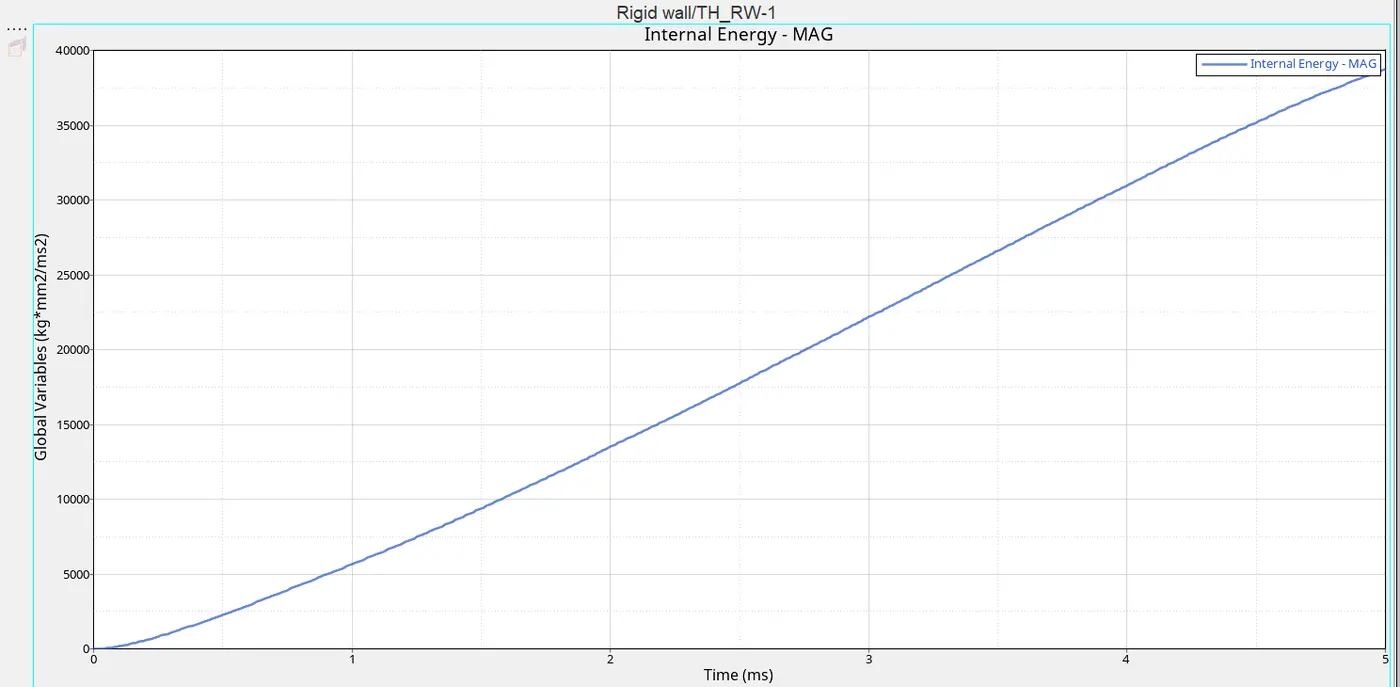
Fig: Internal Energy Plot
- This energy plot shows that increase in energy while the rigid ball crashed on the aluminium plate because of the contacts in the element it rises and after deformation of elements it will break and there is no contact between the elements then it flows constantly but in this state, we changed the EPS_p_max value as 0 then breakpoint should not be identified.
- There is no yield point in this state because we changed the value as EPS_p_max value like 0 then the element will break but not completely.
- Hence the graph shows an increase in energy level and it can't get constant because of the undefined yield point.
- It reaches above 39000kg*mm^2/ms^2 when the time of 5ms.
KINETIC ENERGY:
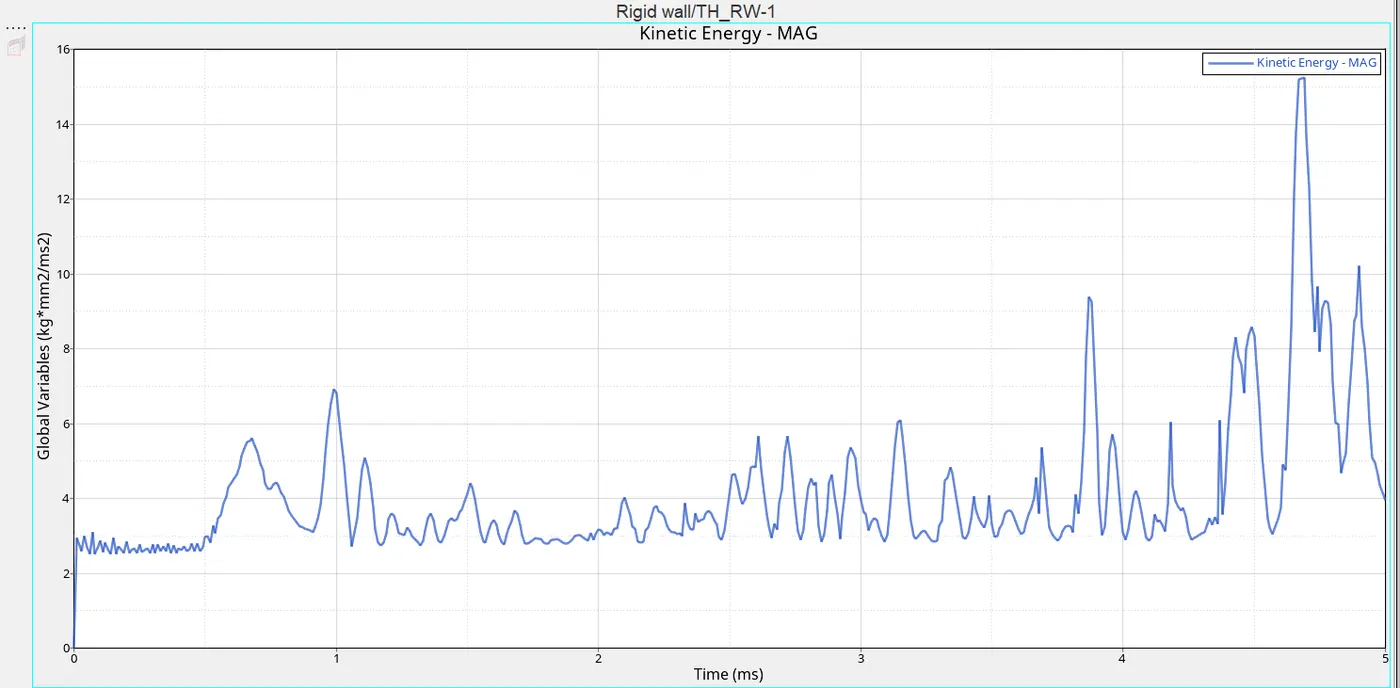
Fig: Kinetic Energy Plot
- In this energy, the plot shows that while the kinetic energy is acting between the rigid punch and the plate it keeps a constant flow of energy but it reaches the yield point of 16 kg*mm^2/ms^2 when the time of 4.8ms elements will break and there is no contact between the punch and the aluminium plate that case the sudden peak will appear.
- While we crashing the punch with the plate it creates some vibration due to stress acting on the body that is obtained in the kinetic energy plot. There should be a sudden peak is observed in this graph that point refers to the deletion of an element.
- After the deletion of the element, it will again decrease due to no contact between the punch and plate.
TOTAL ENERGY:
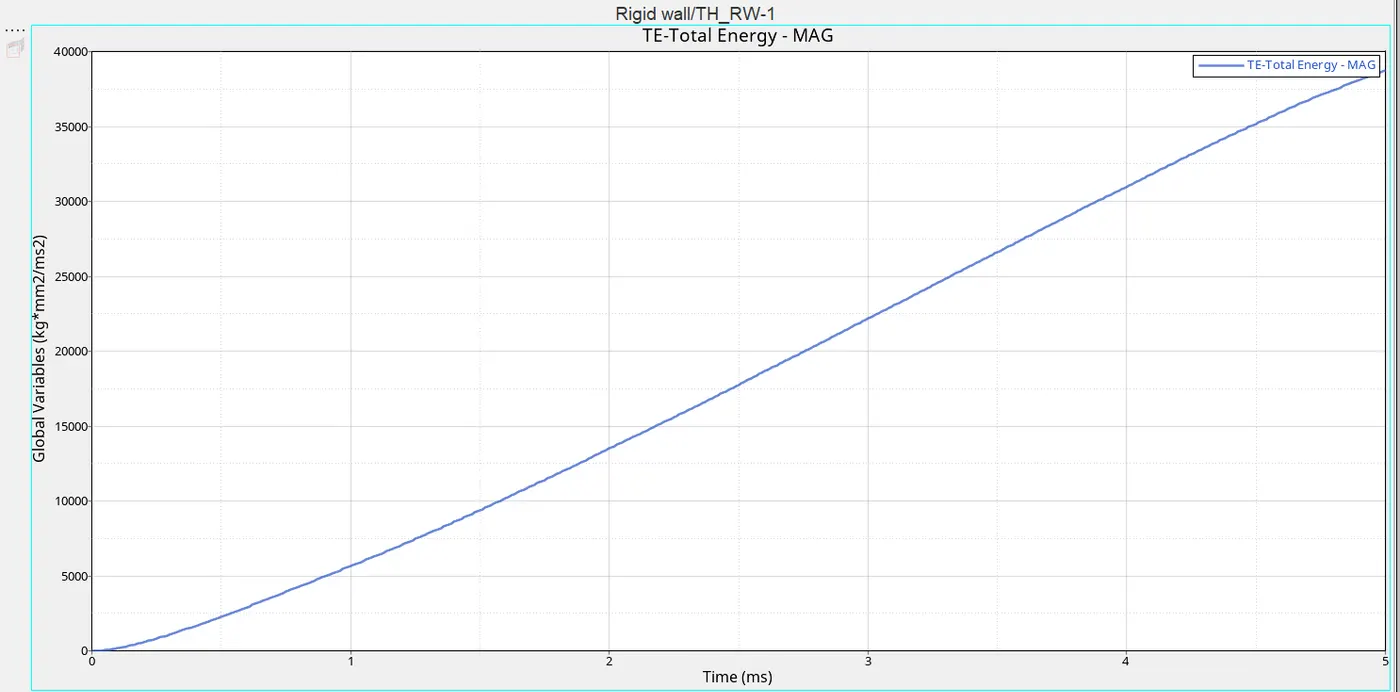
Fig: Total Energy Plot
- This energy plot shows the total energy acting when the rigid ball is crashed on the aluminium plate and that energy is represented as total energy = sum of internal energy and kinetic energy.
- In this graph, energy reaches above 38000 kg*mm^2/ms^2 at the time of 5 sec.
TOTAL PLOT:
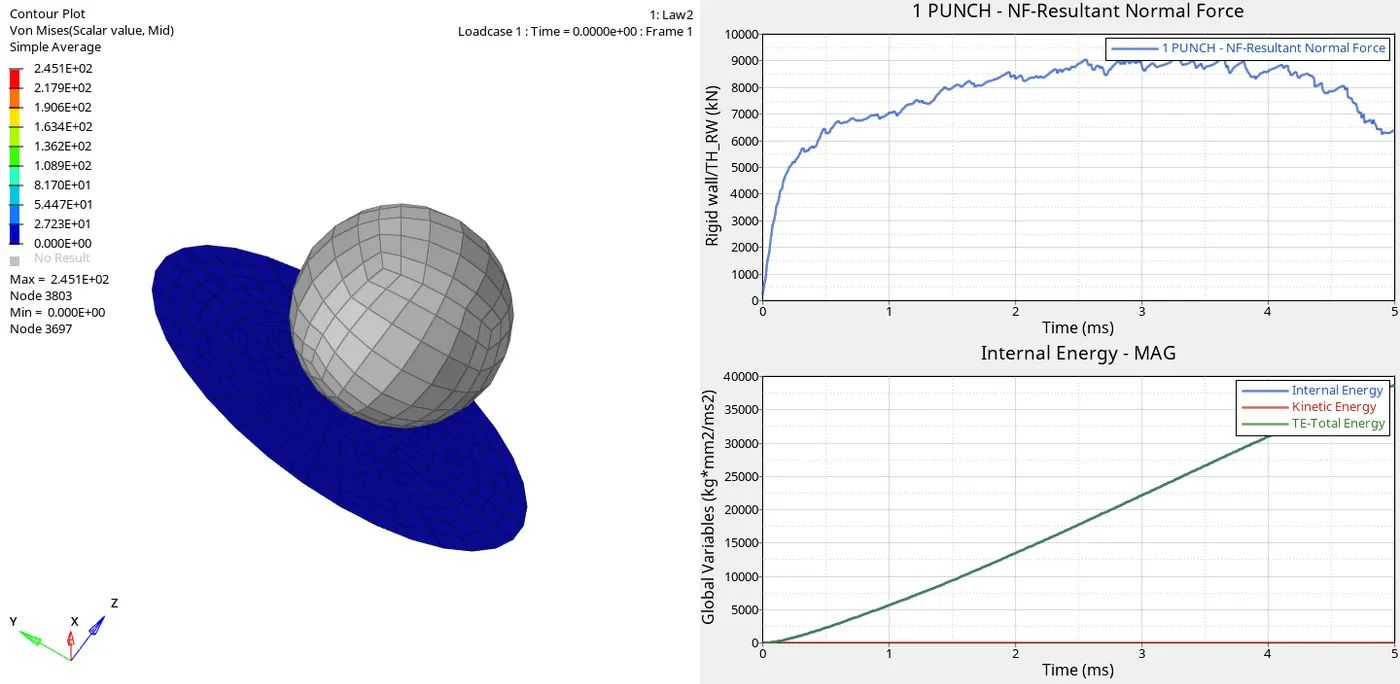
Fig: Total Plots
Case-5
M1_Elast:
- Initially open the model by selecting the import option and load the file as Failure_Johnson_0000.rad and now the model will display. Now convert the material model to Law1_Elastic with the same density, youngs modulus, and Poisson's ratio.
- Hence we want to create the new material by right-click the material card and click the create option. That created material box is shown as below,
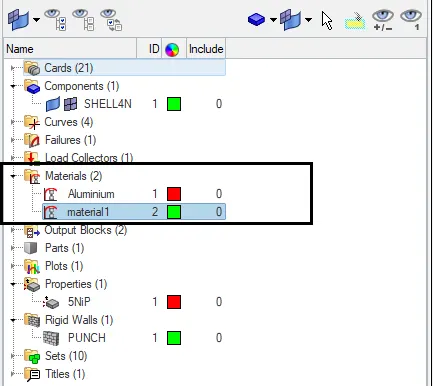
- Then select that material card for our simulation with the default value of that material. By confirming that material card select the material selection option and click a material-2 card for the changes in a material as Law1_elastic that are shown below,
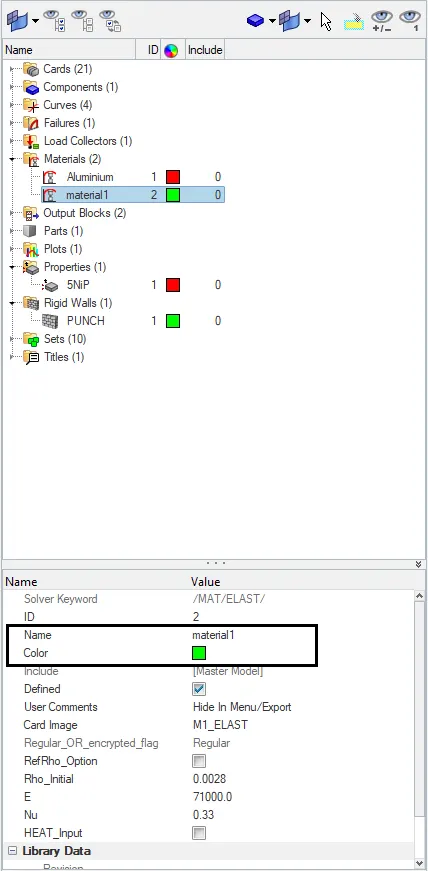
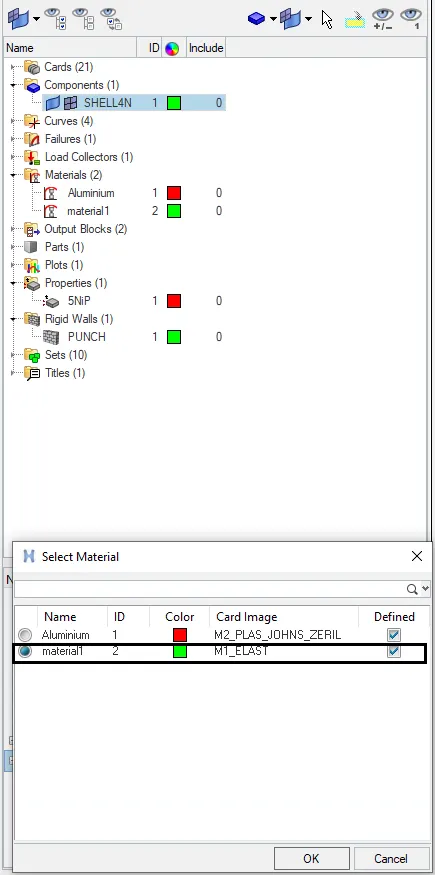
- Run the model and named it as Law1_elastic. By selecting the option Analysis>radioss and select the folder to save the output of simulation and named the folder as Law1_elastic.
- In the analysis toolbar enter the option as -nt 4 to get better performance and results. Now select radioss option to run the simulation.
- After completion of the simulation, the output will be stored in that saved folder Law1_elastic and open the output file Law2_0001.out we will obtain the energy error and mass error in that output that is shown below,

Fig: Energy error and Mass error
- The total number of cycles and the simulation time also noticed in that output and the values are shown below,
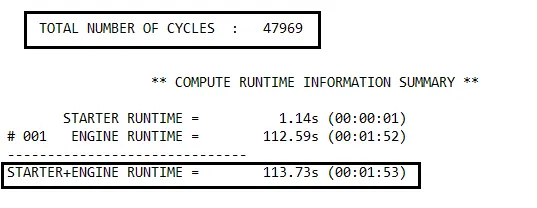
Now we want to create the Vonmises stress Contour Plot by selecting the workspace as hyperview then load the model Law1_elastic.h3d and click apply to obtain the model. In hyperview we want to change some options like result type as Vonmises and averaging mode as simple. Therefore after changed the option and click apply to get Vonmises stress Contour Plot that is shown below,
Fig: CycleTime
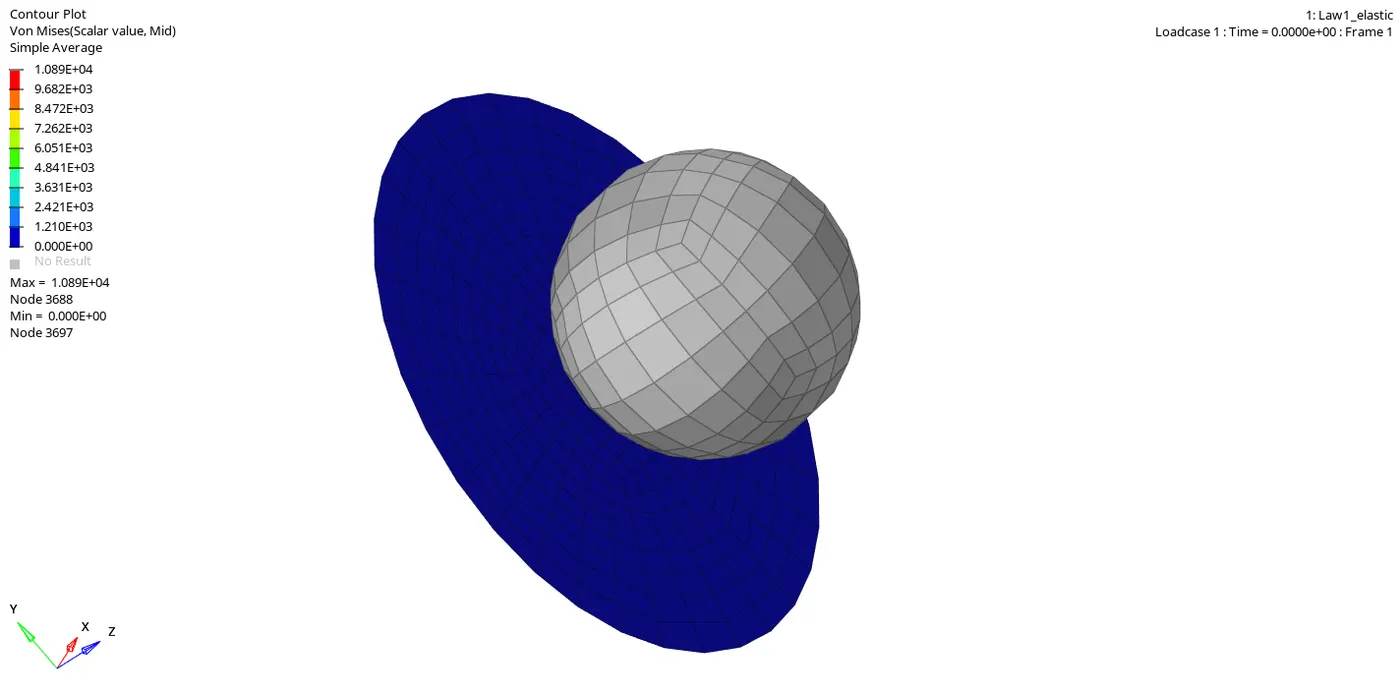
Fig: Vonmises stress Contour Plot
- Here above Von mises stress plot shows that the maximum value of stress is 1.089E+04Mpa and the minimum value of stress as 0 during the rigid ball crashed in the Aluminium plate.
ENERGY PLOTS:
INTERNAL ENERGY:
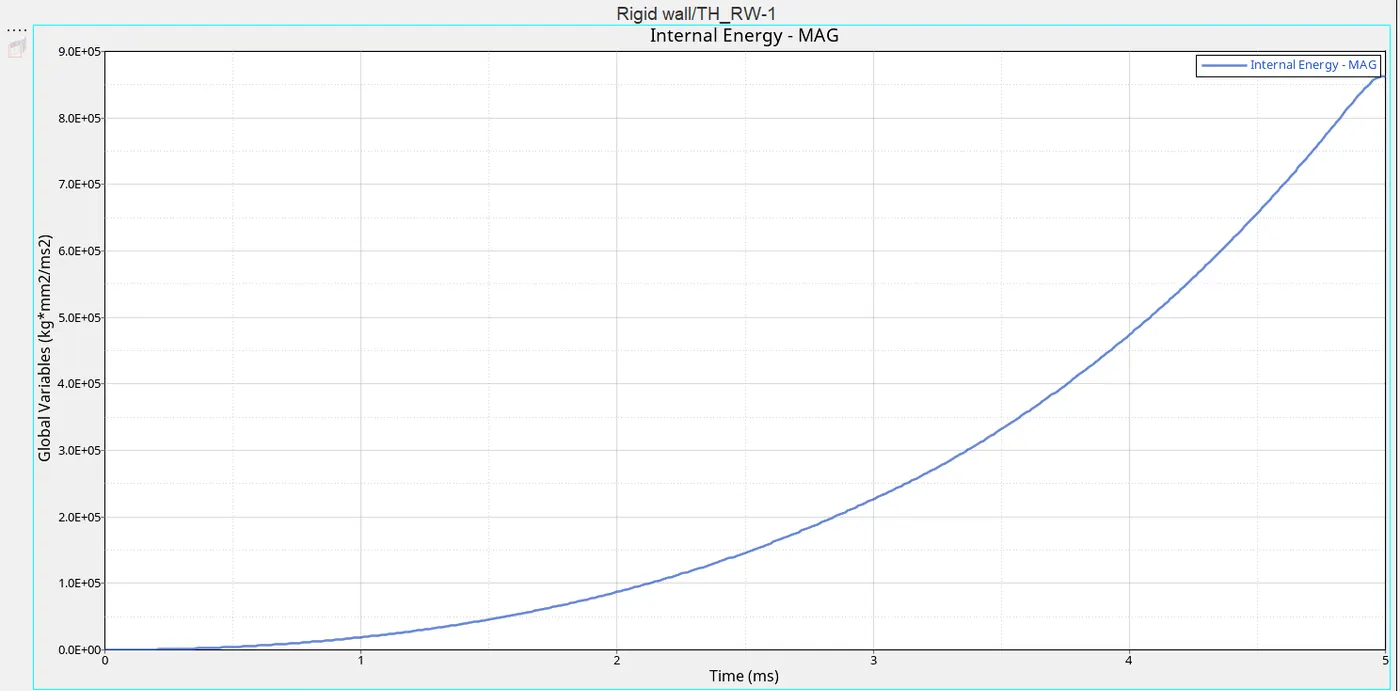
Fig: Internal Energy Plot
- This energy plot shows that increase in energy while the rigid ball crashed on the aluminium plate because of the contacts in the element it rises here the material of the plate is elastic so there is no deformation and break point is acted in this state.
- Hence the stress observed from the punch is acted along the body of the plate and the strain also adjusted so it will retain its original position.
- There is no yield point in this state because we changed the value as EPS_p_max value like 0 then the element will break but not completely.
- Therefore the graph shows an increase in energy level and it can't get constant because of the undefined yield point it will increase depends upon the stress applied on the rigid ball.
- It reaches 8.5E+05kg*mm^2/ms^2 when the time of 5ms.
KINETIC ENERGY:
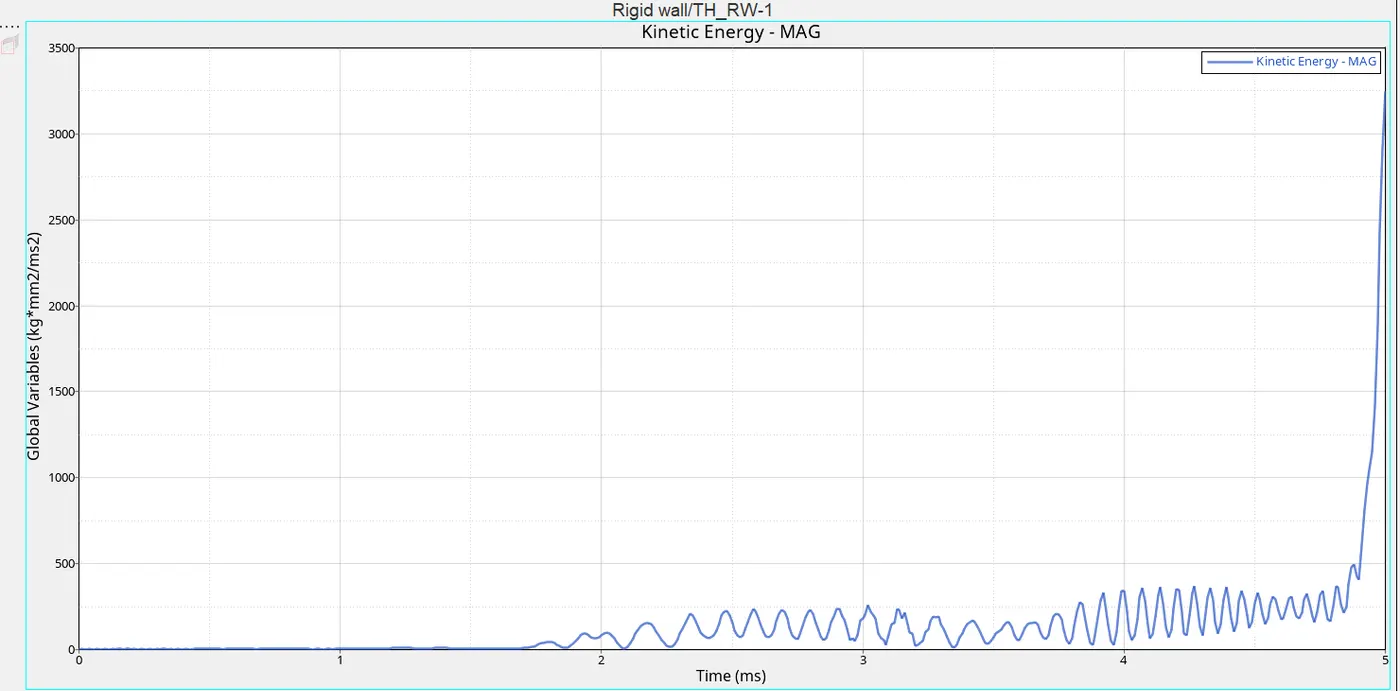
Fig: Kinetic Energy Plot
- This plot shows that while the kinetic energy is acting between the rigid punch and the plate it keeps a constant flow of energy but it reaches the maximum stress that formed an increase in energy of 3500kg*mm^2/ms^2 when the time of 5 ms.
- While we crashing the punch with the plate it creates some vibration due to stress acting on the body that is obtained in the kinetic energy plot. There should be a sudden peak is observed in this graph because after reaches the maximum stress the strain acted on the plate and it will impact the rise in energy at that point.
TOTAL ENERGY:
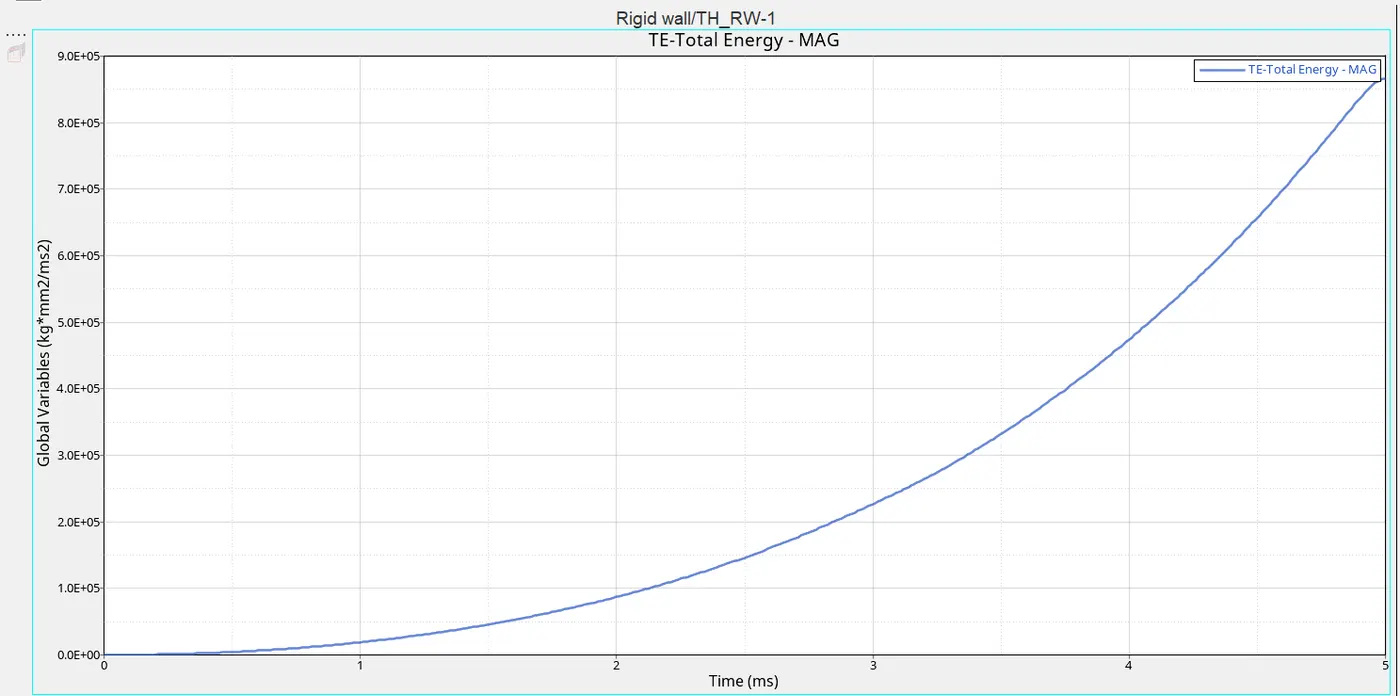
Fig: Total Energy Plot
- This energy plot shows the total energy acting when the rigid ball is crashed on the aluminium plate and that energy is represented as total energy = sum of internal energy and kinetic energy.
- In this graph, energy reaches above 8.5E+05 kg*mm^2/ms^2 at the time of 5 sec.
TOTAL PLOTS:
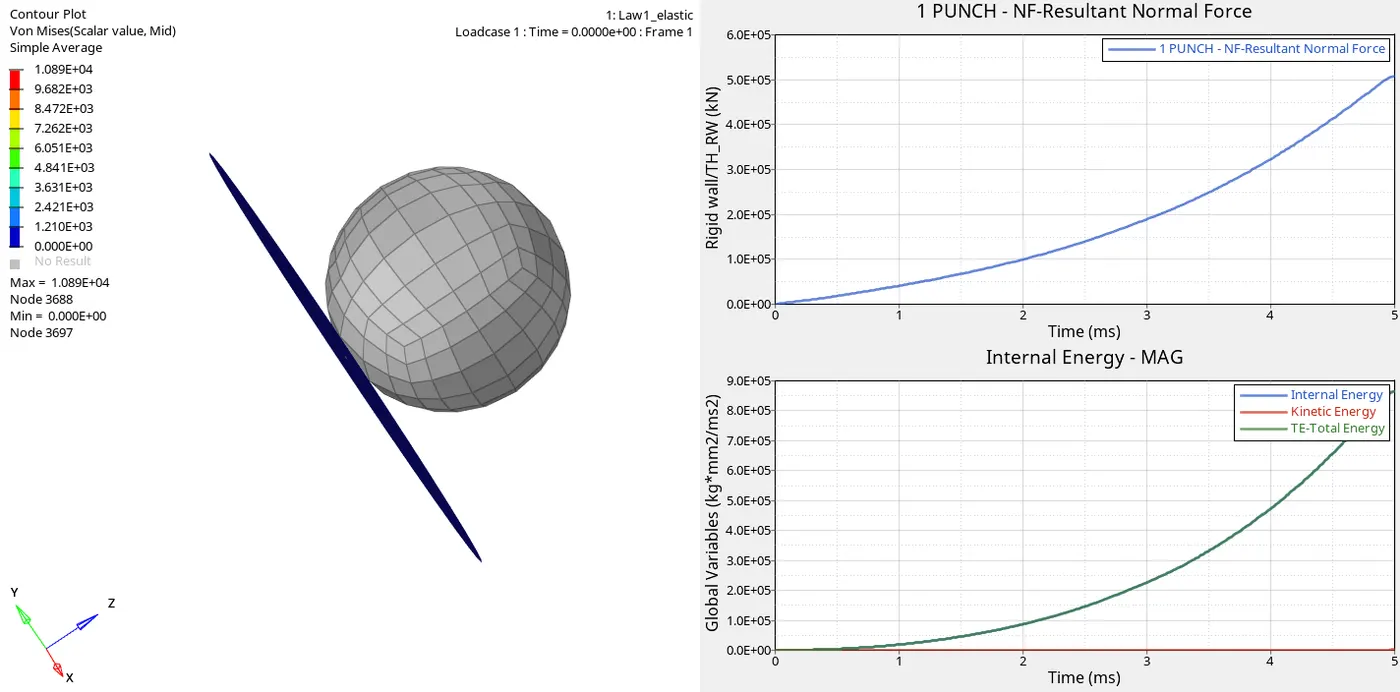
Fig: Total Plots
Case-6
Law_27:
- Initially open the model by selecting the import option and load the file as Law27_0000.rad and now the model will display. Now change the shell properties as they mentioned by recommended shell properties.
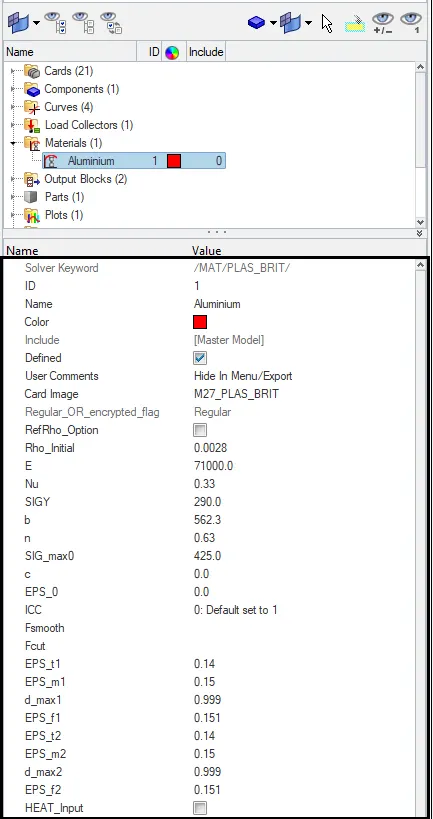
- Run the model as it is without changing any material and failure card notice the material card johnson cook parameters but different values for Eps based failure and named it as Law27. By selecting the option Analysis>radioss and select the folder to save the output of simulation and named the folder as Law27. Hence the material card for Law27 is shown as below,
- In the analysis toolbar enter the option as -nt 4 to get better performance and results. Now select radioss option to run the simulation.
- After completion of the simulation, the output will be stored in that saved folder Law2_epsmax_failure and open the output file Law27_0001.out we will obtain the energy error and mass error in that output that is shown as below,

Fig: Energy error and Mass error
- The total number of cycles and the simulation time also noticed in that output and the values are shown below,
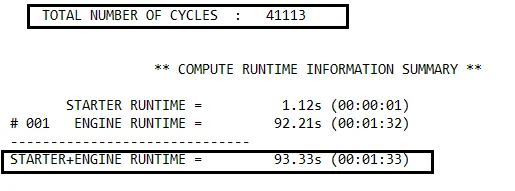
Fig: CycleTime
- Now we want to create the Vonmises stress Contour Plot by selecting the workspace as hyperview then load the model Law27.h3d and click apply to obtain the model. In hyperview we want to change some options like result type as Vonmises and averaging mode as simple. Therefore after changed the option and click apply to get Vonmises stress Contour Plot that is shown below,
Fig: Open model with Vonmises stress Contour Plot
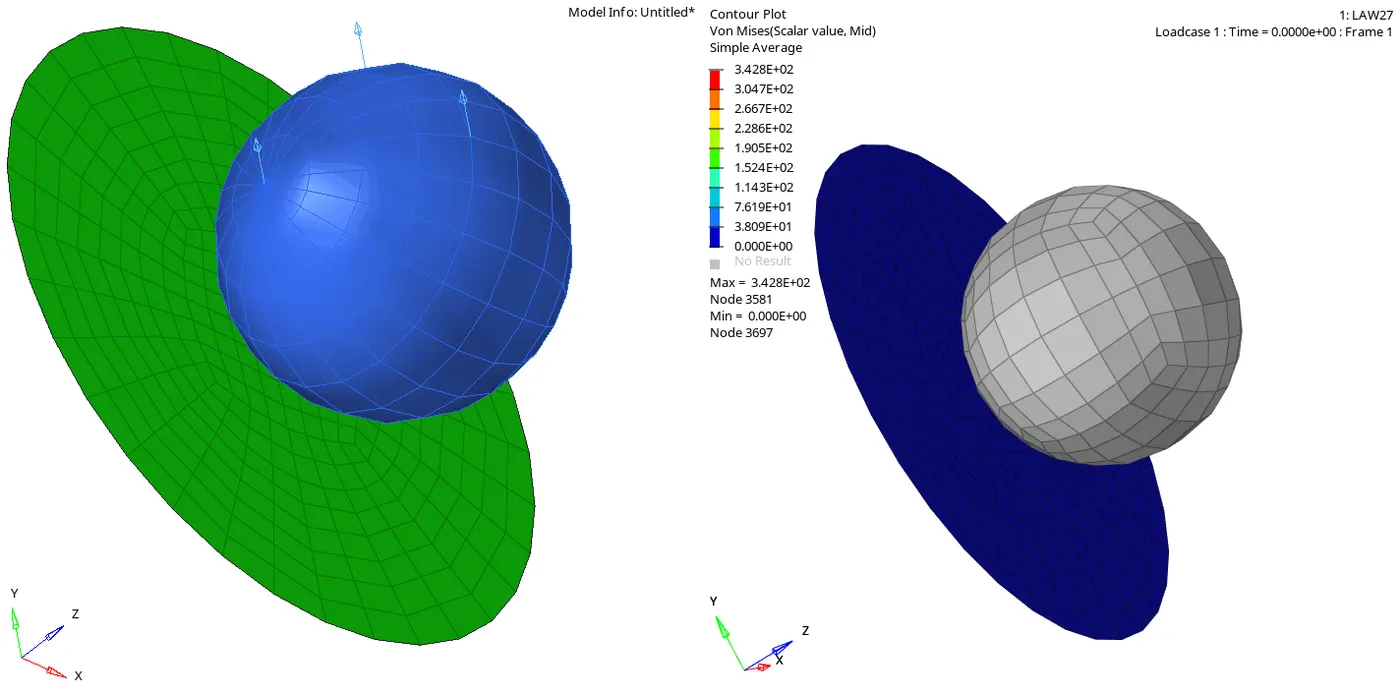
- Here above Von mises stress plot shows that the maximum value of stress is 3.428E+04Mpa and the minimum value of stress as 0 during the rigid ball crashed in the Aluminium plate.
ENERGY PLOTS:
INTERNAL ENERGY:
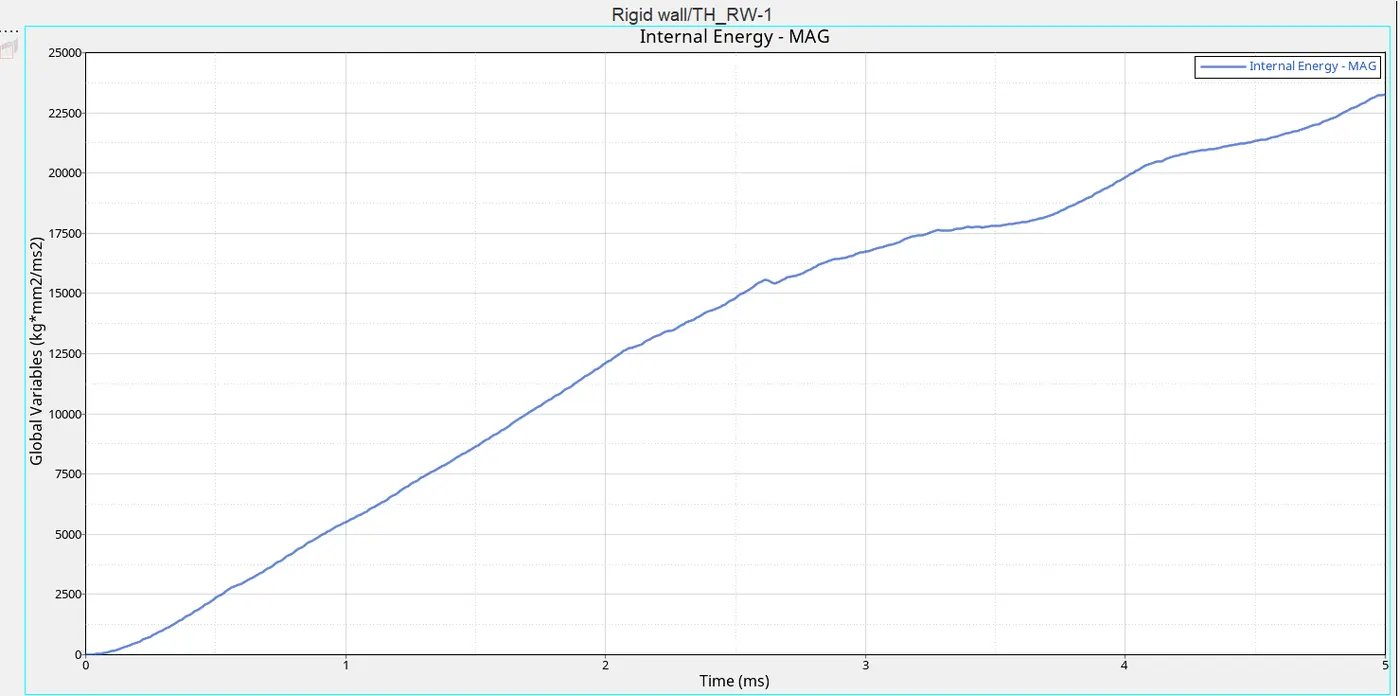
Fig: Internal Energy Plot
- This energy plot shows that increase in energy while the rigid ball crashed on the aluminium plate it will break by a bond of elements, not an individual element in this case because this material law27 is considered as the brittle component.
- Hence the yield point or brittle state of the plate is identified in that graph as the peak point after the breakage of the element it will flow constant that may depend on the time of the running simulation.
- In this graph, the internal energy reaches above 22500kg*mm^2/ms^2 when the time of 5ms.
KINETIC ENERGY:
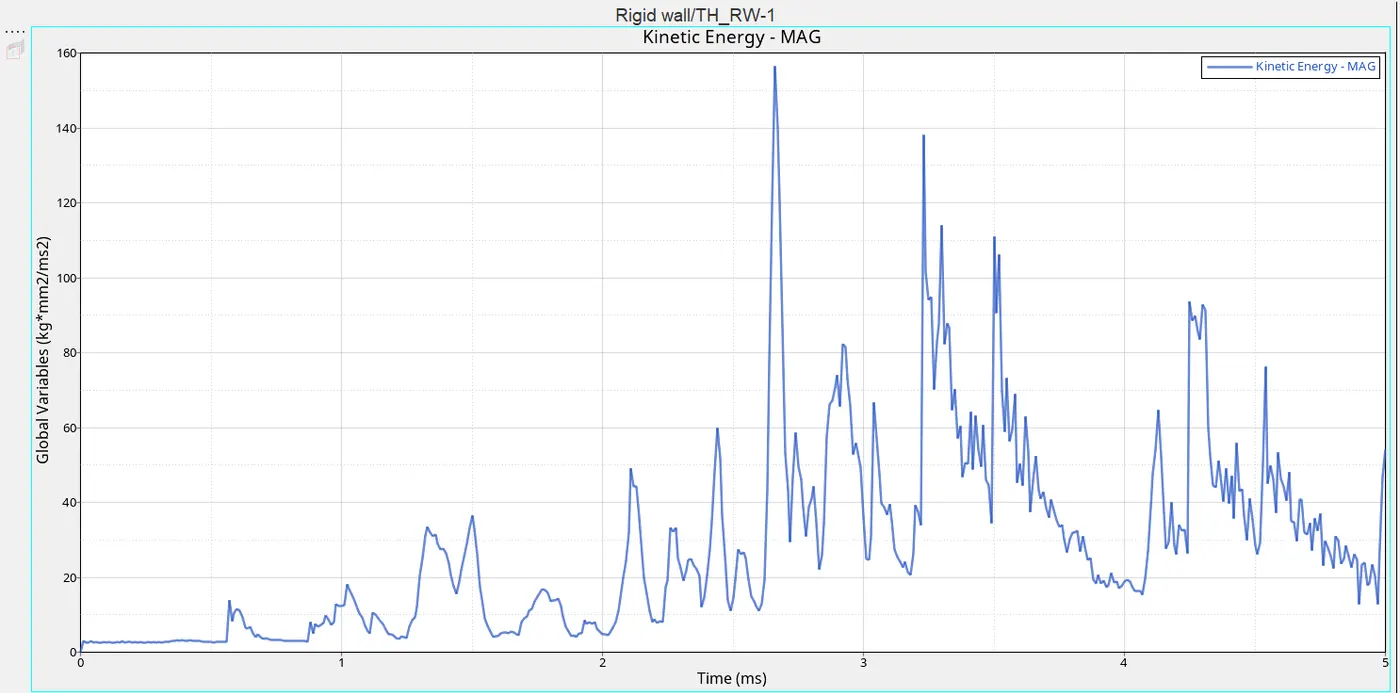
Fig: Kinetic Energy Plot
- This plot shows that while the kinetic energy is acting between the rigid punch and the plate it gives variation in the flow of energy due to the stress is acting on the plate when it reaches the maximum stress that formed an increase in energy sudden peak is acted of 150 kg*mm^2/ms^2 when the time of 2.8 ms and then the kinetic energy is reduced again.
- While we crashing the punch with the plate it creates some vibration due to stress acting on the body that is obtained in the kinetic energy plot. There should be a sudden peak is observed in this graph because after reaches the maximum stress the strain acted on the plate and it will impact the rise in energy at that point.
TOTAL ENERGY:
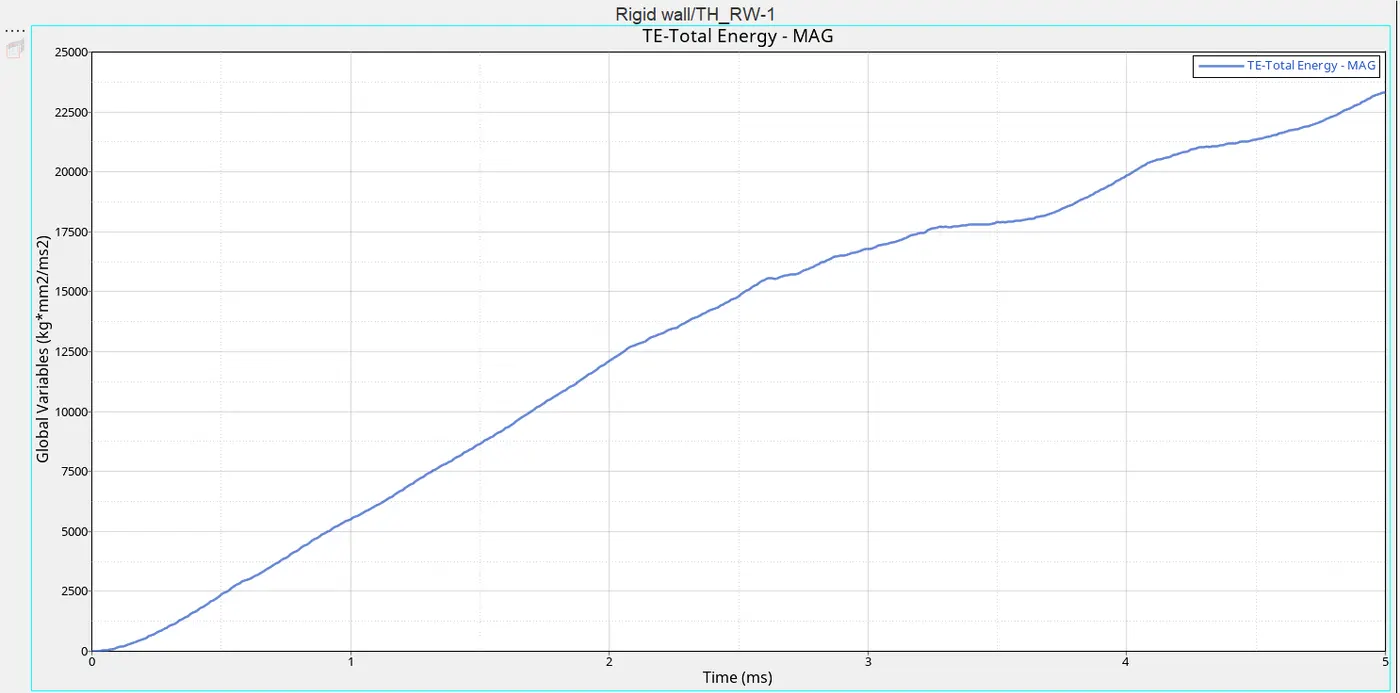
Fig: Total Energy Plot
- This energy plot shows the total energy acting when the rigid ball is crashed on the aluminium plate and that energy is represented as total energy = sum of internal energy and kinetic energy.
- In this graph, energy reaches above 22500 kg*mm^2/ms^2 at the time of 5 sec.
TOTAL PLOTS:
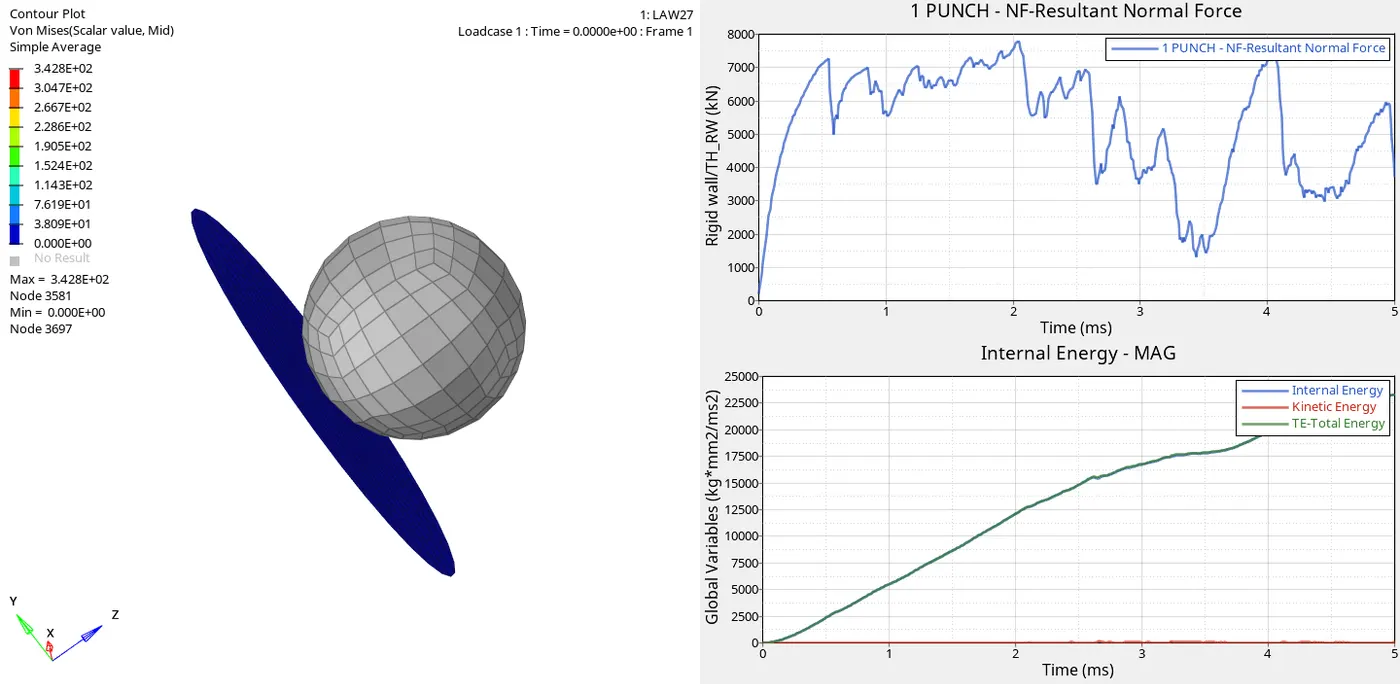
Fig: Total Plots
Case-7
Law36:
- Initially open the model by selecting the import option and load the file as Failure_Johnson_0000.rad and now the model will display. Then we want to create the new material by right click the material card and click the create option.
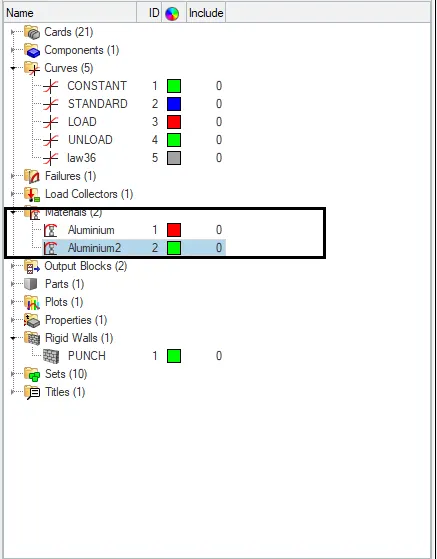
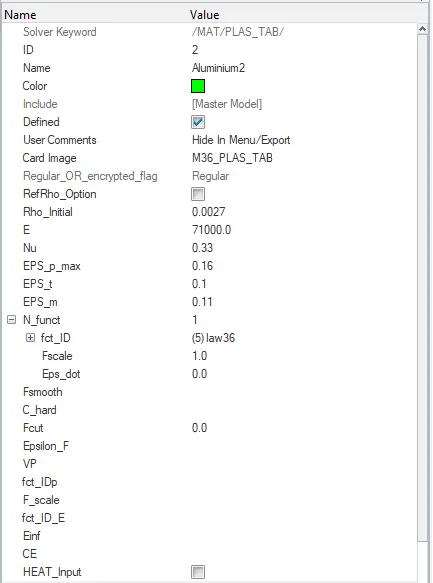
- Now change the card image as M36_PLAST_TAB and enter the values for that card as per the instructor given in the material-7 video. The value changed material card is shown as below,
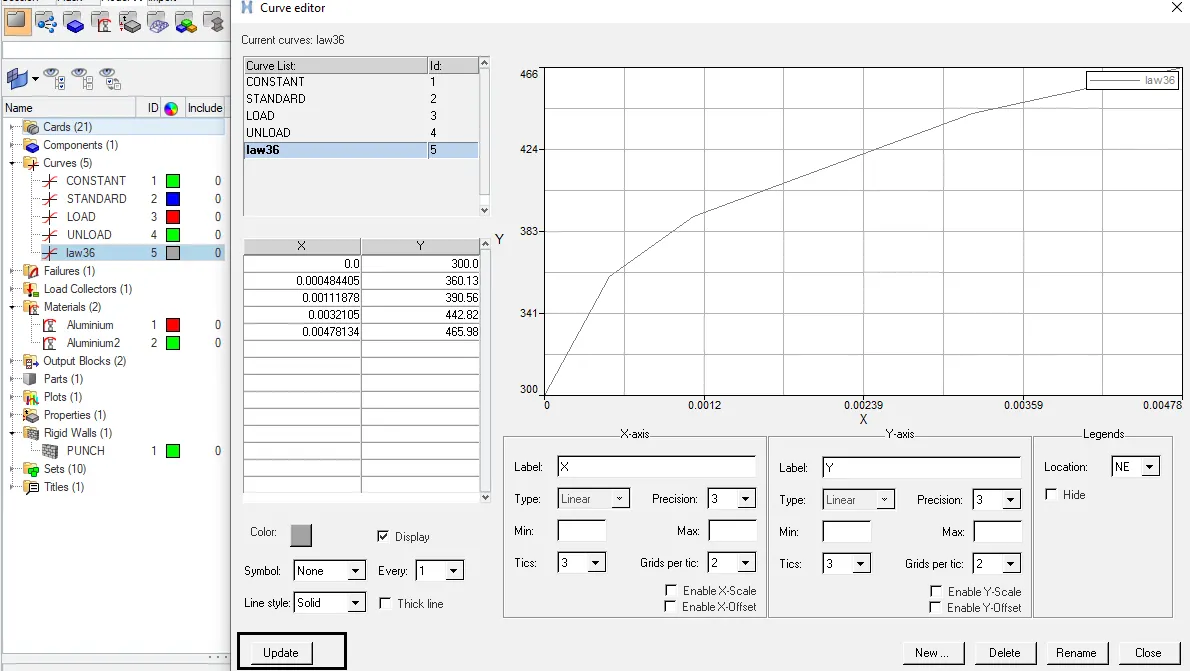
- In this case, we want to create the stress-strain curve by an input in all above 6 cases the stress-strain curve is calculated by the value of input like, youngs modulus, density, and Poisson's ratio, etc but here the curve is created by using create>curve option and enter the X, Y value as per the material-7 video and select the curve for simulation by clicking the update option. The stress-strain curve for this simulation is given below,
- Run the model after changed the values of the material card and named it as Law36. By selecting the option Analysis>radioss and select the folder to save the output of simulation and named the folder as Law36.
- In the analysis toolbar enter the option as -nt 4 to get better performance and results. Now select radioss option to run the simulation.
- After completion of the simulation, the output will be stored in that saved folder Law36 and open the output file Law36_0001.out we will obtain the energy error and mass error in that output that is shown as below,

Fig: Energy error and Mass error
- The total number of cycles and the simulation time also noticed in that output and the values are shown below,
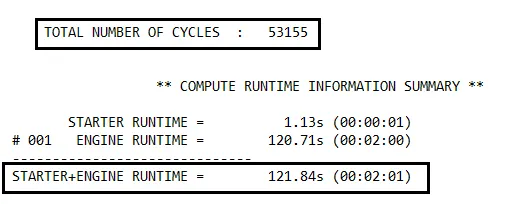
Fig: CycleTime
- Now we want to create the Vonmises stress Contour Plot by selecting the workspace as hyperview then load the model Law36.h3d and click apply to obtain the model. In hyperview we want to change some options like result type as Vonmises and averaging mode as simple. Therefore after changed the option and click apply to get Vonmises stress Contour Plot that is shown below,
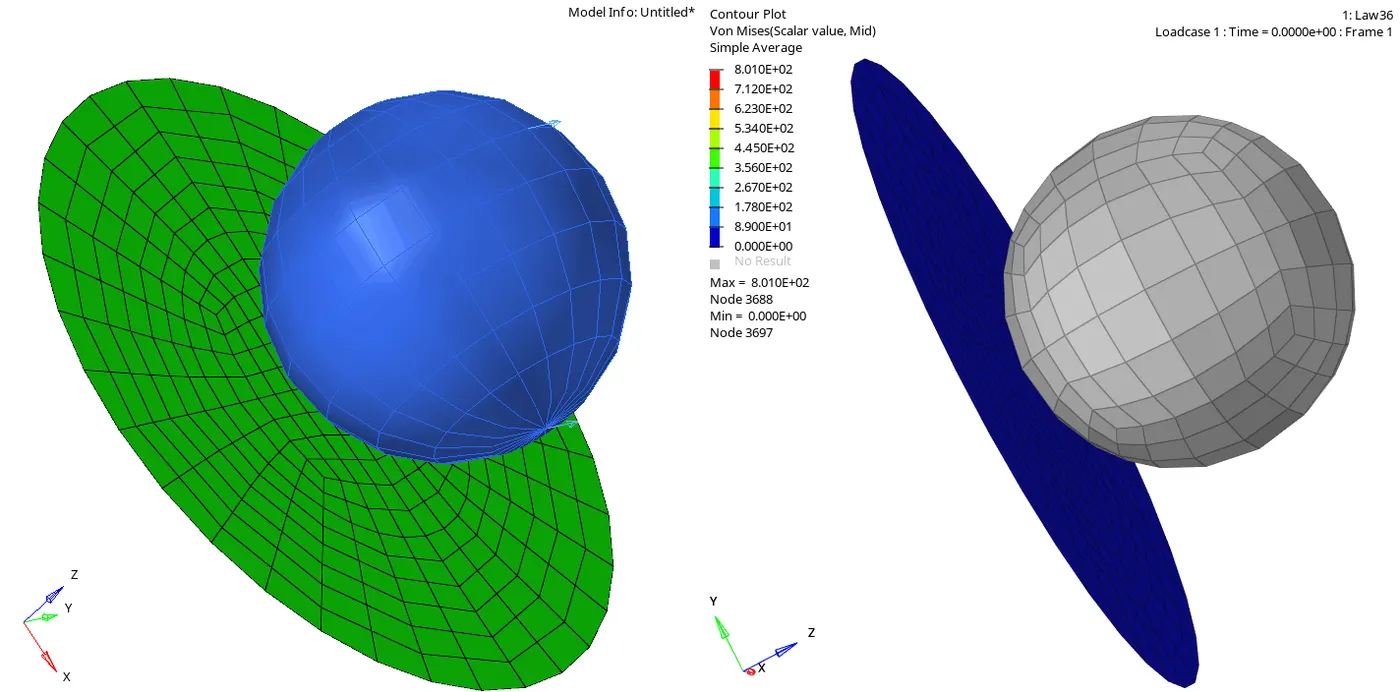
Fig: Open model with Vonmises stress Contour Plot
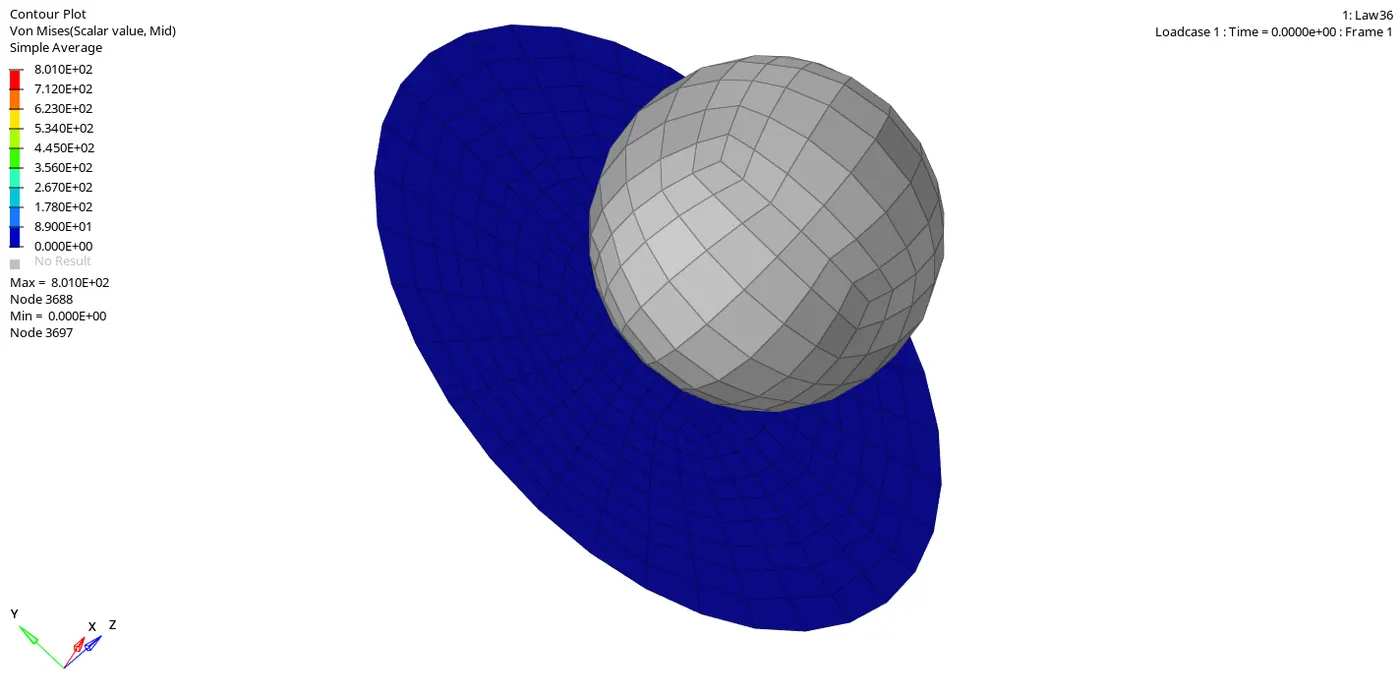
Fig: Vonmises stress Contour Plot
- Here above Von mises stress plot shows that the maximum value of stress is 8.010E+02Mpa and the minimum value of stress as 0 during the rigid ball crashed in the Aluminium plate.
INTERNAL ENERGY:
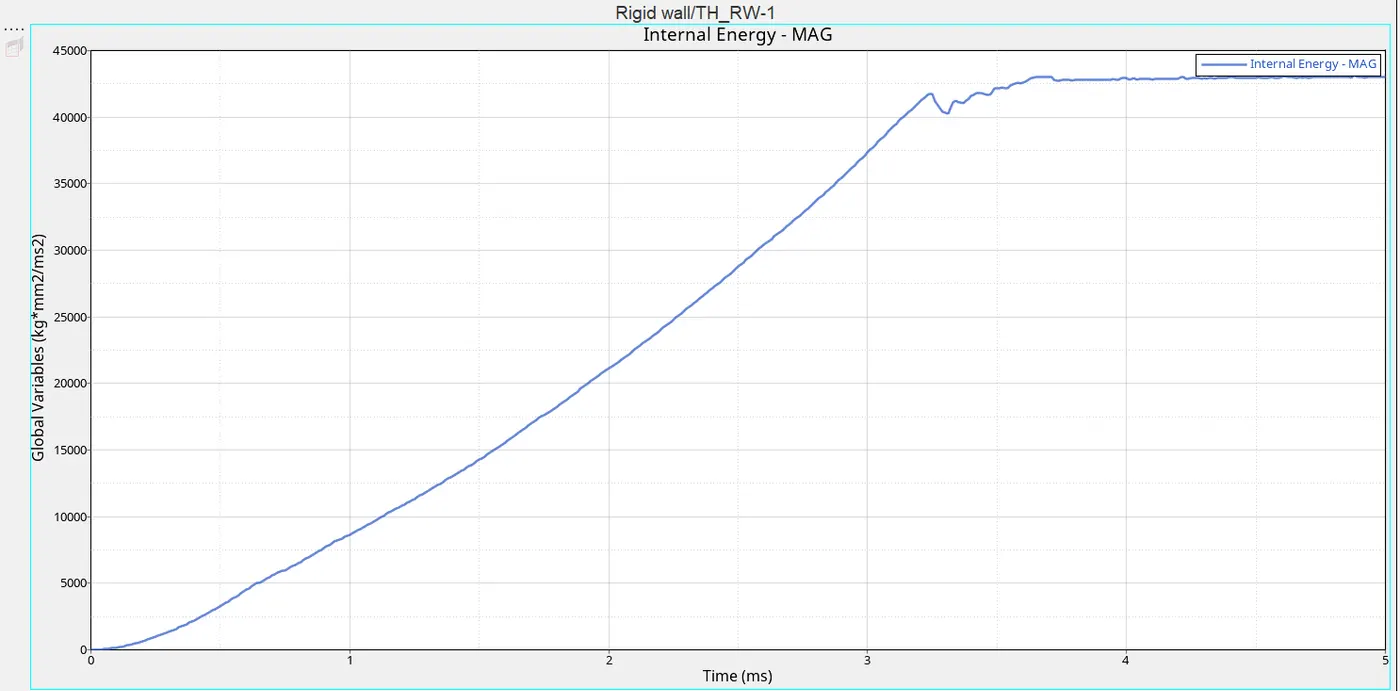
Fig: Internal Energy Plot
- In this plot, the observing results are obtained by the input stress-strain curve data that are considered as experimental stress-strain values of this case. It gives the deformation value of the element and the yield point of the plate.
- This energy plot shows that increase in energy while the rigid ball crashed on the aluminium plate because of the contacts in the element it rises and after deformation of elements it will break and there is no contact between the elements then it flows constantly.
- While the deletion of elements there will be a small impact on the graph and after that graph flows constantly.
- It reaches above 40000kg*mm^2/ms^2 when the time of 3.4ms and after that elements in the plate is deleted and remain constant.
KINETIC ENERGY:
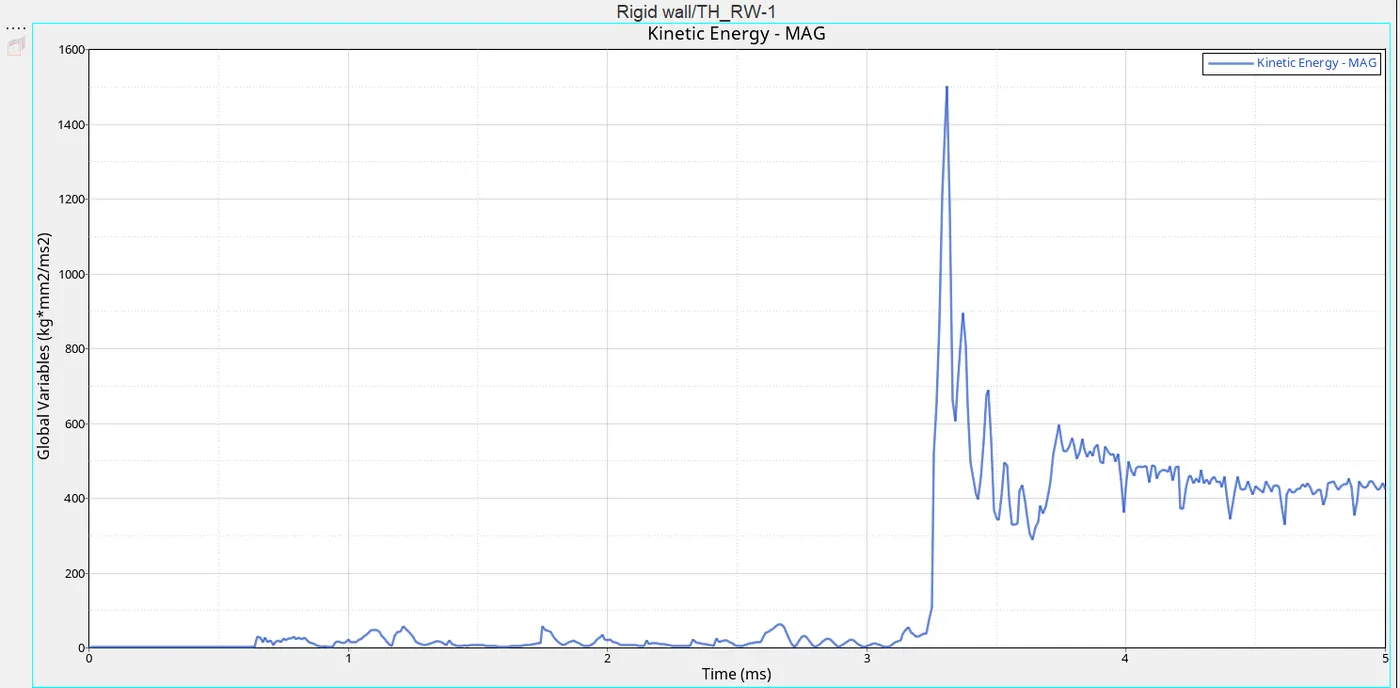
Fig: Kinetic Energy Plot
- This plot shows that while the kinetic energy is acting between the rigid punch and the plate it gives variation in the flow of energy due to the stress is acting on the plate when it reaches the maximum stress that formed an increase in energy sudden peak is acted of 1500 kg*mm^2/ms^2 when the time of 3.4 ms and then the kinetic energy is reduced again.
- While we crashing the punch with the plate it creates some vibration due to stress acting on the body that is obtained in the kinetic energy plot. There should be a sudden peak is observed in this graph because after reaches the maximum stress the strain acted on the plate and it will impact the rise in energy at that point.
TOTAL ENERGY:
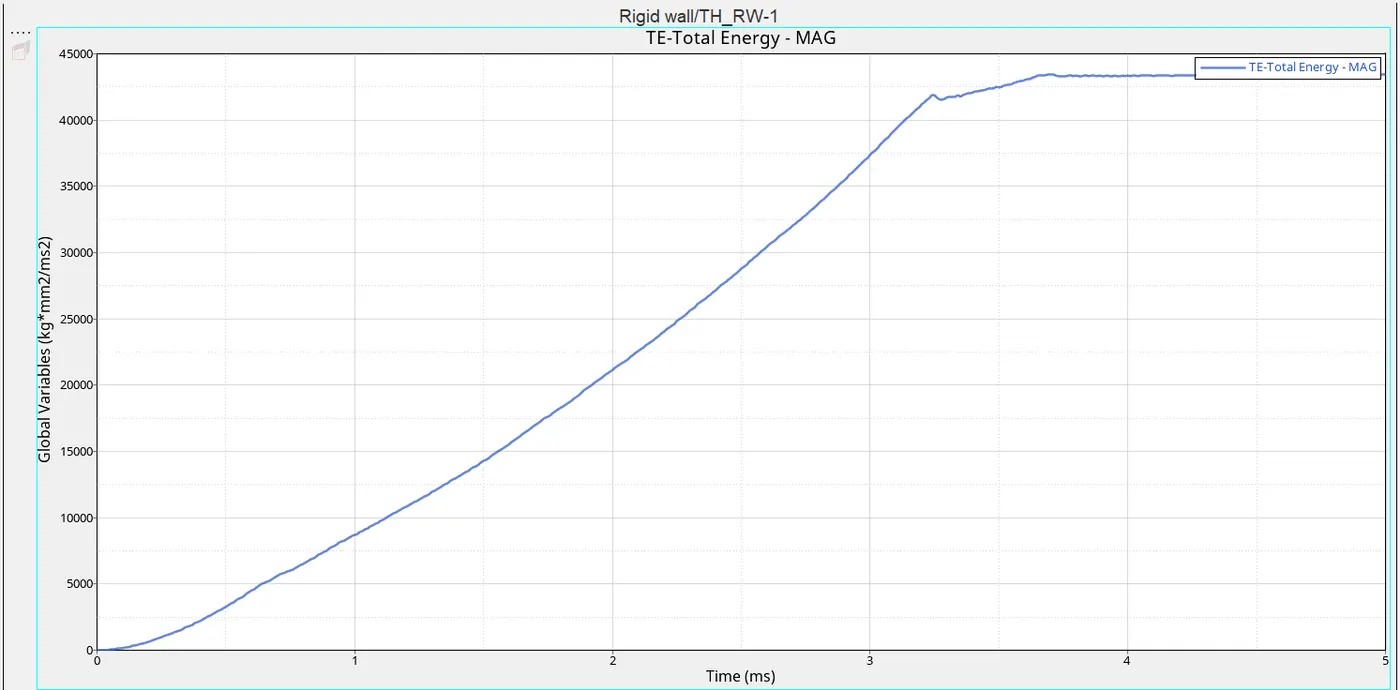
Fig: Total Energy Plot
- This energy plot shows the total energy acting when the rigid ball is crashed on the aluminium plate and that energy is represented as total energy = sum of internal energy and kinetic energy.
- In this graph, energy reaches above 42000 kg*mm^2/ms^2 at the time of 3.5 sec.
TOTAL PLOTS
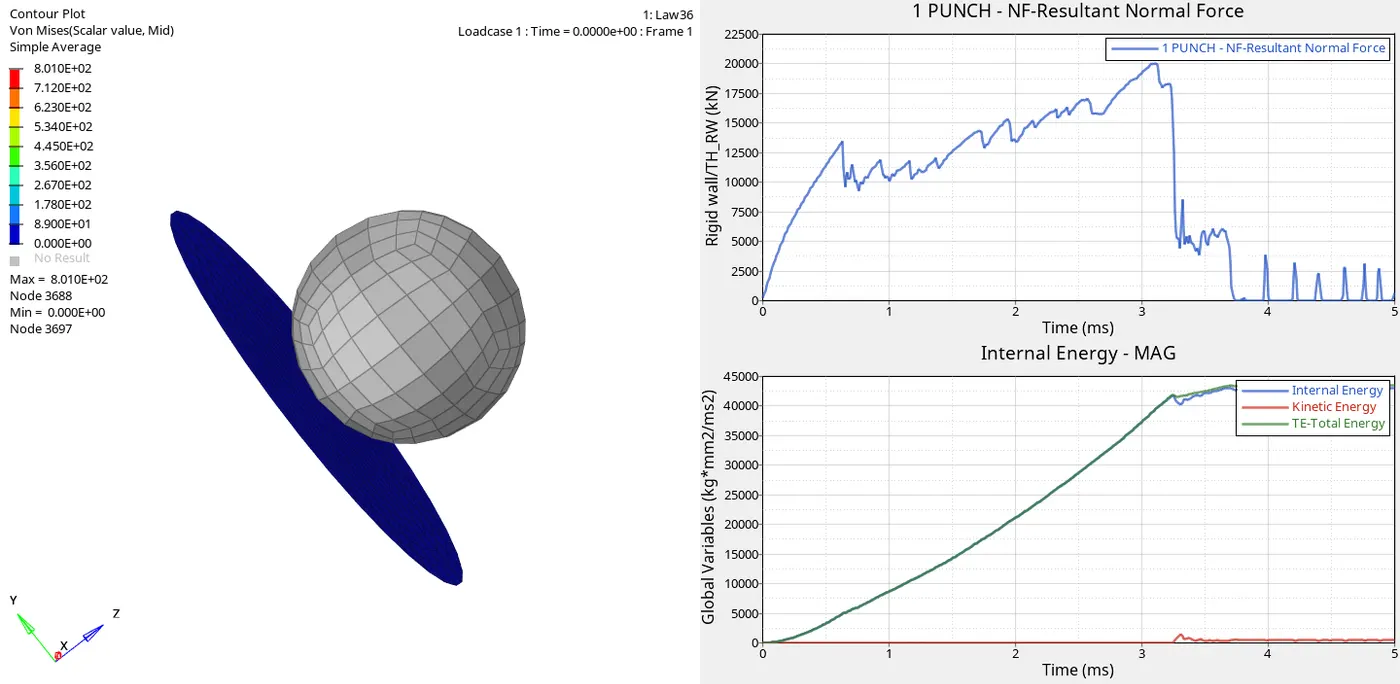
Fig: Total Plots
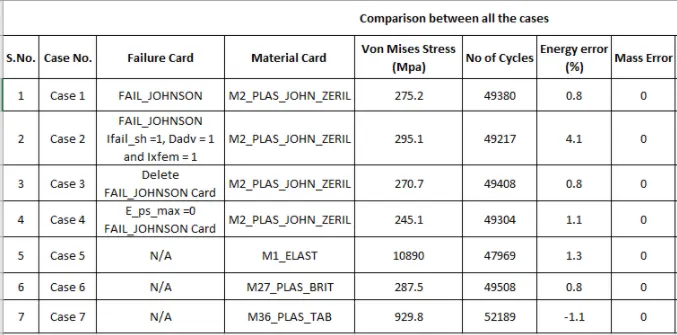
COMPARISON OF ALL 7 CASES:
EPSmax_failure V/S EPSmax_crack:
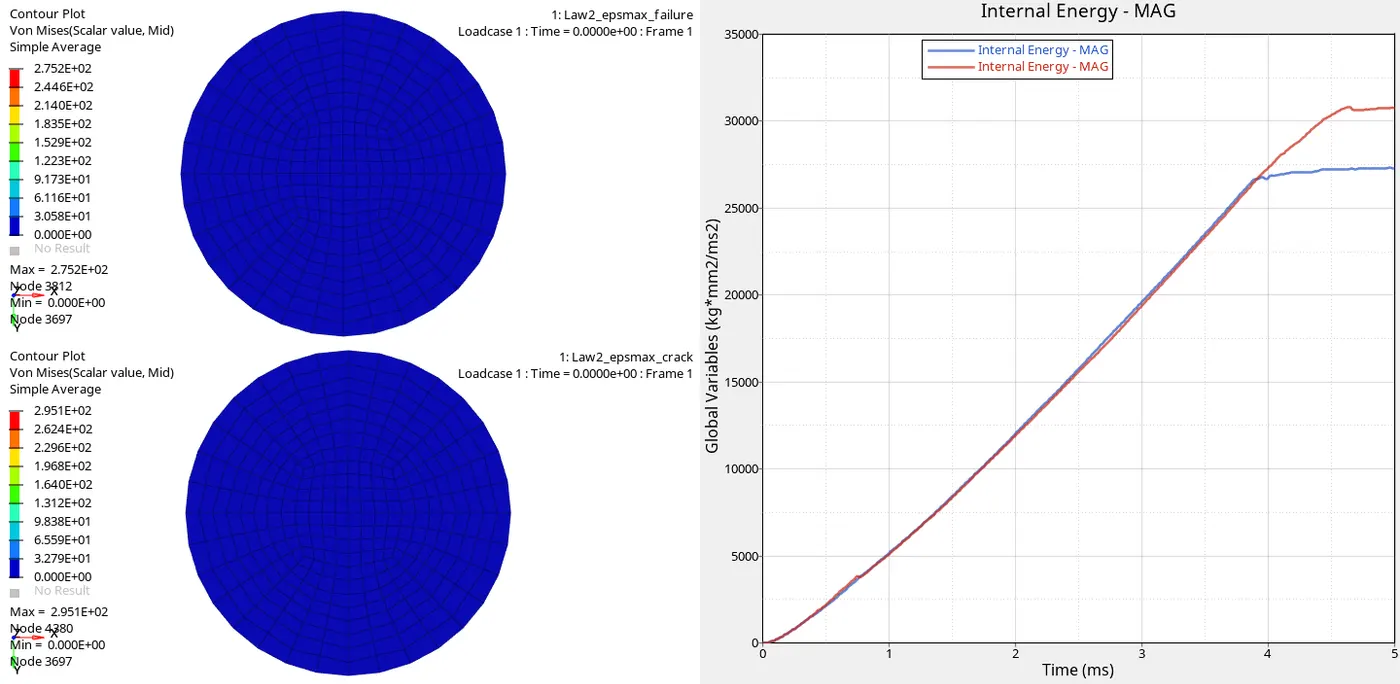
Fig: EPSmax_failure V/S EPSmax_crack
- By comparing the two cases in case 1 we run the FAILURE_JOHNSON simulation as the default values and obtain the plots for internal energy, kinetic energy, and total energy. But in case-2 we changed the failure card as ifail_sh = 1, Dadv = 1, and ixfem = 1 and observe the results as three plots like internal energy, kinetic energy, and total energy.
- In both cases, we saw that the more variation in internal energy case-1 internal energy reaches above 25000kg*mm^2/ms^2 when the time of 3.8ms and after those elements in the plate is deleted and remains constant. Whereas in case-2 internal energy reaches above 30000kg*mm^2/ms^2 when the time of 4.5ms and after those elements in the plate is deleted and remains constant.
- In case-1 Von mises stress plot shows that the maximum value of stress is 2.752E+02Mpa and the minimum value of stress as 0 during the rigid ball crashed in the Aluminium plate and in case-2 Von mises stress plot shows that the maximum value of stress is 2.951E+02Mpa and the minimum value of stress as 0 during the rigid ball crashed in the Aluminum plate.
- These variations of energy plot show that the deformation of an element takes place in case-1 is early compare with the case-2. A crack advancement is increased in case-2 because of changed the failure card value that will help to increase the capacity of stiffness so the element deformation and deletion are taken longer than the case-1.
EPSmax_nofail V/S Law2:
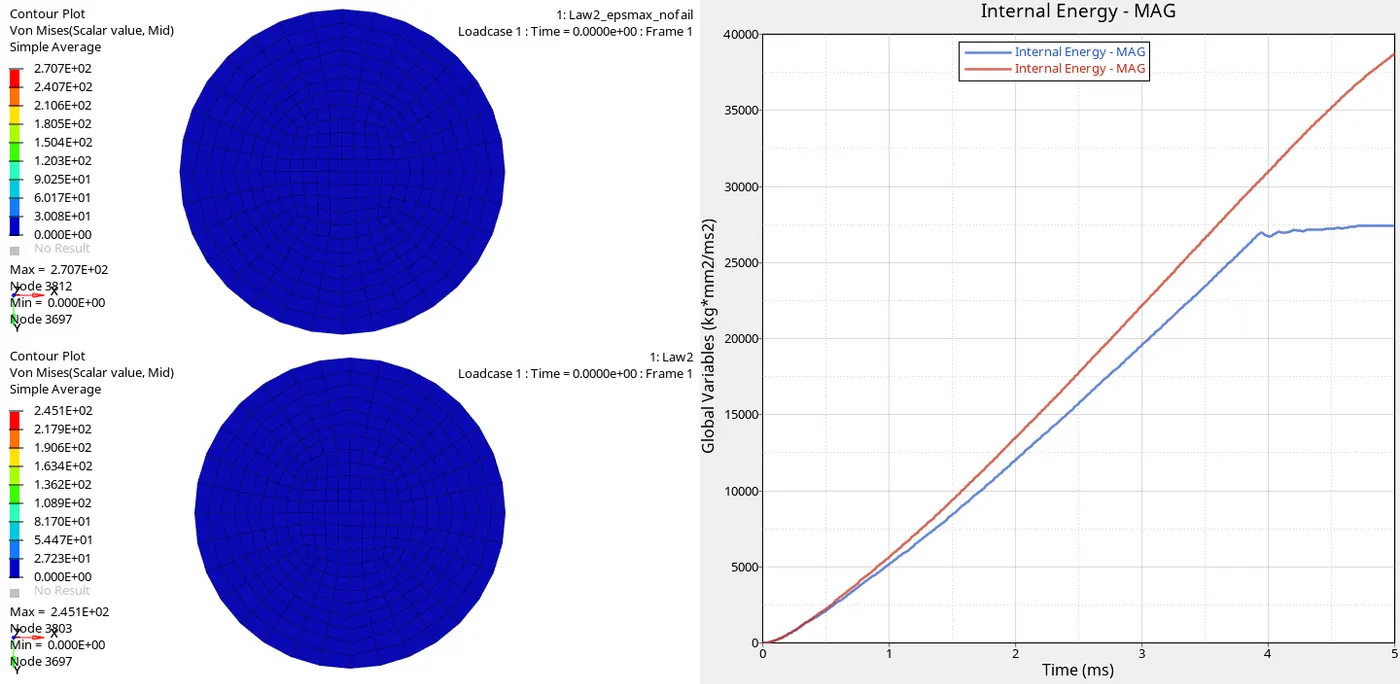
Fig: EPSmax_nofail V/S Law2
- Here we compare the Epmaxno_fail with Law2 In the Epsmax_fail case we are deleting the failure card and in Law2 the EPSmax value is changed as 0 therefore there will be a change in energy plots.
- In both cases, we saw that the more variation in internal energy case-1 internal energy reaches above 27000kgkg*mm^2/ms^2 when the time of 3.9ms and after those elements in the plate is deleted and remains constant. Whereas in case-2 internal energy reaches above 39000kg*mm^2/ms^2 when the time of 5ms and after those elements in the plate is deleted and remains constant.
- In case-1 Von mises stress plot shows that the maximum value of stress is 2.707E+02Mpa and the minimum value of stress as 0 during the rigid ball crashed in the Aluminium plate and in case-2 Von mises stress plot shows that the maximum value of stress is 2.451E+02Mpa and the minimum value of stress as 0 during the rigid ball crashed in the Aluminum plate.
- These variations of energy plot show that the deformation of an element takes place in case-1 is early compare with the case-2. Because the Law2 material contains the property of elastic in this state we consider that EPSmax value as 0 so the elements are deleted but it takes some more time to compare with EPSmax_nofail.
Law36 V/S Law1:
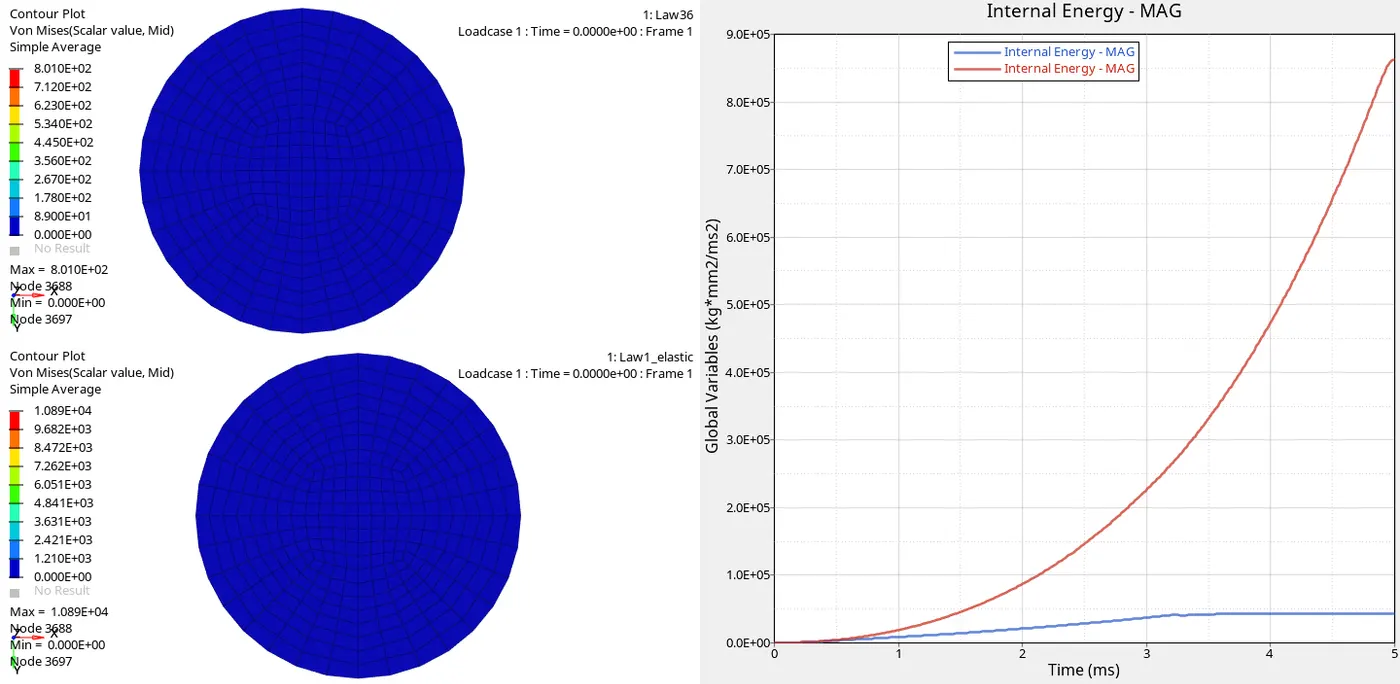
Fig: Law36 V/S Law1
- Here we compare Law36 and Law1 shows that energy changes in plot law1 are fully elastic material and law36 is elastoplastic material so it will reach a certain yield point and then the element will be deleted.
- In both cases, we saw that the more variation in internal energy case-1 internal energy reaches above 40000kg*mm^2/ms^2 when the time of 3.4ms and after those elements in the plate is deleted and remains constant. Whereas in case-2 internal energy reaches above 8.5E+05kg*mm^2/ms^2 when the time of 5ms and after that there will be a crack created between the elements but there is no deleted elements are acted in Law1 hence its elastic material.
- In case-1 Von mises stress plot shows that the maximum value of stress is 8.010E+02Mpa and the minimum value of stress as 0 during the rigid ball crashed in the Aluminium plate and in case-2 Von mises stress plot shows that the maximum value of stress is 1.089E+04Mpa and the minimum value of stress as 0 during the rigid ball crashed in the Aluminum plate.
- Due to elastoplastic material law36, the internal energy rises and deformation is held there hence after it reaches a certain yield point and then elements will break and then internal energy flows constantly. But in Law1 is a fully elastic material so that internal energy will increase depends upon the stress capability and after the maximum stress is acted on the plate the element will get deformed completely and create a crack in the plate.
Law27 Elasto_plastic_brittle V/S Law2 Johnson_cook:
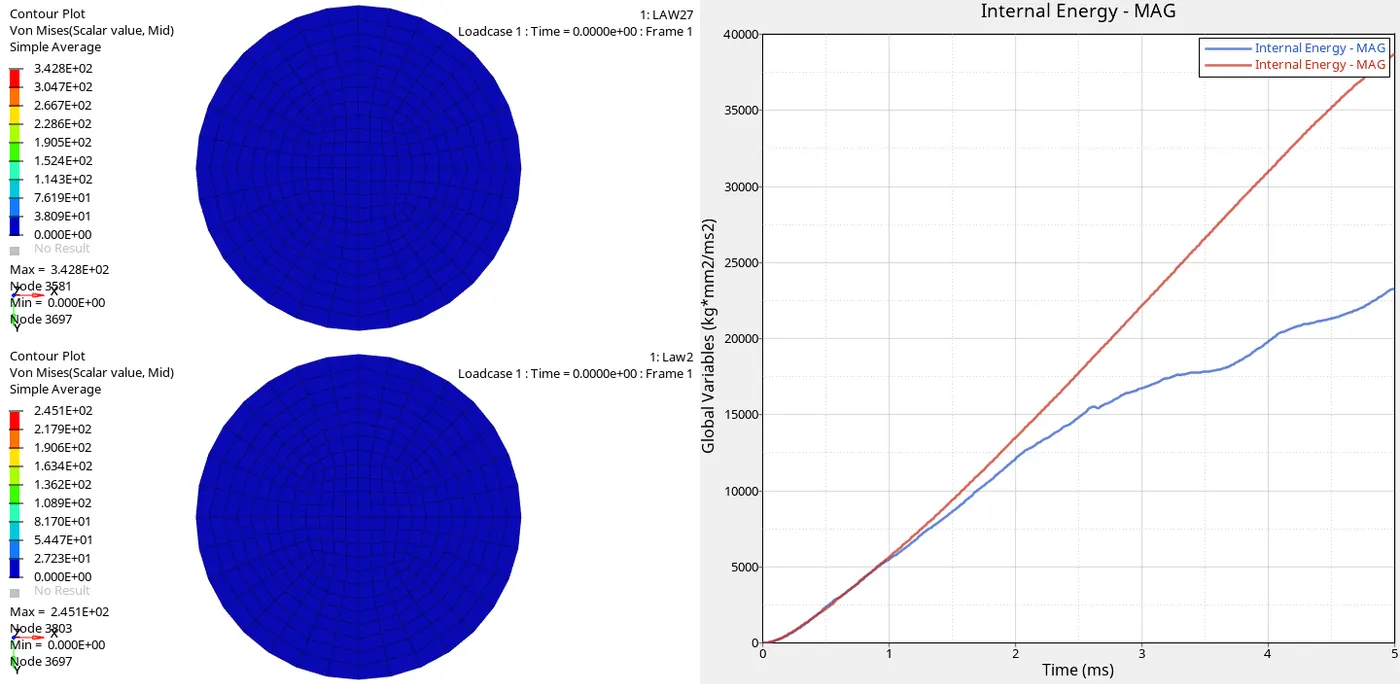
Fig: Law27 V/S Law2
- Here we compare Law27 and Law2 shows that energy changes in plot law27 are brittle material and law2 is fully plasticity material so in law27 there should be an easy break in elements during the deformation. In law27 the elements will break after it reaches the yield point during the deformation process that shows the rise in internal energy.
- In both cases, we saw that the more variation in internal energy case-1 internal energy reaches above 22500kg*mm^2/ms^2 when the time of 5ms and after those elements in the plate is deleted and remains constant. Whereas in case-2 internal energy reaches above 39000kg*mm^2/ms^2 when the time of 5ms and after that there will be a crack created between the elements but there is no deleted elements are acted in Law1 hence its elastic material.
- In case-1 Von mises stress plot shows that the maximum value of stress is 3.428E+04Mpa and the minimum value of stress as 0 during the rigid ball crashed in the Aluminium plate and in case-2 Von mises stress plot shows that the maximum value of stress is 2.451E+02Mpa and the minimum value of stress as 0 during the rigid ball crashed in the Aluminum plate.
- Due to brittle material present in the law27, the deformation is acted when the stress is increased between the punch and plate that shows the rise in internal energy and it reaches the maximum stress point the element will delete. But in Law2 is a plastic material so that internal energy will increase depends upon the stress capability and after the maximum stress is acted on the plate the element will get deformed completely and create a crack in the plate then the elements will delete.
CONCLUSION:
Therefore all the simulation has been done and the results are obtained by different energy plots based on the properties, Law1_Elastic, Law36_Elasto_plastic, EPSmax_failure, EPSmax_crack, EPSmax_nofail, Law27 Elasto_plastic_brittle, and Law2 Johnson_cook.
Hence the total number of cycles, Energy error, mass error, and simulation time are also obtained by the output file of simulation and they are mentioned in each case.
A comparison of seven cases is also defined with the energy plot of internal energy.