Simulation of aerodynamic flow over an Ahmed Body
Simulation of aerodynamic flow over an Ahmed Body
Aim: To simulate aerodynamic flow over Ahmed body for varying mesh size (Grid independence test)
Q1. Describe Ahmed's body and its importance.
Q2. Explain the reason for the negative pressure in the wake region.
Q3. Explain the significance of the point of separation.
Expected Results:
1. Velocity and pressure contours.
2. The drag coefficient plot for a refined case. ( For velocity of 25m/sec, the drag coefficient should be around 0.33).
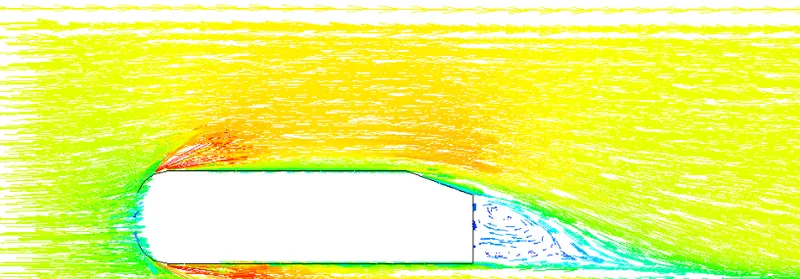
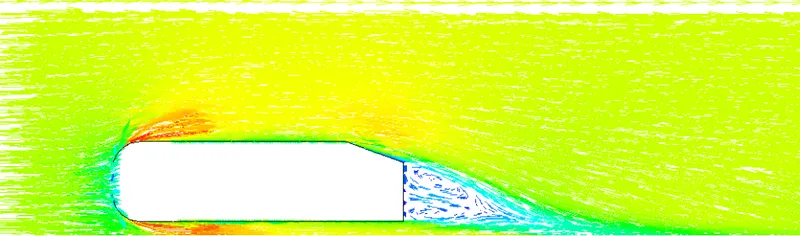
3. The vector plot clearly showing the wake region.
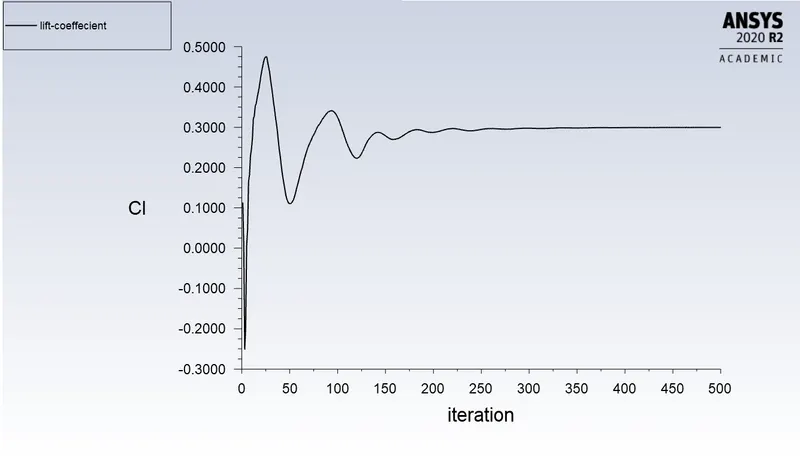
4. Perform the grid independency test and provide the values of drag and lift with each case.
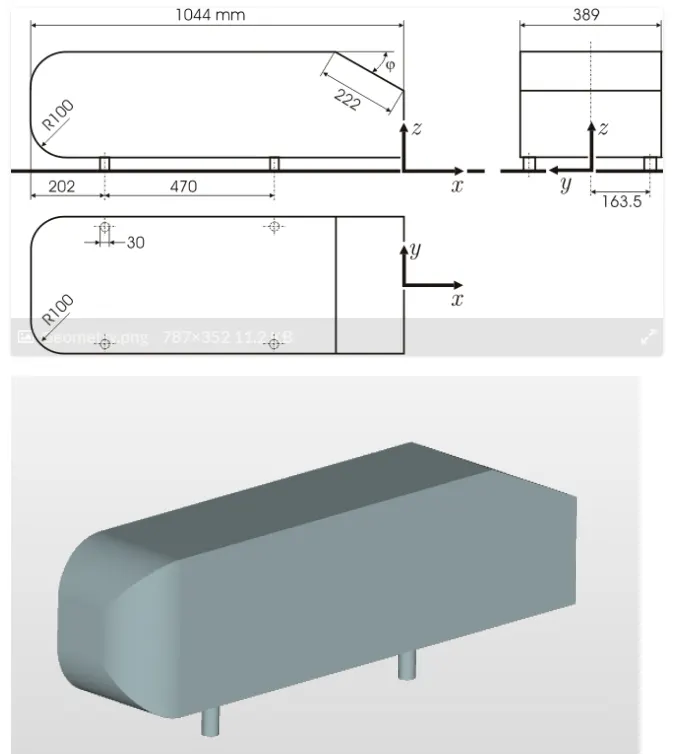
Ahmed body:
The Ahmed body is a generic car body (a simplified vehicle model). The airflow around the Ahmed body captures the essential flow features around an automobile and was first defined and characterized in the experimental work of Ahmed. Although it has a very simple shape, Ahmed body allows us to capture characteristic features that are relevant to bodies in the automobile industry.
This model is also used to describe the turbulent flow field around a car-like geometry. Once the numerical model in validated, it is used to design new models of the car.
Negative pressure in the wake region
The highest pressure occurs at the front of the body, the stagnation point. The pressure decreases as the fluid accelerates around the body until it gets to 30°, where it starts to slow down and increase in pressure.
Then the fluid separates from the cylinder and forms the wake. In these pressure plots, you can see that the pressure essentially levels off once the flow separates. Because of viscous losses, the stagnation pressure in the wake is lower than the stagnation pressure at the front. However, it has a higher pressure than the fluid that is moving outside of the wake.
Since we are measuring gauge pressure the pressure is shown as negative.
Significance of the point of separation
Aerodynamics analysis is used in the design of car to reduce drag coefficient. The wake separation flow behind the Ahmed body is the main contributor to the drag force, accurate prediction of the separation process and the wake flow are the key to the successful modelling of this case.
Procedure:
1. The geometry is opened in SpaceClaim and using the enclosure tool an outer and inner enclosure is created as shown below
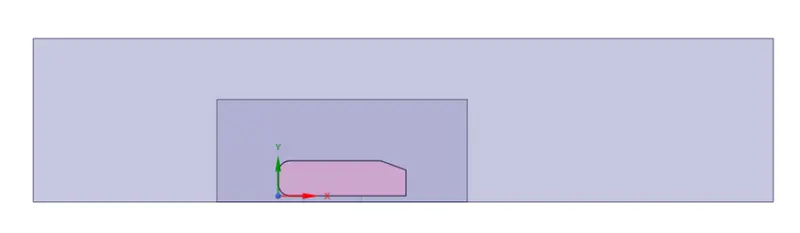
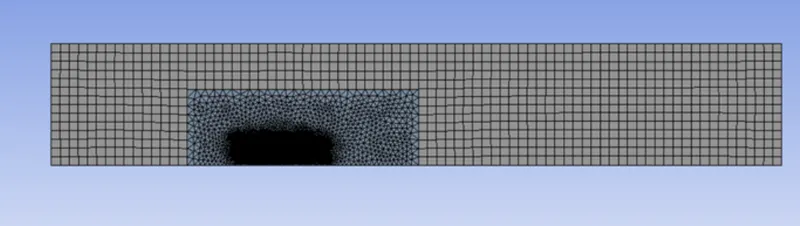
2. The mesh generator is opened and two cases are used for grid independence test
Case 1: Mesh size of outer enclosure = 100 mm, inner =50 mm
Case 2: Mesh size of outer enclosure = 60 mm, inner =40 mm
3. Inflation layer is calculated. For turbulence 30<y+<300. We assume y+ = 100
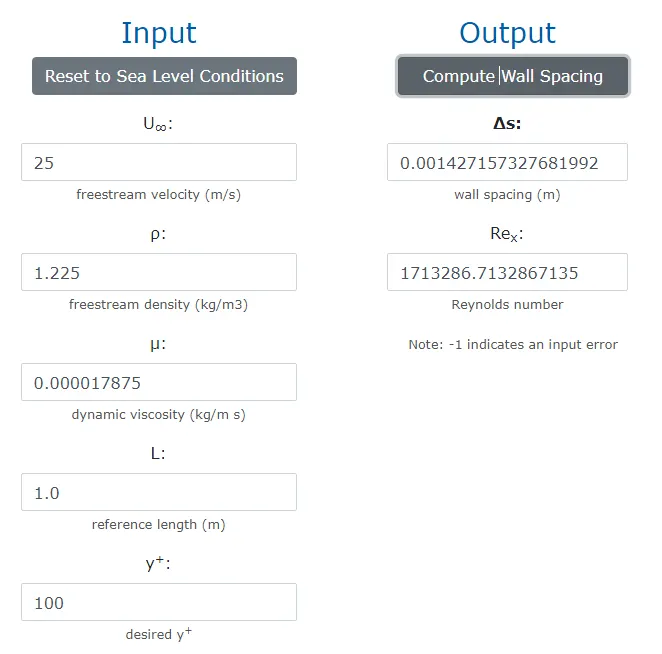
First layer thickness = 1.43 mm and total thickness = 6mm
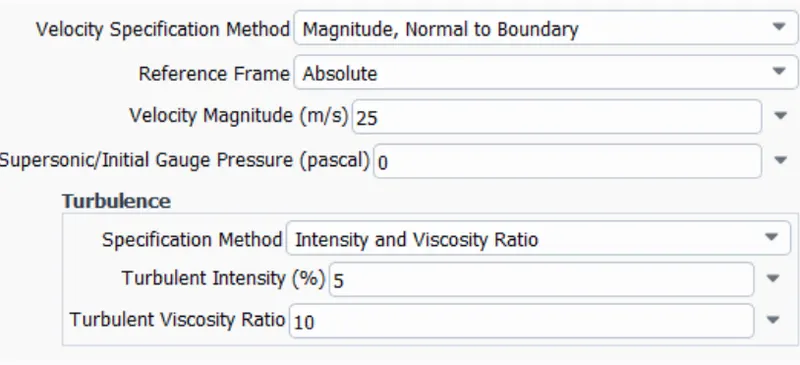
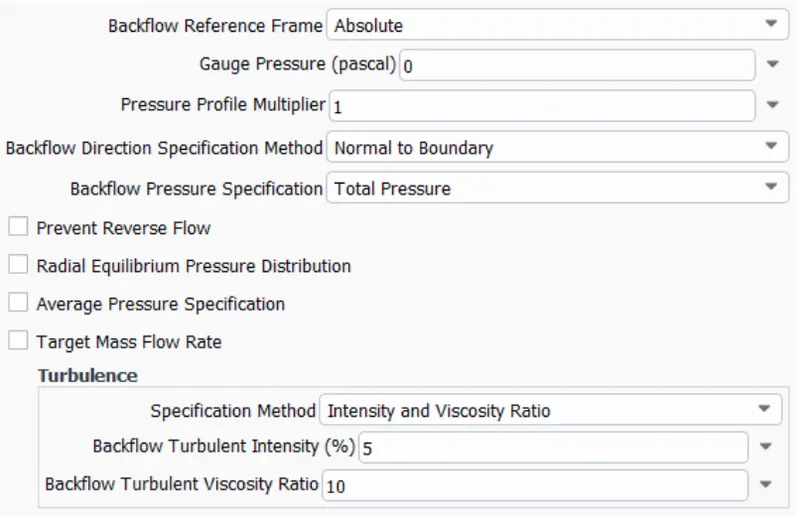
4. The boundary conditions are defined as follows
Inlet
Outlet
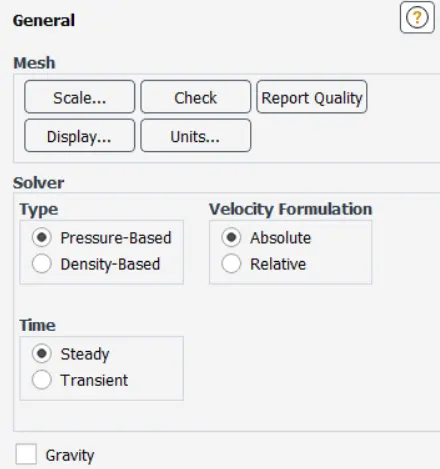
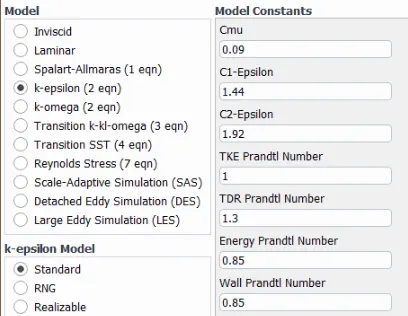
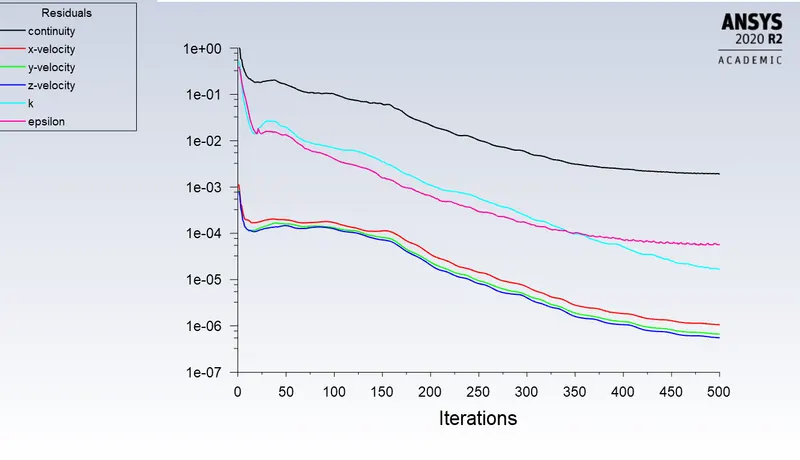
5. k-epsilon model is used for running the simulation. Solver is pressure based.
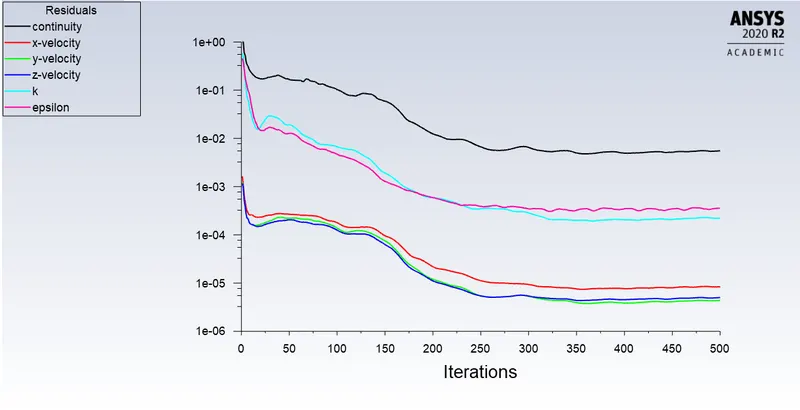
6. The simulation is run for 500 iterations after initialization.
Results:
Case1: Mesh size of outer enclosure = 100 mm, inner =50 mm
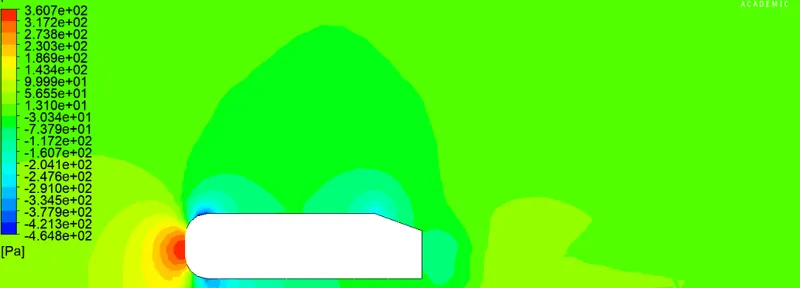
Pressure contour
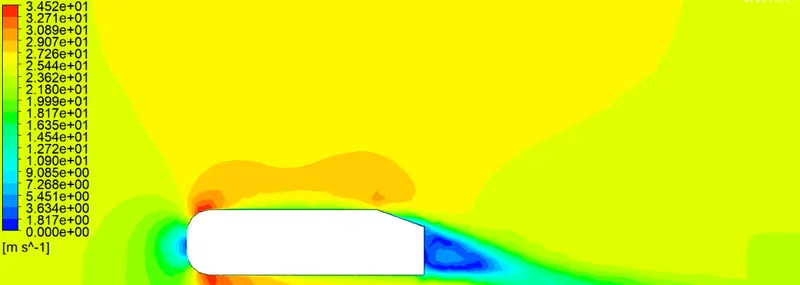
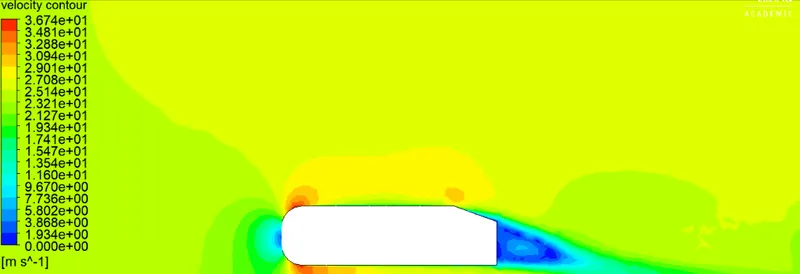
velocity contour
velocity stream line plot
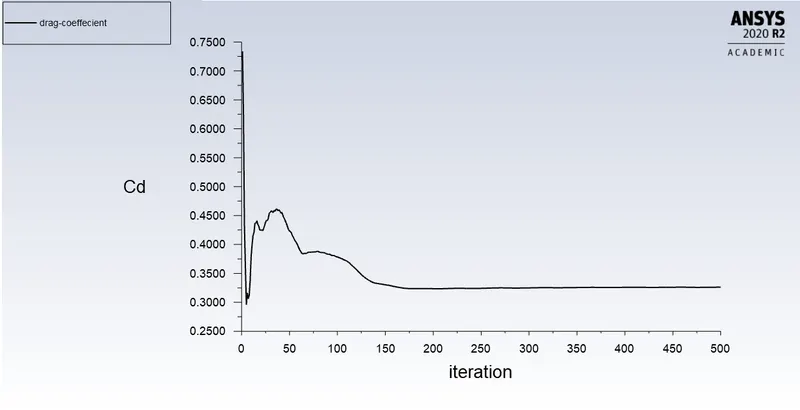
Coefficient of drag = 0.326
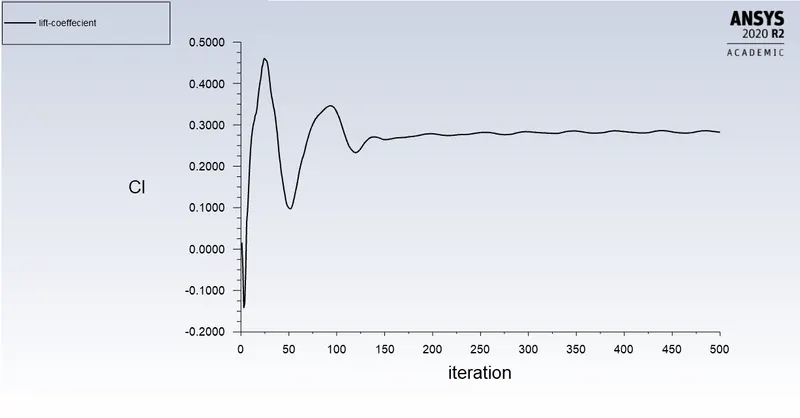
Case2: Mesh size of outer enclosure = 60 mm, inner =40 mm
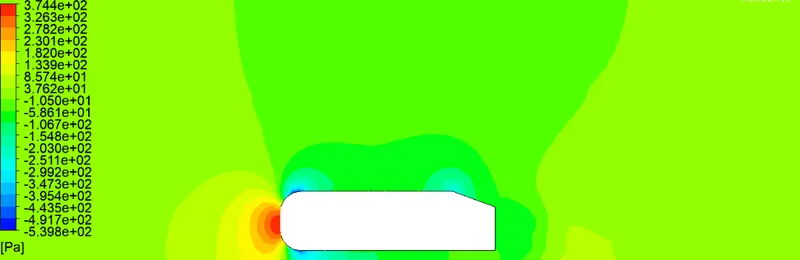
pressure contour
velocity contour
velocity stream line plot
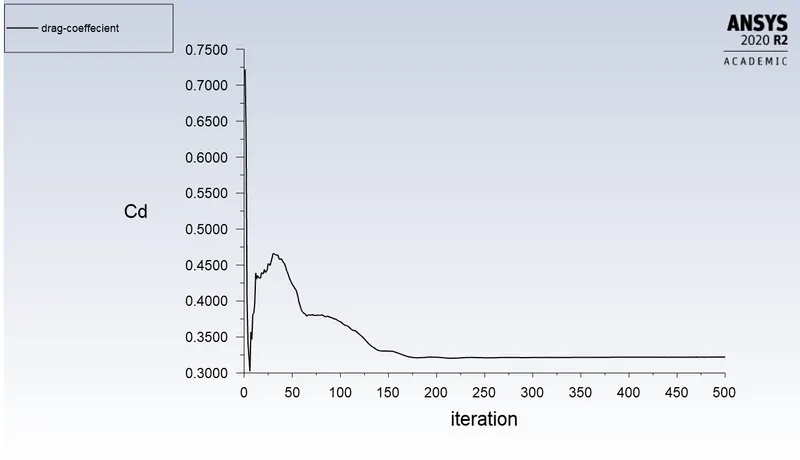
coefficient of drag = 0.322
Conclusion:
1. The pressure contour showss high pressure in front this is because the velocity becomes zero at front of of the body by converting to pressure.
2. The pressure is very low behind the body in the wake region because of flow seperation.Because of viscous losses, the stagnation pressure in the wake is lower than the stagnation pressure at the front.
3. The stream line plot clearly shows the region of recirculation where the velocity values are very less.
4. Flow seperation plays an important role in drag coefficient.
5. The baseline mesh which was a coarse tetrahedal mesh did not give a good result of drag coefficient since thee inflation layers was not established.
6. Grid independence test was sone as shown above. The changes in values are not that significant. The difference in Cd between both cases was only 0.02.
7. Cd value near to 0.33 was obtained from the simulation.