Battery Pack Modelling in Simulink
Objective:
1. Build a battery pack with 3S4P configuration with generic battery block
a.Configure the batteries as per a Lithium-ion battery datasheet
b.Explain your parameters
c.Simulate the model and comment on the results for SOC, voltage, current in detail
d.Change the configuration to 4S3P and simulate the model
e.Compare the results for both models and give your explanation for the results
Solution:
The battery pack configuration is a setup in which we get the idea of the voltage and current generation with series and parallel connection variations. The difference in pattern will have different impact on the output.
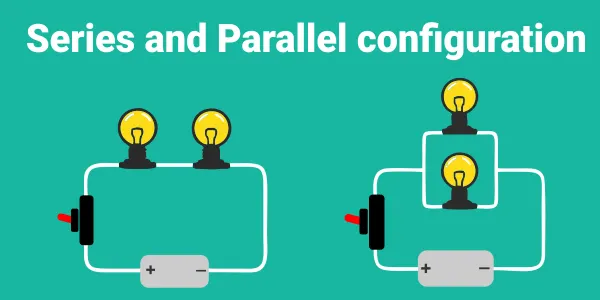
The Lithium-ion battery pack is the combination of series and parallel connections of the cell. In this blog batteries in series vs parallel we are talking about Series and Parallel Configuration of Lithium Battery. By configuring these several cells in series we get desired operating voltage. Also the Parallel connection of these cells increase the capacity which directly increase the total ampere-hour (Ah) rating of the battery pack.
Single cell configuration
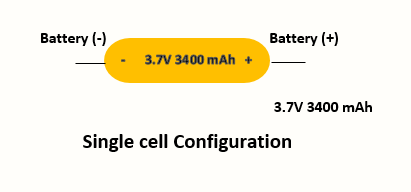
The single-cell configuration is the simplest battery pack. Typical these configuration are available in mobile phones and tablets with one 3.7V Lithium-ion cell. Other uses of a single cell are wall clocks, which typically use a 1.5V alkaline cell, wristwatches and memory backup, most of which are very low power applications. The below image shows the single cell configuration of Lithium-ion cell.
The nominal cell voltage for a nickel-based battery is 1.2V. for alkaline it is 1.5V; silver-oxide is 1.6V and lead acid is 2.0V. Primary lithium batteries range between 3.0V and 3.9V. Li-ion is 3.7V. Li-phosphate is 3.2V and Li-titanate is 2.4V. Li-manganese and other lithium-based systems often use cell voltages of 3.7V and higher.
There are different types of batteries in series vs parallel pack formation and they are explaning as follow,
Series Configuration
Some of the portable equipment requires higher voltage battery packs. so in thi case the voltage can increase by connecting these cell in series. The below figure shows a battery pack of three 3.7V Lithium-ion cells. These cells are connected in series now this 3S or 3 cell battery pack which produce 11.1 V in nominal mode.

Similarly, six-cell lead acid string with 2 V/cell will generate 12 V and four alkaline with 1.5 V/cell will produce 6 V. According with the required voltage for your application, you can connect the number of cells in series.
If one of the cell of the battery pack gets discharged or damaged then the battery pack shows the notification. This notification gets due to the protection board used in it. The below image illustrates a battery pack in which “cell 3” produces only 2.8V instead of the full nominal 3.7V.
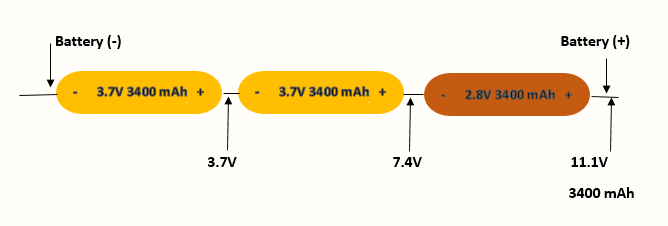
With depressed operating voltage, this battery reaches the end-of-discharge point earlier than a normal pack. The voltage collapses and the device turns off with a “Low Battery” message. At this point you have to charge your battery pack with suitable charger.
Prallel configuration
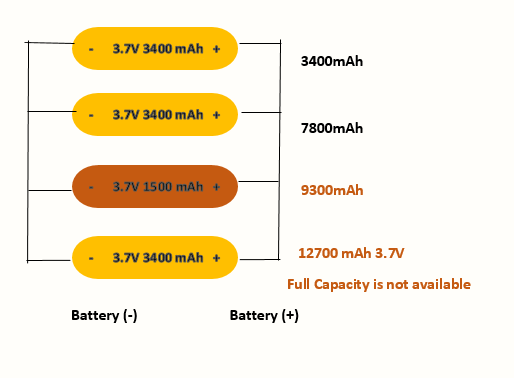
If the applications require the higher current capacity battery and larger cells are not available then by using the parallel configuration of these cells, the current capacity can increase. Most of the battery chemistries allow parallel configurations with little side effect. The below image shows the parallel configuration of four cells. The nominal voltage of the illustrated pack remains at 3.7V, but the capacity (Ah) and runtime are increased.
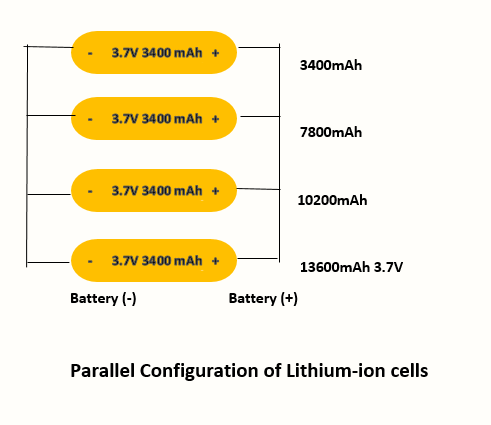
A cell that develops high resistance in a parallel circuit than in a series configuration. But in the parallel configuration, a failing or faulty cell will reduce the total load capability. On the other hand, an electrical short is more serious as the faulty cell drains energy from the other cells, it causes a fire hazard. Large packs often include a fuse that disconnects the failing cell from the parallel circuit if it were to short.
Below image shows the parallel configuration with one faulty cell. In that, the capacity of third cell is 1500 mah. Weak cell will not affect the voltage but provide a low runtime due to reduced capacity.
Series and parallel configuration
Using the series and parallel configuration, you can design the more voltage and higher capacity battery pack with a standard cell size. The below figure shows the configuration of 2S2P configuration of the 18650 Lithium Ion cells. Here, 2 cells connect in series and 2 cells are in parallel. The total power is the sum of voltage times current. A 3.7V (nominal) cell multiplied by 3400mAh produces 12.58Wh.
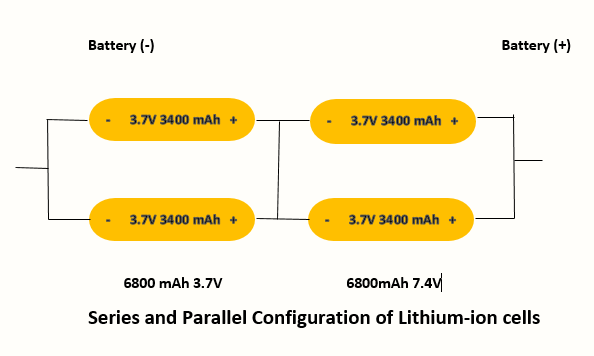
Four 18650 Lithium-ion cells of 3400 mAh can connect in series and parallel as shown to get 7.2 V nominal and 12.58 Wh. The slim cell allows flexible pack design but every battery pack requires the Battery protection circuit. Generally Integrated circuits (ICs) for various cell combinations are available in the market. Larger packs need custom circuits. This larger battery packs use in e-like batteries, hybrid cars and the Tesla Model.
Safety devices in series and parallel configuration
The positive Temperature Coefficient Switches (PTC) and Charge Interrupt Devices (CID) protect the battery from overcurrent and excessive pressure. The PTC and CID work as expected to switch of the cell on excessive current and internal cell pressure, the shutdown occurs in cascade format. While some cells may go offline early, the load current causes excess current on the remaining cells. Such overload condition could lead to a thermal runaway before the remaining safety devices activate.
a.Configure the batteries as per a Lithium-ion battery datasheet
Now we have to acquire is the reference of Lithium-Ion battery Datasheet for the input in the generic battery model. We can get the same from MATLAB documentation and proceed for the simulation and block setup.
The same approach for parameter extraction is applied to the Panasonic Lithium-Ion CGR18650AF with these specifications.
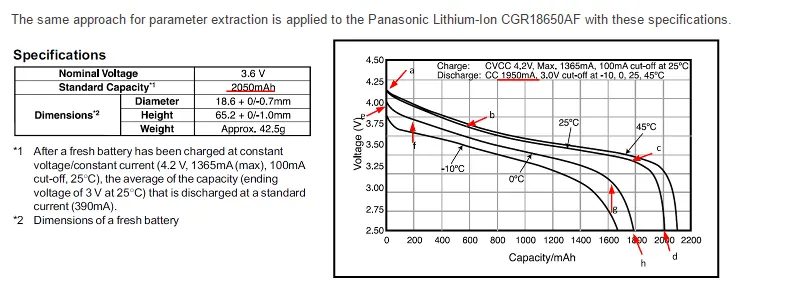
These parameters are extracted for the battery model.
| Parameter | Value |
|---|---|
|
Nominal voltage (c) |
3.3 V |
|
Rated capacity |
2.05 Ah |
|
Maximum capacity (d) |
2 Ah |
|
Fully charged voltage (a) |
4.2 V |
|
Nominal discharge current |
1.95 A |
|
Internal resistance (estimated) |
16.5 mΩ |
|
Capacity at nominal voltage (c) |
1.81 Ah |
|
Exponential zone (b) |
3.71 V, 0.6 Ah |
|
Nominal ambient temperature |
25 °C |
|
Second ambient temperature |
0 °C |
|
Maximum capacity at 0 °C (h) |
1.78 Ah |
|
Initial discharge voltage at 0 °C (e) |
4 V |
|
Voltage at 90 % maximum capacity at 0 °C (g) |
3.11 V |
|
Exponential zone at 0 °C (f) |
3.8 V, 0.2 Ah |
|
Thermal resistance, cell-to-ambient (estimated) |
0.06 |
|
Thermal time constant, cell-to-ambient (estimated) |
1000 |
The figure shows a good match between the simulated discharge curves (dashed line) and the data sheet curves. The accuracy of the model depends on how precise the selected points from the data sheet discharge curves are.
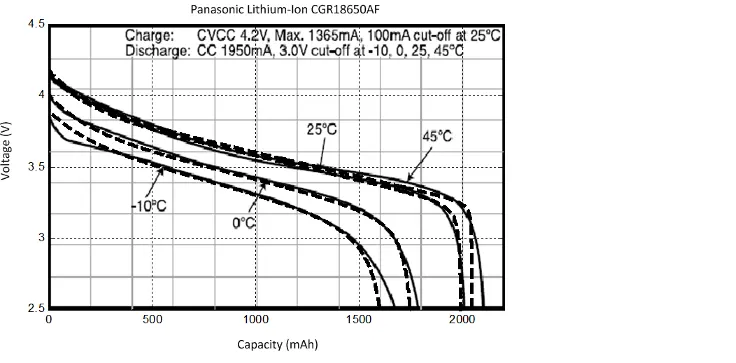
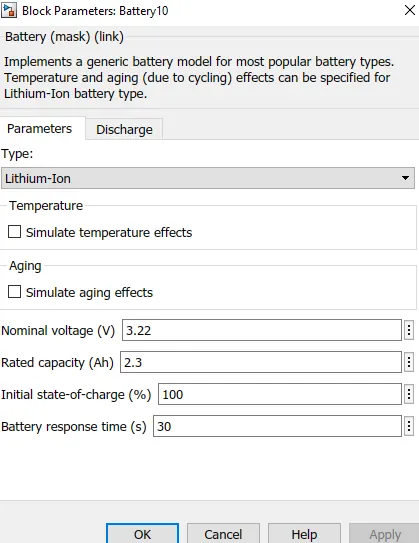
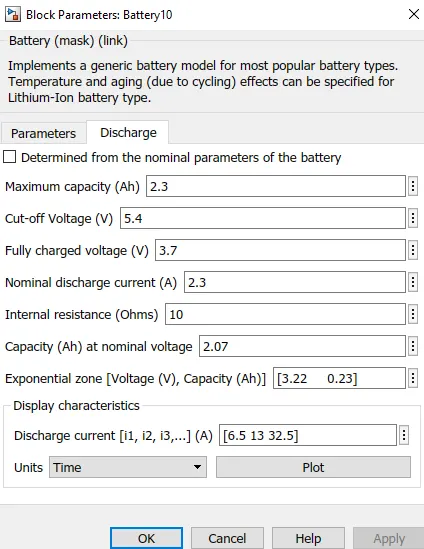
Above is how we configure the generic battery setup from reference data.
b.Explain your parameters
Nominal voltage (V)
The nominal voltage, Vnom, of the battery in V. The nominal voltage represents the end of the linear zone of the discharge characteristics. Default is 7.2.
The rated capacity, Qrated, of the battery in Ah. The rated capacity is the minimum effective capacity of the battery. Default is 5.4.
The initial state-of-charge (SOC) of the battery. An SOC of 100% indicates a fully charged battery and 0% indicates an empty battery. This parameter is used as an initial condition for the simulation and does not affect the discharge curve (when the option Plot Discharge Characteristics is used). Default is 100.
The response time of the battery (at 95% of the final value). Default is 30. This value represents the voltage dynamics and can be observed when a current step is applied.
Determined from the nominal parameters of the battery
Load the corresponding parameters in the entries of the dialog box, depending on the selected Type, the Nominal voltage, and the Rated capacity.
When a preset model is used, the detailed parameters cannot be modified. If you want to modify the discharge curve, select the desired battery type to load the default parameters, and then clear the Determined from the nominal parameters of the battery check box to access the detailed parameters. Default is cleared.
Maximum capacity (Ah)The maximum theoretical capacity, Q, when a discontinuity occurs in the battery voltage in Ah. This value is generally equal to 105% of the rated capacity. Default is 5.4.
The minimum allowable battery voltage in V. This voltage represents the end of the discharge characteristics. At the cut-off voltage, the battery is fully discharged. Default is 5.4.
The fully charged voltage, Vfull, for a given discharge current. The fully charged voltage is not the no-load voltage. Default is 8.3807.
The nominal discharge current, for which the discharge curve has been measured, in A. For example, a typical discharge current for a 1.5-Ah NiMH battery is 20% of the rated capacity: (0.2 * 1.5 Ah / 1 h = 0.3 A). Default is 2.3478.
The internal resistance of the battery in ohms. When a preset model is used, a generic value is loaded, corresponding to 1% of the nominal power (nominal voltage multiplied by the battery rated capacity). The resistance is supposed to be constant during the charge and the discharge cycles and does not vary with the amplitude of the current. Default is 0.013333.
The capacity, Qnom, extracted from the battery until the voltage drops under the nominal voltage. This value should be between Qexp and Qmax. Default is 4.8835.
The voltage, Vexp, and the capacity, Qexp, corresponding to the end of the exponential zone. The voltage should be between Vnom and Vfull. The capacity should be between 0 and Qnom. Default is [7.7788 0.2653].
Allows specifying different values of discharge current. The discharge characteristics for these currents are presented in the second part of the graph. Default is [6.5 13 32.5].
Choose either Time (default) or Ampere-hour as the x-axis for the plot.
Plots a figure containing two graphs. The first graph represents the nominal discharge curve (at the Nominal Discharge Current) and the second graph represents the discharge curves at the specified discharge currents.
c.Simulate the model and comment on the results for SOC, voltage, current in detail
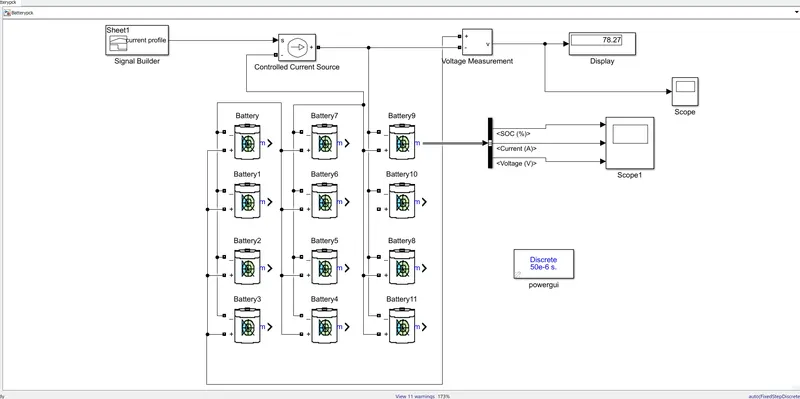
1. This model displays the configuration 3S4P where the series 3 series are connected +ve terminal connected to all +ve terminals and 4 of these series connections are connected in parallel -ve to all -ve terminals.
2. The total voltage around the series connection is 3.7x 3 which is 11.7V as 3.7 is fully charged voltage which is connected in 3 series.
3. Total maximum capacity of each cell would be 2.3x4 as 4 cells connected in parallel which would be the total capacity of 9.2Ah.
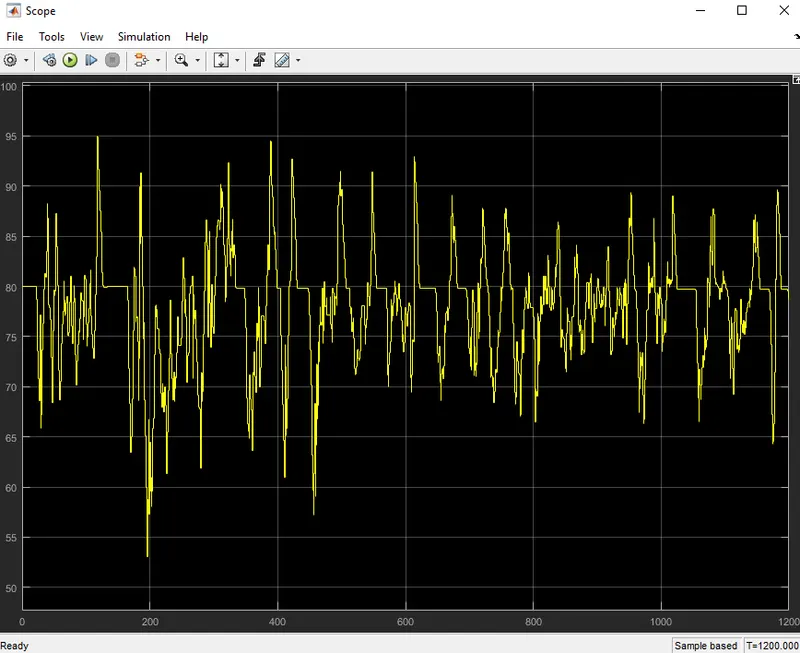
The Output Voltage for the UDDS cycle provided my skill-Lync of lIthium -ion battery.
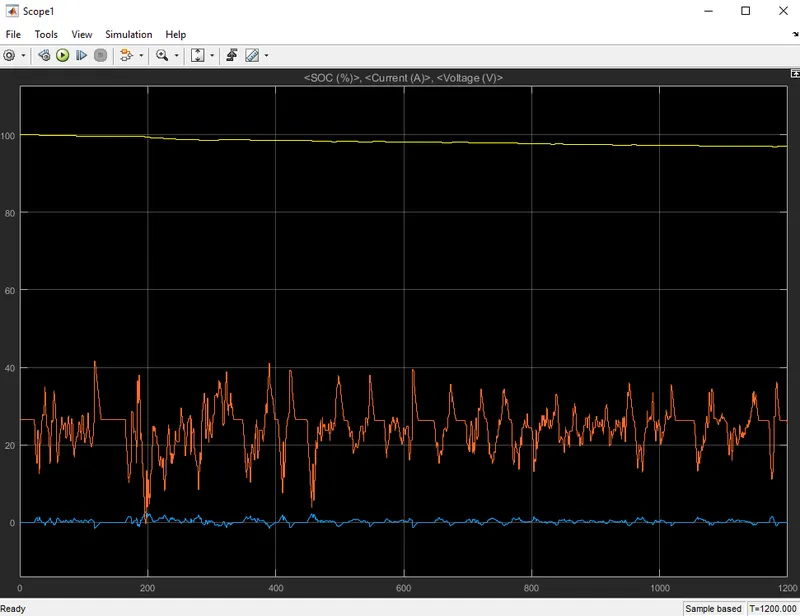
Here SOC is getting depleted over time and it can be said that pack was designed and simulated correctly over the capacity of 9.2Ah.
UDDC sometimes demands a higher current at times. The higher current brings in Peukert's effect and the capacity of the battery is reduced.
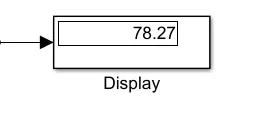
Above is the image of the highest voltage output after simulation.
Battery pack 4S3P configuration
Now, this setup is different from 4S3P where e placed 4 in series and 3 in connection.
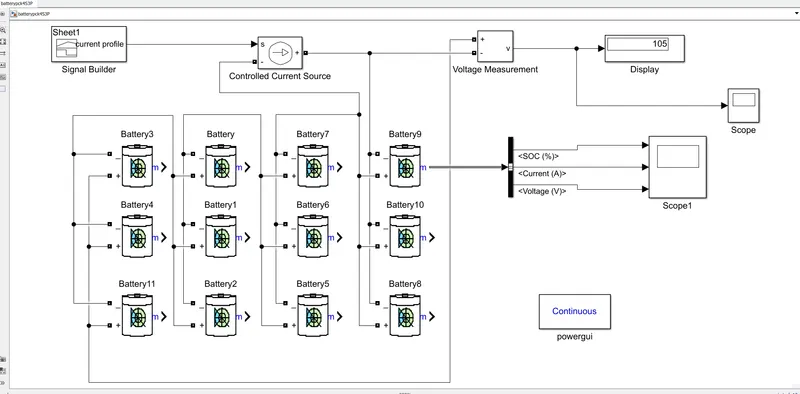
1. Here again the way we have connected is slightly different from the previous model. Here we connected 4 batteries in series giving variable voltage and capacity.
2. The total fully charged voltage is 3.7 x 4 which makes it 13.1V which is exactly it represents in voltage measurement.
3. Same goes here for Maximum capacity will be 2.3x 3 which makes it 6.9Ah as only 3 cells are connected in parallel.
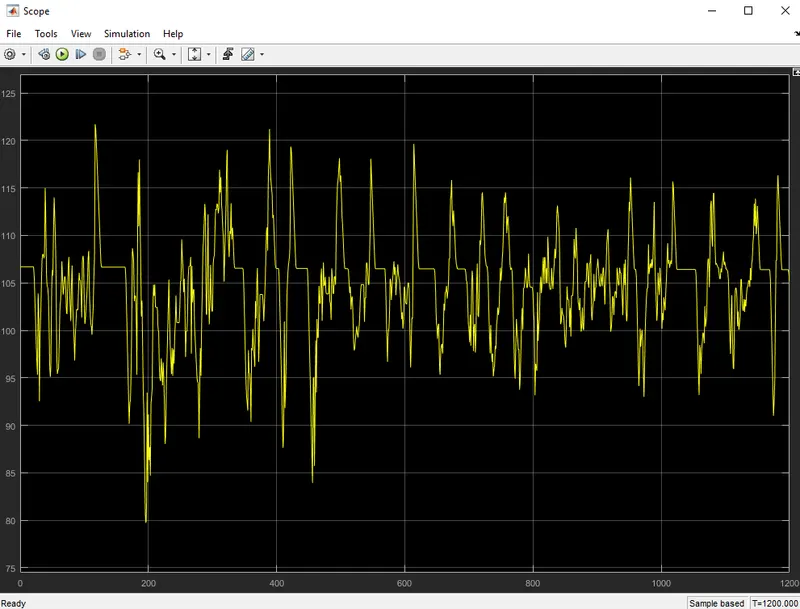
Output Voltage from the UDDS cycle we got from the reference data sheet.
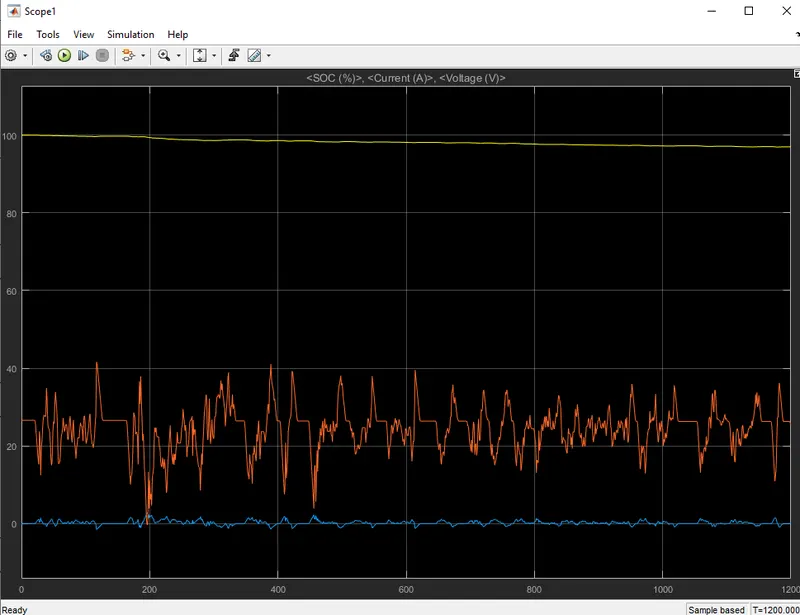
The SOC is depleting with time with the full capacity of 6.9Ah making it the right way to be simulated and designed.
e.Compare the results for both models and give your explanation for the results
3S4P battery pack
This battery setup has some details that make it a good configuration setup.
1. As it has 9.7Ah of maximum capacity the Depth of Discharge DOD is lower which is an endurable system
2. This current can discharge peak current of 2.7A
3. The Voltage is quite low as the whole battery configuration is connected in series with 3 cells.
4S3P battery pack
The battery here is different from the previous model in that it has the following observed output:
1. The battery pack discharges a little more current due to greater voltage produced making the higher current produced
2. Depth of DIschrge DOD is higher than 3S4P because of the lower capacity of 6.9V.
3. It has 4 cells in series that is why to produces higher voltage.