Steady state simulation of Throttle body
In this, the simulation is carried out for the flow through the throttle body. The main objective of the simulation is that the simulation is carried out by steady state condition.
The throttle is a mechanism which controls the fluid flow by obstruction. The application of throttle is widespread from domestic usage to industrial application. In Petrol Engines, throttle also called a Butterfly valve which is used to control the flow of the air and fuel mixture.
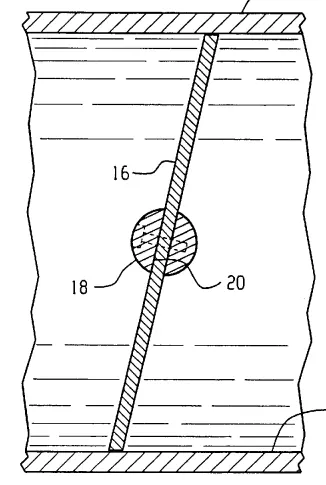
Image credit: https://en.wikipedia.org/wiki/Throttle#/media/File:USPatent6518683.png
Case Setup:
Initial conditions:
Fluid: Air
No of Cycles: 15000
Inlet Pressure: 150000 Pa
Outlet Pressure: 100000 Pa
The flow occurs due to the pressure difference between the inlet and the outlet.
Throttle Type (BC): wall
Grid size: 0.002 m
Embedding on the throttle valve to capture the boundary:
Scale :3
Embed layers: 2
Turbulence model: RNG k-`epsilon`
Mesh:
The simulation was carried out around 41000 cells, and the converge follows the cut cell cartesian approach for grid generation. It is seen that the geometry at the wall has been perfectly captured as it does not depends on the values of grid size and the embedding allows us to capture the effect of the flow near the throttle boundary. The simulation was carried out when the wall is 90 degree, or when the valve is fully open
Velocity Contour:
The velocity is almost uniform through the pipe, due to some stagnation of the fluid particle at the throttle, the velocity increase at the side of the throttle. And the velocity remains low at the throttle.
stream function:
Stream allows us to trace the fluid particle in the flow, the stream of the fluid particle at the throttle has been shown. Due to the minimum stagnation of the throttle wall, the velocity increases, and at the point of the stagnation, we can see a minimum velocity as seen in the velocity contour. The stream is colored by velocity.
Pressure:
As of the velocity, there is high pressure on the point where the fluid meets the throttle area, the pressure increases and it is doesn't show any greater variation on the rest of the pipe. As velocity is inversely proportional to Pressure, it is seen that the edge of the Throttle has very less pressure and it is due to an increase in velocity.
Plots:
The mass flow rate of air for each time step has been plotted. It is to satisfies the continuity equation. The solution almost converges around 2000 cycles or iterations. In case of pressure, the inlet pressure is constant that is around 1.5 bar, but the outlet pressure increase around 1.35 bar and the solution are converged. It is seen that the solution is converged around 4000 cycles. The velocity plot converges around 2000 cycles.
Mass flow rate:
Pressure:
Velocity: