GRAPHICAL REPRESENTATION OF OTTO CYCLE AND DETERMINING THERMAL EFFICIENCY
AIM:
To find out the thermal efficiency of an otto cycle and to plot the pv diagram
PROCESS OF AN OTTO CYCLE:
In an ideal thermodynamic combustion cycle, as follows:
- 1-2 compression at constant entropy
- 2-3 constant-volume heat transfer to the system
- 3-4 an expansion at constant entropy
- 4-1 constant-volume heat rejection from the system.
The thermal efficiency of the ideal Otto cycle increases with an increasing compression ratio.
the above diagram shows that the pv graph
THERMAL EFFICIENCY:
An ideal heat engine is an imaginary engine in which energy extracted as heat from the high-temperature reservoir is converted completely to work. But according to the kelvin-plank statement, such an engine would violate the second law of thermodynamics, because there must be losses in the conversion process. The net heat added to the system must be higher than the net work done by the system.
BORE AND STROKE:
Bore is the diameter of each cylinder and stroke is the length that it travels when moving from bottom position to the top position. Thus if the engine has 1 cylinder with bore x stroke of 78 x 52.3 mm it's total displacement will be:
CONNECTING ROD:
A connecting rod, also called a con rod, is the part of a piston engine which connects the piston to the crankshaft. ... The most common usage of connecting rods is in internal combustion engines and steam engines.
SWEPT VOLUME:
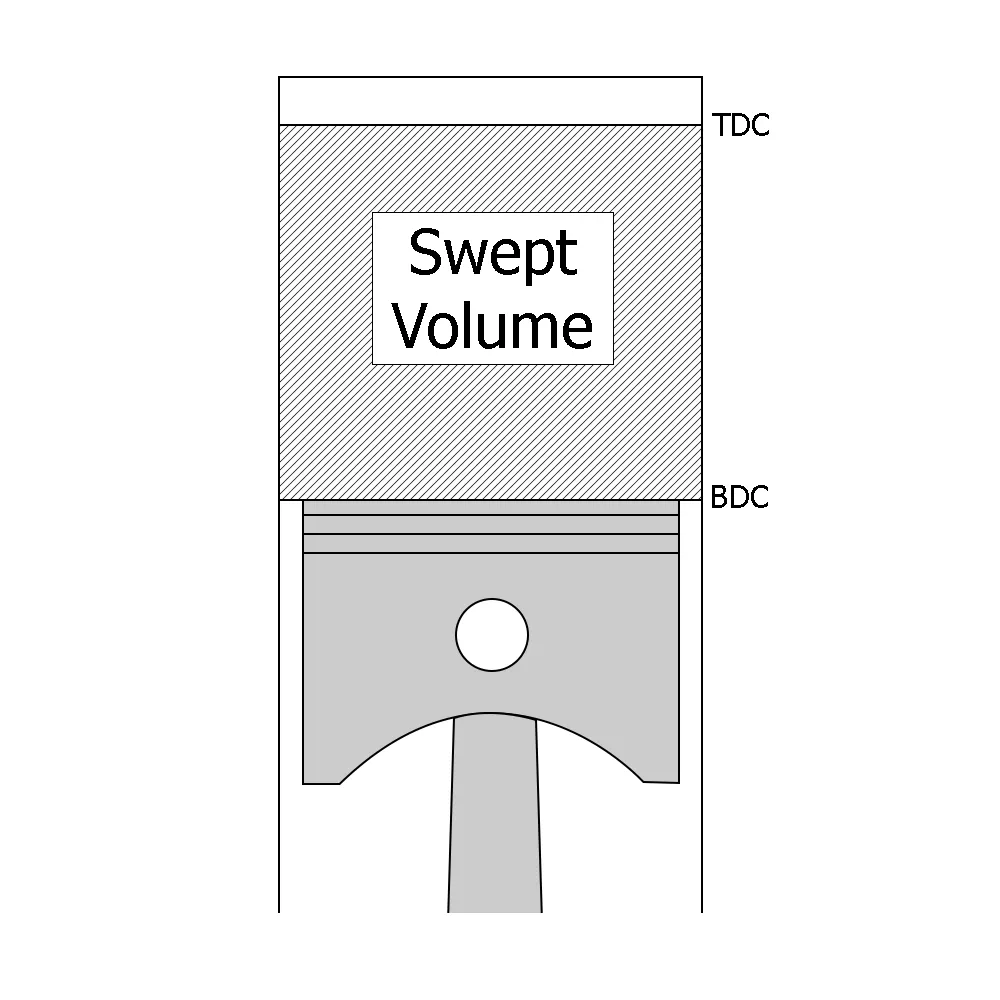
Swept volume is the displacement of one cylinder. It is the volume between top dead center (TDC) and bottom dead center (BDC).
CLEARANCE VOLUME:
Clearance volume is a volume between the cylinder head and the piston top when the piston is at top dead center (TDC). It can also be defined as the volume of cylinder that is not swept by the piston. ... Each time the piston goes up, it compress the fuel air mixture in the Clearance volume before ignition takes place.
COMPRESSION RATIO:
For calculating compression ratio you should know the swept volume and clearance volume of the engine cylinder. Then you can use the relation,
r= 1+(Vs/Vc).
Where, r- compression ratio,
Vs- Swept Volume and
Vc- Clearance Volume.
PROGRAM:
clear all
close all
clc

%inputs
gamma=1.4
t3=2800

%state variables
p1=101325
t1=800
%engine geometric parameters
bore=0.14;
stroke=0.18;
con_rod=0.15;
cr=16;

%calculating the swept volume and clearance volume
v_swept=(pi/4)*bore^2*stroke;
v_clearance=v_swept/(cr-1);
v1=v_swept+v_clearance
v2=v_clearance

%state varibles at state points 2
%p2v2^gamma=p1v1^gamma
%p2=p1*(v1/v2)^gamma=p1*cr^gamma
p2=p1*cr^gamma;

%p1v1/t1=p2v2/t2 | t2=p2*v2*t1/(p1*v1)
t2=p2*v2*t1/(p1*v1);

constant_c=p1*v1^gamma;
v_compression=engine_kinematics(bore,stroke,con_rod,cr,180,0);
p_compression=constant_c./v_compression.^gamma;

%state variables at state point 3
v3=v2

%p3v3/t3=p2v2/t2 | p3=p2*t3/t2
 p3=p2*t3/t2

constant_c=p3*v3^gamma;
v_expansion=engine_kinematics(bore,stroke,con_rod,cr,0,180);
p_expansion=constant_c./v_expansion.^gamma;


 %state variables at state point 4
 v4=v1

 %p3v3^gamma=p4v4^gamma | p4=p3(v3/v4)^gamma
 p4=p3*(v3/v4)^gamma


 % thermal efficiency
 thermal_efficiency= 1-(1/(cr^(gamma-1)))


 figure(1)
 hold on
 plot(v1,p1,'*','color','r')
 plot(v_compression,p_compression)
 plot(v2,p2,'*','color','r')
 plot([v2 v3],[p2 p3])
 plot(v3,p3,'*','color','r')
 plot(v_expansion,p_expansion)
 plot(v4,p4,'*','color','r')
 plot([v4 v1],[p4 p1])

 figure(2)
 plot([v1 v2 v3 v4 v1],[p1 p2 p3 p4 p1],'color','b')
EXPLANATION OF THE CODE:
The program aim is to find the four coordinate points of the pv diagram to that , Initially the inputs are initialized and substitute those inputs in the swept volume and clearance volume formula .
Followed by every state variables are stating ,by theromodynamic calculations, the state variables are derived from the constant process and getting the required value of pressure,volume and temperature.
here, calling function is initialized that as engine kinematics, here all the inputs are initialized as like templates, so every time different variables can be used or the main funmction inputs are used.
after got all the variables values then thermal efficiency is calculated by substuting the generated formula.
followed by the values the points and lines are plotted in the pv plot graph.
RESULTS:
this above diagram shows that the result of the piston kinematics.
ERRORS FACED WHILE PROGRAMMING:
TO OVERCOME ERROR:
1. use to check when ever the matrixes used check out the dot element is present.
2. using appropriate functions is fine.
CONCLUSION:
Hence, an otto cycle is plotted in the pv diagram and determined the thermal efficiency