CALCULATING GLOBAL MAXIMA OF STALAGMITE FUNCTION BY USING GENTIC ALGORITHM IN MATLAB
AIM:
To calculate the global maxima of a stalagmite function and to explain the syntax for Genetic Algorithm (GA) in MATLAB.
OBJECTIVE:
- To write a code in MATLAB to optimise the stalagmite function and find the global maxima of the function.
- To expalin the concept of genetic algorithm and the syntax for GA in MATLAB.
- To Plot graphs for all three studies and for F maximum vs no. of iterations.
THEORY:
GENETIC ALGORITHM
Genetic algorithm is basically search algorithm. It was developed by prof.John Holland at the university of michigan around 1975. The process of natural selection where the fittest individuals are selected for reproduction in order to produce offspring of the next generation.
The genetic algorithm is a method for solving both constrained and unconstrained optimization problems that is based on natural selection, the process that drives biological evolution. The genetic algorithm repeatedly modifies a population of individual solutions. At each step, the genetic algorithm selects individuals at random from the current population to be parents and uses them to produce the children for the next generation.
The genetic algorithm uses three main types of rules at each step to create the next generation from current population. They are follow as,
-
Selection rules select the individuals, called parents, that contribute to the population at the next generation.
-
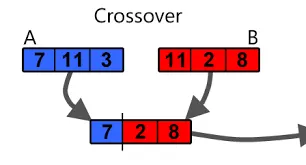
Crossover rules combine two parents to form children for the next generation.
-
Mutation rules apply random changes to individual parents to form children.
OPTIMISATION
Optimisation is basically an area of study that deals with minimise or maximise the particular function.
An stalagmite function is an user defined function, the mathematical expression are given below,
GLOBAL MAXIMA
The absolute maximum value of the function(the largest overall value of a set,ect.) over it's entire range.
GLOBAL MINIMA
The absolute minimum value of the function(the smallest overall value of a set,ect.) over it's entire range.
SYNTAX OF GENETIC ALGORITHM (GA)
GA (Genetic Algorithm) syntax is used to find minimum of function. The various syntax are described below,
x = ga(fun,nvars)
fun - function name
nvars - Number of variables
x = ga(fun,nvars,A,b,Aeq,beq,lb,ub)
fun - function name
nvars - Number of variables
A - Linear inequality constraints as real matrix
B - Linear inequality constraints as real vector
Aeq - Linear equality constraints as real matrix
Beq - Linear equality constraints as real vector
lb - Lower Boundary
ub - Upper Boundary
x = ga(fun,nvars,A,b,Aeq,beq,lb,ub,nonlcon,options)
fun - function name
nvars - Number of variables
A - Linear inequality constraints as real matrix
B - Linear inequality constraints as real vector
Aeq - Linear equality constraints as real matrix
Beq - Linear equality constraints as real vector
lb - Lower Boundary
ub - Upper Boundary
nonlcon - Non linear constraints
Options - Creating optimisation options using 'optimoptions'
EXPLANATION OF PROGRAM:
Main Program
- To assume the input values of x and y by using the linspace command and the split variables are also initiate in that command.
- With the input values x,y we created the 2D array using meshgrid.
- To get function of stalagmite which are created seperately in the other tab by calling the stalagmite_function.
- For loop is inserted for find the values of x and y. And values of 2D form of x and y to stalagmite_function.
- The surface plot is ploted with x,y, and z axis.
STUDY -1(STATISTICAL BEHAVIOUR)
- num_cases is assigned as 40, that will run the input values as 40 times so that GA can get minima value correctly.
- TIC-TOC command is used to find the time taken to run study 1.
- For loop is opened for run the function as 40 times and to get the output values. The output values are stored in xopt(i) and yopt(i).
- The ga syntax are used here is x = ga(fun,nvars)
fun - function name
nvars - Number of variables
- plot is done by the output values of x,y, and z and label are inititaed. The subplot is made with function maximum and iteration.
- For getting F maxima value we assigned negative sign so a inverted plot is obtained as GA function gives a global maxima.
- Now the results obtained are more boundary conditioned.
STUDY -2(STATISTICAL BEHAVIOUR WITH UPPER AND LOWER BOUNDS)
- In each study we need to apply TIC-TOC command for time taken to run the program in individual study.
- For loop is opened for run the function as 40 times and to get the output values. The output values are stored in xopt(i) and yopt(i).
- The ga syntax are used here is
x = ga(fun,nvars,A,b,Aeq,beq,lb,ub,nonlcon,options)
- plot is done by the output values of x,y, and z and label are inititaed. The subplot is made with function maximum and iteration.
- For getting F maxima value we assigned negative sign so a inverted plot is obtained as GA function gives a global maxima.
- Now the results obtained are less boundary conditioned
STUDY -3(INCREASING GA ITERATIONS)
- TIC-TOC command is used to find the time taken to run study 1.
- For loop is opened for run the function as 40 times and to get the output values. The output values are stored in xopt(i) and yopt(i).
- The ga syntax are used here is
x = ga(fun,nvars,A,b,Aeq,beq,lb,ub,nonlcon,options)
- The lower and upper boundary can be fixed to range in between if you know where is global maxima point will be nearly settled.
- plot is done by the output values of x,y, and z and label are inititaed. The subplot is made with function maximum and iteration.
- For getting F maxima value we assigned negative sign so a inverted plot is obtained as GA function gives a global maxima.
- Now the results obtained gives the global maxima using stalagmite function.
ANSWERED FOR QUESTIONS ASKED IN THE CHALLENGES
- GA syntax are varied for three studies and they explained in GA syntax algorithm
- num_cases is assigned as 40, that will run the input values as 40 times so that GA can get minima value correctly.
- In the study 3 options = optimoptions('ga')
options = optimoptions(options,'populationsize',150)
where populationsize are taken as 150 ( we taken the value of plpulation size is 170) whether the size are above from 50 the global maxima will obtain and its below from 50 local maxima will obtain - To obtain proper view (i,e non inverted) we given negative value to ' f ' at the time of plot.
- Graphs are plotted for all 3 studies and subplots are also used for F maximum vs no. of iterations.
INPUT PROGRAM:
clear all
close all
clc

%defining our search place

x = linspace(0,0.6,150);
y = linspace(0,0.6,150);
[xx yy] = meshgrid(x,y);
%creating 2dimensional mesh


%evaluating the stalagmite function
for i = 1:length(xx)
    for j = 1:length(yy)
        input_vector(1)=xx(i,j);
        input_vector(2)=yy(i,j);
        f(i,j) = stalagmite_func(input_vector);
    end
end

surface(xx,yy,-f)
shading interp
[input,func] = ga(@stalagmite_func,2)
xlabel('x value')
ylabel('y value')
zlabel('z axis')
colorbar
num_cases = 40

%time to study how long it takes
tic
%study 1- satistical behavior
for i = 1:num_cases
    [inputs,fopt(i)] = ga(@stalagmite_func,2);
    xopt(i) = inputs(1);
    yopt(i) = inputs(2);
end
study_1time = toc
figure(2)
subplot(2,1,1)
hold on
surfc(xx,yy,-f)
shading interp
xlabel('x axis')
ylabel('y axis')
zlabel('z axis')
colorbar
plot3(xopt,yopt,-fopt,'marker','o','markersize',5,'markerfacecolor','r')
title('unbounded inputs')
subplot(2,1,2)
plot(-fopt)
xlabel('iterations')
ylabel('function maximum')

tic
%study 2- satistical behavior with upper and lower bounds
for i = 1:num_cases
    [inputs,fopt(i)] = ga(@stalagmite_func,2,[],[],[],[],[0;0],[0.1;0.1]);
    xopt(i) = inputs(1);
    yopt(i) = inputs(2);
end
study_2time = toc
figure(3)
subplot(2,1,1)
hold on
surfc(xx,yy,-f)
shading interp
xlabel('x axis')
ylabel('y axis')
zlabel('z axis')
colorbar
plot3(xopt,yopt,-fopt,'marker','o','markersize',5,'markerfacecolor','r')
title('bounded inputs')
subplot(2,1,2)
plot(-fopt)
xlabel('iterations')
ylabel('function maximum')

%study 3- increasing GA iterations

options = optimoptions('ga');
options = optimoptions(options,'populationsize',150);

tic

for i = 1:num_cases
    [inputs,fopt(i)] = ga(@stalagmite_func,2,[],[],[],[],[0;0],[0.1;0.1],[],[],options);
    xopt(i) = inputs(1);
    yopt(i) = inputs(2);
end
study_3time = toc
figure(4)
subplot(2,1,1)
hold on
surfc(xx,yy,-f)
shading interp
xlabel('x axis')
ylabel('y axis')
zlabel('z axis')
colorbar
plot3(xopt,yopt,-fopt,'marker','o','markersize',5,'markerfacecolor','r')
title('bounded inputs with modified population size')
subplot(2,1,2)
plot(-fopt)
xlabel('iterations')
ylabel('function maximum')
FUNCTION PROGRAM
function [F] = stalagmite_func(input_vector)
 x = input_vector(1);
 y = input_vector(2);
P = (sin(5.1*pi.*x+0.5)).^6;
Q = (sin(5.1*pi.*y+0.5)).^6;
R = (exp(-4*log(2)*((x-0.0667).^2)/0.64));
S = (exp(-4*log(2)*((y-0.0667).^2)/0.64));
F = -(P.*Q.*R.*S);

end
OUTPUT:
RANGE PLOT
STUDY -1(STATISTICAL BEHAVIOUR)
STUDY -2(STATISTICAL BEHAVIOUR WITH UPPER AND LOWER BOUNDS)
STUDY -3(INCREASING GA ITERATIONS)
STUDY TIME ANALYSIS:
TIC-TOC command is used to measure how long to takes to complete study. Here the time taken for 3 studies are initiate below,
- study_1time = 3.1736
- study_2time = 4.7245
- study_3time = 10.7550
WORKSPACE DATA:
The value of X and Y for global maximum is shown below,
ERROR OCCUR WHILE PROGRAMMING:
The variable 'xx' was not defined, so it was defined and I rectified the error.
CONCLUSION:
Global maxima of a stalagmite function is calculated by using GA algorithm is done.The Graph for F maxima VS no.of iteration is ploted and noted when the populationsize is increased the time for study are also increased by 4 times but the result will be precise. In MATLAB GA will always give a mimina value but we want to find the maxima value in this challenge so inverse the function (f by negative value) and we will get the global maxima of a stalagmite function.