Centrifugal Pump Design and Flow Analysis using Solidworks
MODELLING AND SIMULATION OF FLOW THROUGH CENTRIFUGAL PUMP USING SOLIDWORKS
Objective
To Create a 3D Model of Centrifugal Pump & to simulate flow analysis (CFD Analysis) and obtain a relationship between Pressure ratio & Mass Flow Rate.
Theory
Computational fluid dynamics (CFD) is a branch of fluid mechanics that uses numerical analysis and data structures to analyze and solve problems that involve fluid flows. Computers are used to perform the calculations required to simulate the free-stream flow of the fluid, and the interaction of the fluid (liquids and gases) with surfaces defined by boundary conditions.
Centrifugal Pump
A centrifugal pump is a mechanical device designed to move a fluid by means of the transfer of rotational energy from one or more driven rotors, called impellers. Fluid enters the rapidly rotating impeller along its axis and is cast out by centrifugal force along its circumference through the impeller’s vane tips. The action of the impeller increases the fluid’s velocity and pressure and also directs it towards the pump outlet. The pump casing is specially designed to constrict the fluid from the pump inlet, direct it into the impeller and then slow and control the fluid before discharge.
The impeller is the key component of a centrifugal pump. It consists of a series of curved vanes. These are normally sandwiched between two discs (an enclosed impeller). For fluids with entrained solids, an open or semi-open impeller (backed by a single disc) is preferred (Figure 1).
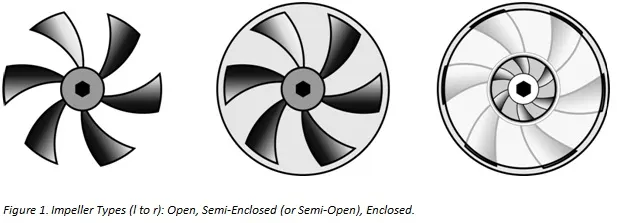
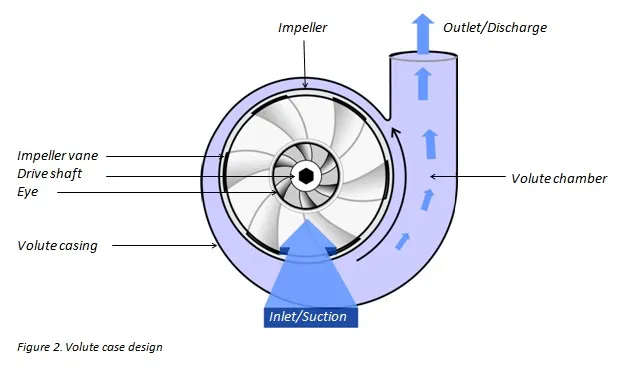
Fluid enters the impeller at its axis (the ‘eye’) and exits along the circumference between the vanes. The impeller, on the opposite side to the eye, is connected through a drive shaft to a motor and rotated at high speed (typically 500-5000rpm). The rotational motion of the impeller accelerates the fluid out through the impeller vanes into the pump casing.
There are two basic designs of pump casing: volute and diffuser. The purpose in both designs is to translate the fluid flow into a controlled discharge at pressure.
In a volute casing, the impeller is offset, effectively creating a curved funnel with an increasing cross-sectional area towards the pump outlet. This design causes the fluid pressure to increase towards the outlet (Figure 2).
--------------------------------------------------------------------------------------------------------
Geometry
--------------------------------------------------------------------------------------------------------
Run an Baseline Simulation
- Create an Centrifugal Pump Model mainly with Impeller with 5 or 6 blades and an Casing around it with suitable dimensions to match for pumping characterstics. The casing should have an axial inlet and an radial outlet as shown.
- Since there is an rotating element impeller, and hence to simulate an deforming mesh/ simulate the rotation we have to follow the approach called as Moving Reference Frame, in which wil create an zone or an volume over the impeller, on which the governing equations are solved to simulate the effect of rotation. Model this in such a way over the impeller that this bounded region doesnot comes in contact with casing.
- Go to Flow Simulation
- Create Lids at both of the Pump Openings.
- Create Wizard
- Go with the default unit system
- Analysis :- Internal & Select Rotation with Local Region Averaging
- Working Fluid :- Water
- Go with default wall conditions, thermodynamic & velocity parameters.
- Click on Input data -> Component Control and exclude the Extrude/Model of Volume Zone created over from Impeller.
- Click on RotationZone -> Insert Rotation Zone -> Add the above excluded zone here, and edit the direction and speed of the rotation to 1000rad/s.
- Add Boundary Conditions
- @ Inlet (lid/face) add an Environmental Pressure.
- @ Outlet (lid/face) add Outlet Velocity = 10m/s.
- In Mesh, enable Advance Channel Refinement.
- To avoid the Solution to Converge quickly, Click on Input data -> Calculation Control Options -> Enable only Iterations in Criterion and set to 500.
- Add Goals
- Surface Goal -> Avg Total Pressure @ Outlet Lid
- Surface Goal -> Avg Total Pressure @ Inlet Lid
- Surface Goal -> Mass Flow Rate @ Outlet Lid
- RUN the Simulation.
--------------------------------------------------------------------------------------------------------
Result
Velocity Plot
Pressure Plot
Velocity Flow
Pressure Flow
Flow Animations
--------------------------------------------------------------------------------------------------------
Parametric Study
With the same above simulation setup, create a Parametric study.
- Input Variables
- Simulation Parameters -> Boundary Conditions -> Outlet Velocity & Click on discrete Values and then set from 10m/s to 30m/s.
- Output Variables
- Add Goals -> All (Total Pressure1, Total Pressure2, Mass Flow Rate)
- Add Result -> Cut Plots & Flow Trajectories
- 5 Scenarios will be created
- RUN the Simulation
***With the above setup , further Optimization was done by setting Mesh Refinement level to 4 and Number of Iteration to 1000.
Results
Goals
Pressure Ratio = Outlet Pressure/ Inlet Pressure

For 5 Design Points,

P1 = 149699.93/101325   =  1.48
P2 = -82909.24/101325   = -0.82
P3 = -381532.20/101325  = -3.76
P4 = -866966.09/101325  = -8.55
P5 = -1349165.98/101325 = -13.31

** The decrease in the Pressure Ratio Value is due to the fact that Pressure
   @ Outlet decreases with increase in the Outlet Velocity, which ultimately
   refers to the increase in Pressure drop.

*** Pressure drop values are Negative because of the improper design of Pump.
Pressure Plots
@ Outlet Velocity of 10m/s
@ Outlet Velocity of 15m/s
@ Outlet Velocity of 20m/s
@ Outlet Velocity of 25m/s
@ Outlet Velocity of 30m/s
Velocity Plots
@ Outlet Velocity of 10m/s
@ Outlet Velocity of 15m/s
@ Outlet Velocity of 20m/s
@ Outlet Velocity of 25m/s
@ Outlet Velocity of 30m/s
--------------------------------------------------------------------------------------------------------
Conclusion
Total Pressure @ Outlet
The Pressure @ Outlet decreases with increase in Velocity
Mass Flow Rate @ Outlet
The Mass Flow Rate @ the Outlet increases with increase in Velocity, but here in this plot ivalues are in Negative axis since volume is going out of the Simulation domain.
The Mass Flow rate increases with decrease in the Pressure Ratio
---------------------------------*********END*********-----------------------------------------