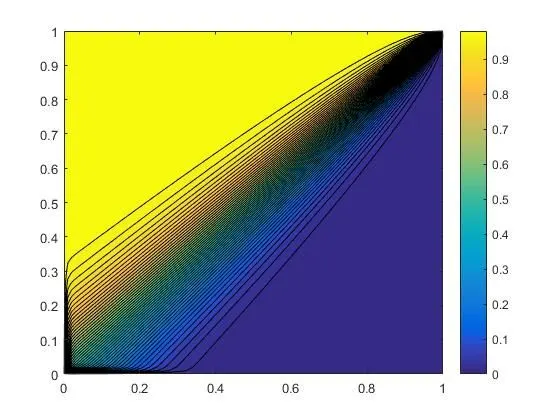
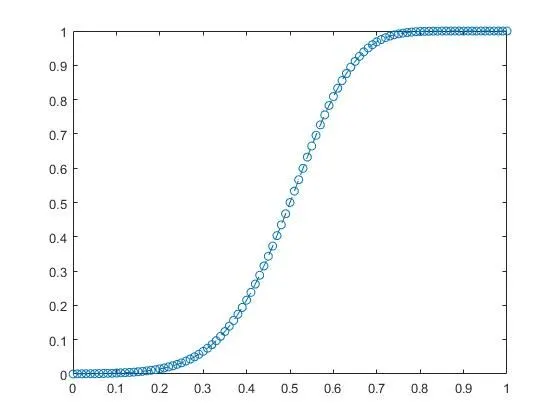
clear all
close all
clc

%% Definig the Problem Domain
n_points = 101;
dom_length = 1;
h = dom_length/(n_points-1);

x = 0:h:dom_length; % x domain space
y = 0:h:dom_length; % y domain space

% Initializing the problem
T(1,1:n_points) = 1;
T(1:n_points,1) = 1;

T_new(1,1:n_points) = 1;
T_new(1:n_points,1) = 1;

rho = 1;
u = 1;
v = 1;

gamma = 0.0025;
P = rho*u*h/gamma;

%% Differencing Scheme

error = 1;
iterations = 0;

while error > 1e-7
    for i = 2:n_points - 1;
        for j = 2:n_points -1;
            a_E = gamma;
            a_W = gamma + rho*u*h;
            a_N = gamma;
            a_S = gamma + rho*v*h;
            a_P = rho*u*h  + rho*v*h + gamma + gamma + gamma + gamma;
            T_new(i,j) = (a_E*T(i+1,j) + a_W*T(i-1,j) + a_N*T(i,j-1) + a_S*T(i,j+1))/a_P;
        end
    end
     iterations = iterations + 1;
     error = 0;
     for i = 2 : n_points -1;
         for j = 2:n_points - 1;
             error = error + abs(T(i,j) - T_new(i,j));
         end
     end

     T = T_new;

end


%% Plotting

x_dom = ((1:n_points)-1).*h;
y_dom = 1 - ((1:n_points)-1).*h
[X,Y] = meshgrid(x_dom,y_dom);
contourf(X,Y,T, 50)
colorbar

%% Centreline temperature

figure;
plot(1-y,T(:,(n_points+1)/2),'--o')